Pipeline Coverage Through the Quarter: Gap-to-Goal Coverage vs a Fixed 3x Target
Learn when gap-to-goal coverage beats a fixed 3x target for quota tracking through the quarter


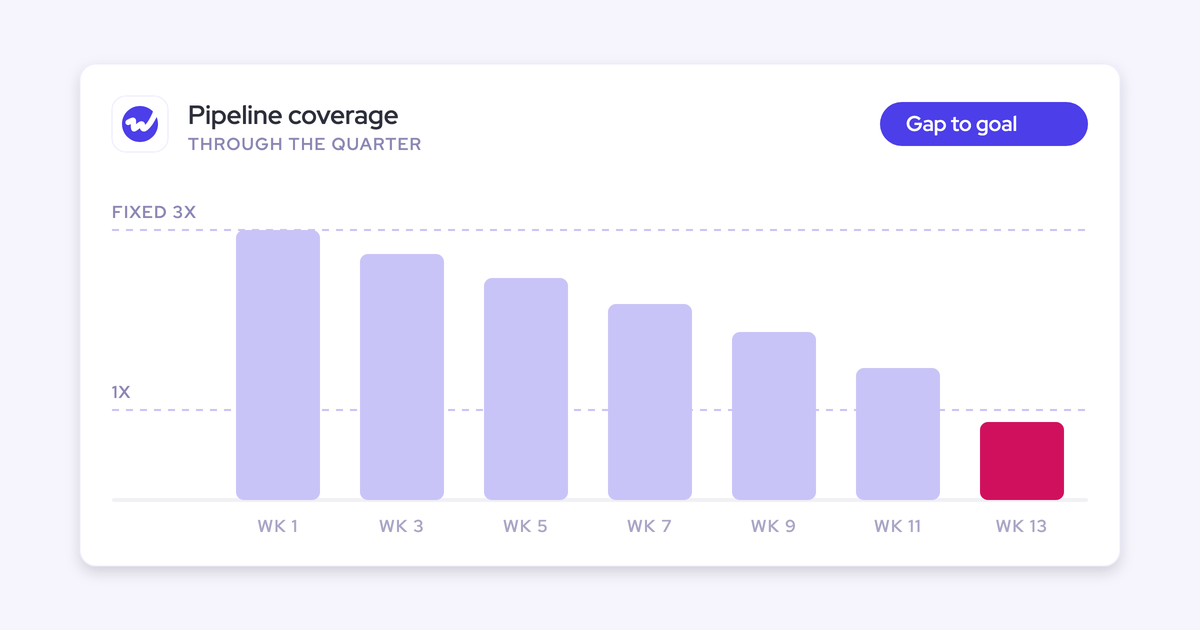

You've probably lived this quarter: in week one, the pipeline reads 3x and everyone relaxes. By weeks five to seven, deals slip and stall, the coverage you reported at kickoff is gone, and there's no time left to build more.
The fix is to treat coverage as a curve, not a constant, and to derive your target from four of your own numbers instead of borrowing one from a conference talk:
- A gap-to-goal denominator: target minus closed won, minus the business you historically create and close inside the quarter.
- A numerator fixed to the stage you win from at a known rate.
- A required multiple of 1 ÷ that stage's win rate, set per motion.
- A weekly read against an expected decay curve, from about 3x toward 1x.
If you'd rather not rebuild it in Excel every quarter, Weflow Deal Intelligence & Forecasting keeps targets, gap to goal and coverage on the same page as your forecast.
What is gap-to-goal pipeline coverage?
Gap-to-goal pipeline coverage is open pipeline divided by the gap to goal, meaning the period's target minus what you've already closed.
That denominator lets the ratio decay correctly as bookings land: closed business no longer needs covering, so it drops out of the math.
The numerator matters just as much. Depending on which pipeline it counts, the same team can report 1.8x or 4x, which is why two teams quoting "3x" often mean different things.
| Element | Ratio most teams report | Gap-to-goal ratio |
|---|---|---|
| Denominator | The full period target | Target minus closed won (and, in the derived version, minus expected create-and-close) |
| Numerator | All open pipeline, every stage, nominal and weighted mixed | Pipeline from one fixed stage, nominal or weighted, chosen once |
| As bookings land | Falls as won deals leave open pipeline, which looks like trouble even when you're on track | Shrinks with the gap, so the ratio tracks what's actually left to cover |
| Late in the quarter | Sounds false alarms, so people learn to ignore it | Tells you whether the pipeline that's left can cover the number that's left |
Why a fixed 3x pipeline coverage target misleads most teams
A fixed 3x target quietly assumes you win about one in three deals from the stage you measure from, and if you don't, 3x is the wrong number for you.
If you win 20% from stage 3, 3x leaves you short. If you win 50%, it has you creating pipeline you don't need Jeff Ignacio put the hidden assumption plainly on our podcast:
"Now three x tells you a couple of things. Your win rate should be like one third. That's kind of like the quick heuristic thinking. Okay. You're already panicking because maybe you're not winning at thirty three percent. I win at thirty three percent starting at stage three. So let me take it. Let me look at my pipeline coverage ratio of stage three pipeline divided by gap to goal."
Then there's timing. A flat target can't tell you whether 2.1x is healthy in week 2 or alarming in week 10, because it reads the same at both points.
Our co-founder Philipp Stelzer goes further: the right number can even sit below 1x.
"Even, you know, some companies have, like, a coverage of zero point eight only, but they still always make their end of year goal. So, you know, even that is something that, you know, theoretically is, it doesn't mean that it's bad. But, also, to be clear, without understanding what coverage you actually need to have, how would you know that you are lagging behind in terms of opportunities created?"
And that's the real job of a coverage target: telling you, early enough to act, whether you're behind on pipeline creation.
How to calculate your own pipeline coverage target
Your required coverage is the inverse of your win rate from a chosen stage, and you compare it against stage pipeline over a corrected gap to goal:
Actual coverage = stage-N pipeline ÷ (target − closed won − expected in-quarter create-and-close)
Required coverage = 1 ÷ stage-N win rate
If actual sits at or above required, your pipeline can cover the number you still need, and every input comes from your own history.
Subtract closed and in-quarter create-and-close business from target
Start by removing what's already won, plus the share of business you historically create and close inside the same quarter. Skip that second part, and the ratio overstates what your existing pipeline has to deliver and sounds false alarms.
Most teams close a predictable slice of deals that never appear in the carry-in pipeline because they're born and won in-quarter. To estimate that slice:
- Pull closed-won bookings for your last four quarters.
- For each quarter, sum the bookings whose opportunity was also created inside that quarter.
- Divide by total bookings for the quarter. That's your create-and-close share.
- Apply the share to this quarter's target and subtract the result from the gap.
- Use the same history window you use for the win rate, so both inputs describe the same business.
One thing to watch: once create-and-close deals actually close, they show up in closed won, so lower the expected create-and-close amount by the same figure or you'll subtract them twice.
Start the numerator at the stage you win from
Next, count pipeline from the stage where you have a known win rate, for example stage 3. Counting all open pipeline gives you the biggest ratio and the least information, because early-stage deals convert at a fraction of late-stage ones.
Then make three decisions once and stick to them:
- Pipeline from a chosen stage onward ties the ratio to a win rate you can actually measure.
- Close date inside the period keeps next quarter's deals from padding this quarter's ratio.
- Nominal versus weighted changes the scale of the number, so pick one and match it to how you measured the win rate.
Stage 1–2 deals need a judgment call, since some will reach stage 3 in time to matter, especially early in the quarter. Decide whether your cycle length allows for that, and write the rule down.
Lock the definition in before you compare teams or quarters, or you'll end up comparing two different ratios with the same name.
Set the required multiple at 1 ÷ your stage win rate
A 33% stage-3 win rate implies 3x, and here's how other rates translate:
| Stage win rate | Required multiple |
|---|---|
| 20% | 5.0x |
| 25% | 4.0x |
| 33% | 3.0x |
| 50% | 2.0x |
| 75% | 1.33x |
Measure the win rate as the share of now-closed deals that reached the stage and were won, over a recent window. Skip the stage probabilities someone typed into Salesforce once and never revisited, since those drift away from how your deals actually convert.
How pipeline coverage should decay week by week through the quarter
Pipeline coverage converges from about 3x at the start of the quarter toward 1x at the end. Since the same ratio means different things in week 2 and week 10, you need to read it against an expected curve.
That's down to the mix. Early on, much of the pipeline sits in earlier stages, while late in the quarter, what's left is late stage and converts at a higher rate, so you need less of it.
"Your pipeline coverage ratio changes throughout the life of that quarter. It converges from three and it shrinks down to one. Hopefully, you're not under one because then you're in a bad spot."
Here's how Jeff's framework plays out week by week:
| Weeks | What's happening in the pipeline | How to read coverage |
|---|---|---|
| Weeks 1–2 | Deals snowplowed over from last quarter inflate the open pipeline | Noise. Don't act on it |
| Weeks 2–3 | Clean-up: carried deals get re-dated, re-staged or closed out | Watch the corrections, not the ratio |
| Week 4 | The first honest look at the carry-in pipeline | Your first real comparison against the required multiple |
| Weeks 5–9 | Optimism builds as deals advance | A drop that matches bookings landing is healthy. A drop with no matching bookings means deals slipped |
| Week 10 | Deals start pushing into next quarter | Separate pushed from lost. A push moves coverage into next quarter |
| Quarter end | The ratio approaches 1x | Below 1x, the remaining number can't be covered |
To build your own curve, record each motion's ratio on the same day every week, then lay past quarters on top of each other. That gives you a reference line no benchmark can.
A worked example of a derived coverage target, in numbers
This is the question we hear from RevOps leaders modeling coverage by hand:
Here's how the method answers it for a new-logo team at week 4:
- Target: $1,200,000 for the quarter.
- Closed won so far: $200,000.
- Expected create-and-close: The last four quarters show 15% of bookings created and closed in-quarter. 15% of $1.2M is $180,000, and none of it has landed yet.
- Gap to goal: $1,200,000 − $200,000 − $180,000 = $820,000.
- Stage-3+ pipeline closing this quarter: $1,900,000.
- Stage-3 win rate over the last 180 days: 40%, so the required multiple is 1 ÷ 0.40 = 2.5x.
- Actual coverage: $1,900,000 ÷ $820,000 = 2.32x.
- Pipeline needed: $820,000 × 2.5 = $2,050,000. You have $1,900,000, so you need $150,000 more at stage 3 or later.
Now compare that with a flat 3x. The same team has $3,000,000 of open pipeline across all stages against the full $1.2M target, so it reports 2.5x. Against a 3x target, that says "go create $600,000 of pipeline, any stage."
The derived method says something different: $150,000 more at stage 3 or later. And since week 4 is the first honest read, you still have time to find it.
Those are two very different pipeline-generation decisions, and only one comes from your own conversion history.
Why new logo, expansion and renewal need separate coverage targets
New logo, expansion and renewal convert at very different rates (roughly 20% to 75%), so a single blended coverage ratio will mislead you.
We see this on calls all the time: a healthy enterprise team masks a regional segment sitting at 1.4x, and nobody notices until the miss lands. That's why you should run the derivation per motion, and per segment wherever segments convert differently.
| Motion | Win rate and required multiple | How to read it |
|---|---|---|
| New logo | 20% → 5x | 3.5x is short here, even when the blended number looks fine |
| Expansion | 50% → 2x | 2.5x is comfortable |
| Renewal | 75% → 1.33x | 1.4x is healthy here, the same ratio that would be a crisis in new logo |
| Blended | One ratio against one 3x target | Hides which motion is actually short |
Each motion also deserves its own cadence. Robert Gimbel, former CRO at Camunda, runs a weekly sales forecast, a separate weekly renewals forecast and a monthly pipeline-generation forecast.
Renewals involve different deals and different people, so folding them into one meeting blurs the conversation.
When the derived coverage method fits, and when it doesn't
The method fits most B2B teams with a defined stage path and a few quarters of history. That said, cycle length and stage mix change what coverage means, and 3x still has one legitimate use.
SMB cycles under 30 days: track create-and-close pacing instead
With sales cycles under 30 days, much of the quarter's business is created and closed inside it, so start-of-period coverage tells you little. Instead, track how much pipeline you create and close each month against your historical trend.
"If you're selling to SMB businesses and your sales cycles are less than thirty days, pipe coverage means something very different. So then you have to move toward looking at how much of our pipeline do we create and close in a month and, like, understanding the historical trends there to give you a better read on are we pacing to where we need to be."
Long enterprise cycles: 1.5–2x late-stage coverage can be enough
A long-cycle team that carries late-stage pipeline into each quarter can hit target at 1.5x to 2x coverage. At Camunda, for example, coverage coming into a quarter was never above 2x, because the carry-in pipeline was already late stage.
The derivation handles this on its own: a high stage win rate produces a low required multiple, whereas a flat 3x would have flagged a crisis every quarter.
When 3x is still right: a next-quarter pipeline-creation target per rep
Laura Fu, Head of RevOps & Strategy at DevRev, uses 3x as a pipeline-creation target instead: each rep builds roughly three times next quarter's quota in pipeline, and that's the primary productivity check.
"So I actually think that pipeline, the ability to create pipeline is owned by the rep."
That's a legitimate use, because it sets how much pipeline a rep should create for a future period. Just don't read it as an in-quarter health ratio.
How unearned stages and deal count make coverage lie
Even a correctly derived ratio can lie when stages aren't earned, opportunities get created late, or the deals behind it can't be worked. Every input traces back to your stage data, so the method is only as honest as your stages.
Pipe-padding dilutes the win rate your target is built on
Reps under pipeline pressure open deals that don't meet criteria, and new AEs do it most. After all, a thin pipe earns a hard conversation with a manager, and a fat one doesn't.
"Or you're bringing in new people, new AEs to the business, and they wanna create their pipeline, they wanna fill their pipe, and they rather take too much than too little, so you need to guide people in the way that you want the business to run."
The damage shows up two quarters later, when those deals dilute the historical win rate your required multiple comes from and the model starts lying in the direction of optimism. To guard against it, you need:
- One written definition of a qualified opportunity, used by every team.
- Written exit criteria per stage, so stage 3 means the same thing in every region.
- A weekly check of new opportunities against those criteria, by the manager and again by RevOps.
- Cohorts by creation date, compared at the same age.
The last one is what catches drift.
"But not filtering by close dates in Salesforce terms, but filtering by creation date and see how much of that pipeline did we close."
If a cohort converts well below its usual rate, either deals are stuck or qualification got sloppy that quarter.
Late-created opportunities make cycles look shorter than they are
Some reps open the opportunity near the end of the cycle on purpose, because when managers judge deals by attached activity, an early opportunity means weeks of visible inactivity.
That corrupts two of your inputs at once. Those deals inflate the create-and-close share and push the stage win rate up, since the opportunity only existed for the part that went well. As a result, your required multiple ends up too low.
4x coverage on 150 open deals isn't workable pipeline
Coverage built on volume nobody can work is fiction. One RevOps leader described exactly this on a call with us:
That's why you should read coverage alongside deal count per rep, inactivity, cycle length and win rate. If a rep's ratio clears the required multiple but half their deals haven't seen activity in a month, the ratio is overstating that rep's coverage.
How to run gap-to-goal coverage in your forecast cadence
Coverage becomes a decision tool when you read it on a fixed cadence, at each level of the hierarchy, looking forward as well as at the current quarter.
Read this quarter's coverage weekly from week 4
Treat weeks 1–3 as clean-up. From week 4, run the same routine every week:
- Recompute the gap to goal per motion, netting closed won and the remaining expected create-and-close.
- Compare each motion's actual coverage to its required multiple.
- Plot the ratio against your curve for the same week in past quarters.
- For any motion off the curve, split the movement into pushed, lost and decreased, then open the deals.
- Turn the shortfall into a pipeline number per team, at the stage that counts.
Track next quarter's coverage from mid-quarter
As the quarter runs, widen the horizon.
Kristina Kardell's cadence brings next-quarter coverage into the monthly review from mid-quarter, while Philipp Stelzer tracks one and two quarters forward, so a shortfall shows up while there's still time to create pipeline against it.
| Point in the quarter | What the review covers |
|---|---|
| Early quarter | Last month's results, the coming month, and where this quarter will land |
| Mid-quarter | Next quarter's pipeline coverage, plus the quarter after |
| Late quarter | Next quarter's bookings forecast, timed to your cycle length (with short cycles, there's little to forecast until close to the start) |
Keep the manager buffer target out of the roll-up
Manager targets deliberately sit below the sum of rep quotas, so compute gap to goal per level against that level's own target, never by summing the targets beneath it.
Here's a common setup: Three first-line managers carry $1M each. Their senior leader carries $2.5M. The $500k difference is a deliberate buffer for attrition, ramp and a bad patch.
If your model adds up the managers' targets, the senior leader's gap to goal is $500k too big and their coverage looks worse than it is. Keep each level's target as its own input.
If you want the full operating routine around this, our Free Guide: Deal Insights & Pipeline Management Best Practices covers the pipeline reviews and deal inspection that keep coverage honest week to week.
Can you run this in Salesforce reports and a spreadsheet?
Yes for the target, partly for the curve. With clean stages, you can derive your coverage target in a spreadsheet from Salesforce reports. The weekly curve is harder, because Salesforce only shows pipeline as it stands now and keeps no snapshots.
| What you need | Salesforce reports plus a spreadsheet | Needs stored pipeline history? |
|---|---|---|
| Gap to goal today | Yes, with targets kept in the sheet | No |
| Stage win rate | Yes, from closed opportunities and stage history | No |
| Create-and-close share | Yes, by comparing created date and close date | No |
| Per-motion targets | Yes, one tab per motion | No |
| Weekly decay curve | Only if you export and save the ratio every week | Yes |
| Same week last quarter | Only from your own saved exports | Yes |
| Where coverage went (pushed, lost, decreased) | Not from current-state reports | Yes |
And starting small is fine. Here's Philipp Stelzer's advice to teams building pipeline reporting:
"It's fine if you only have, like, three or four, you know, or maybe just two, like, basic reports to get started with, and then you work your way, you know, up from there."
If your stages are clean and someone owns the weekly export, you can run this method without another tool. The cost is rebuilding it every cycle, plus history that only exists if you remember to save it.
How Weflow Deal Intelligence & Forecasting tracks gap-to-goal coverage
Weflow is the Revenue AI Orchestration platform for sales, customer success, and RevOps teams. Built for Salesforce teams, Weflow Deal Intelligence & Forecasting puts targets, gap to target and coverage on the forecast page, per motion, with snapshot history behind them.
Here's where each input of the method lives.
Targets, gap to target and coverage as forecast sheet columns
Quota, target attainment, gap to target, gap to each forecast call, pipeline coverage and commit coverage are all columns you add to the Weflow forecast sheet. Win rate, average deal size and sales cycle length sit beside them as analytics columns.
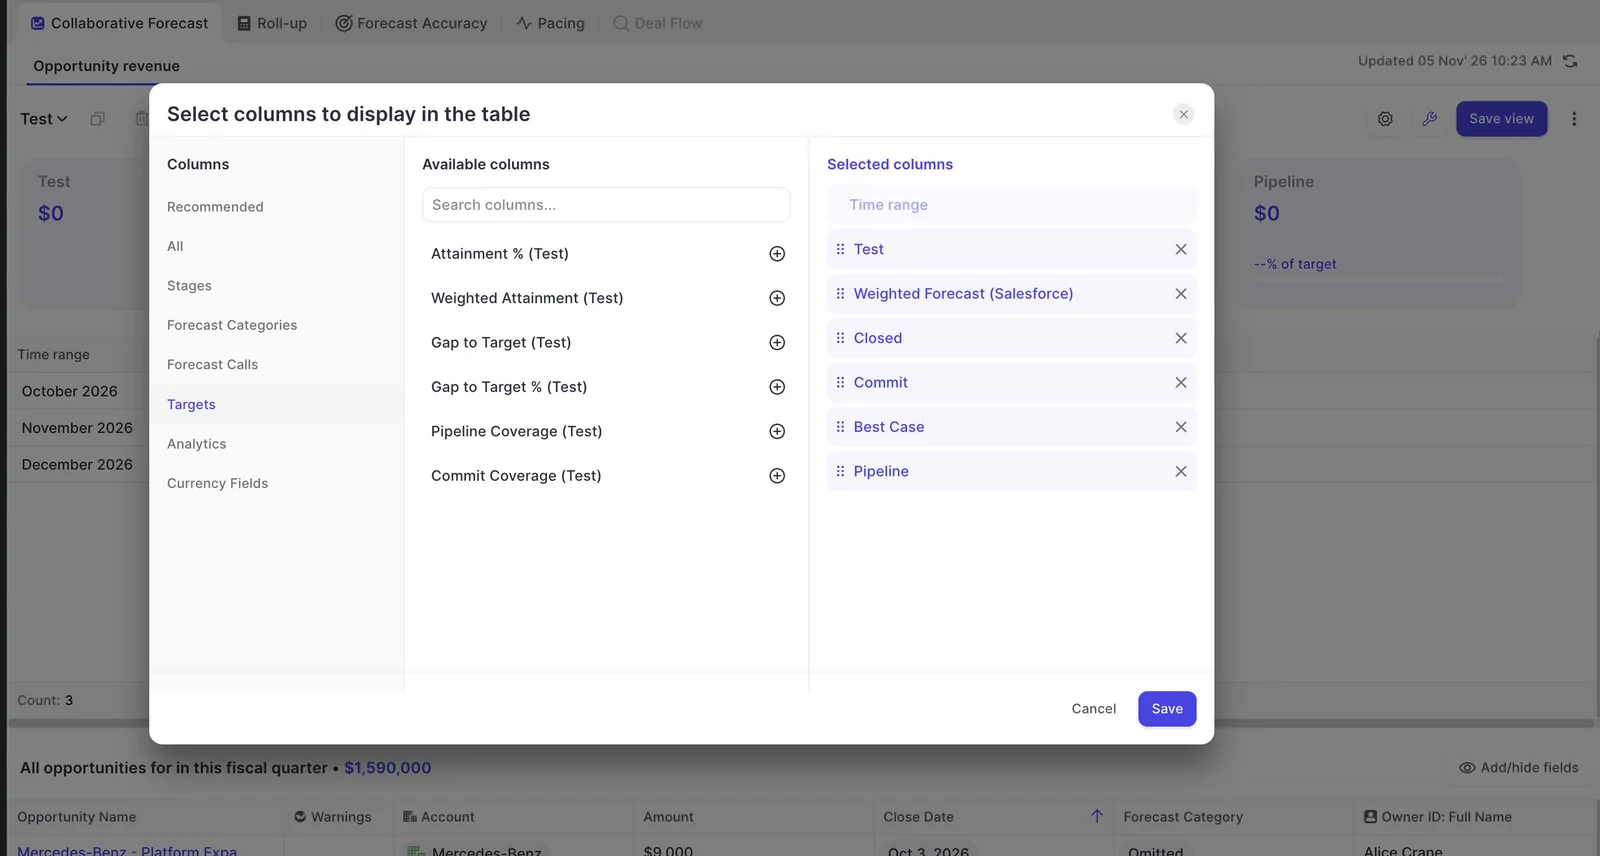
To net out expected create-and-close business, admins can add it as a formula column, which puts the method's denominator on the same sheet as the forecast call.
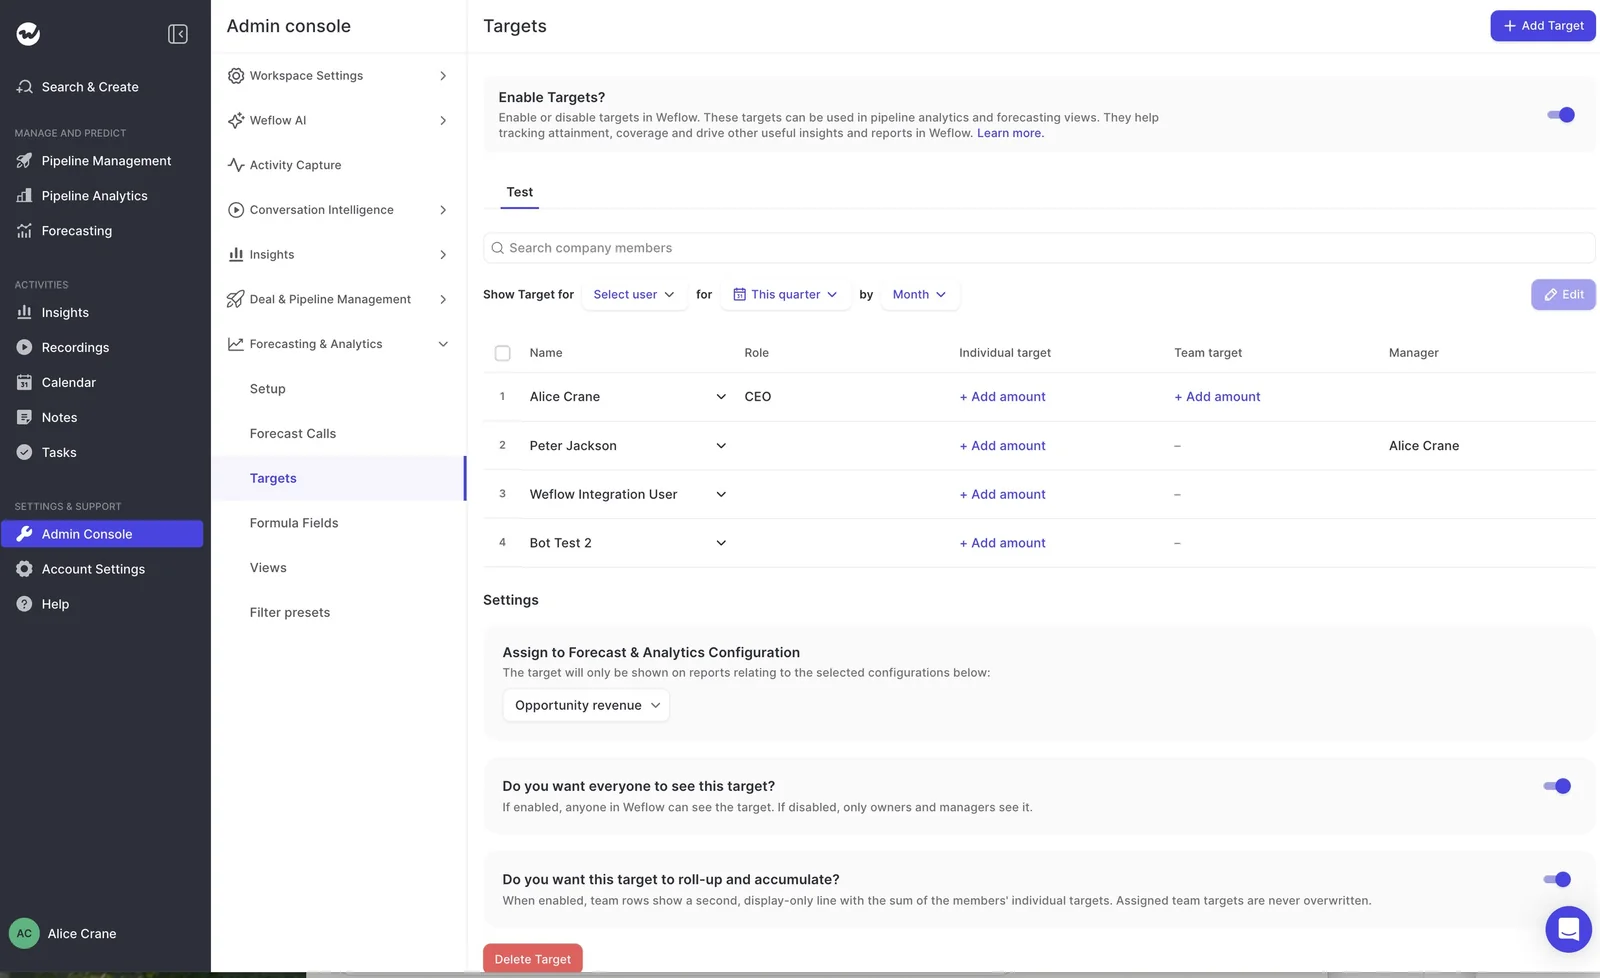
Targets are set per user by month or quarter, entered in the Admin Console or bulk uploaded from a file. A manager can carry a team target set on its own.
When roll-up is switched on, the team row shows a display-only sum of members' targets beside it, and the assigned team target is never overwritten, so your manager buffer stays visible.
A separate forecast setup and win rate per motion
You can run several forecast setups in parallel in Weflow. Each has its own revenue field, stages, cadence, targets and forecast calls, so new logo, renewal and expansion each carry their own coverage instead of one blended ratio.
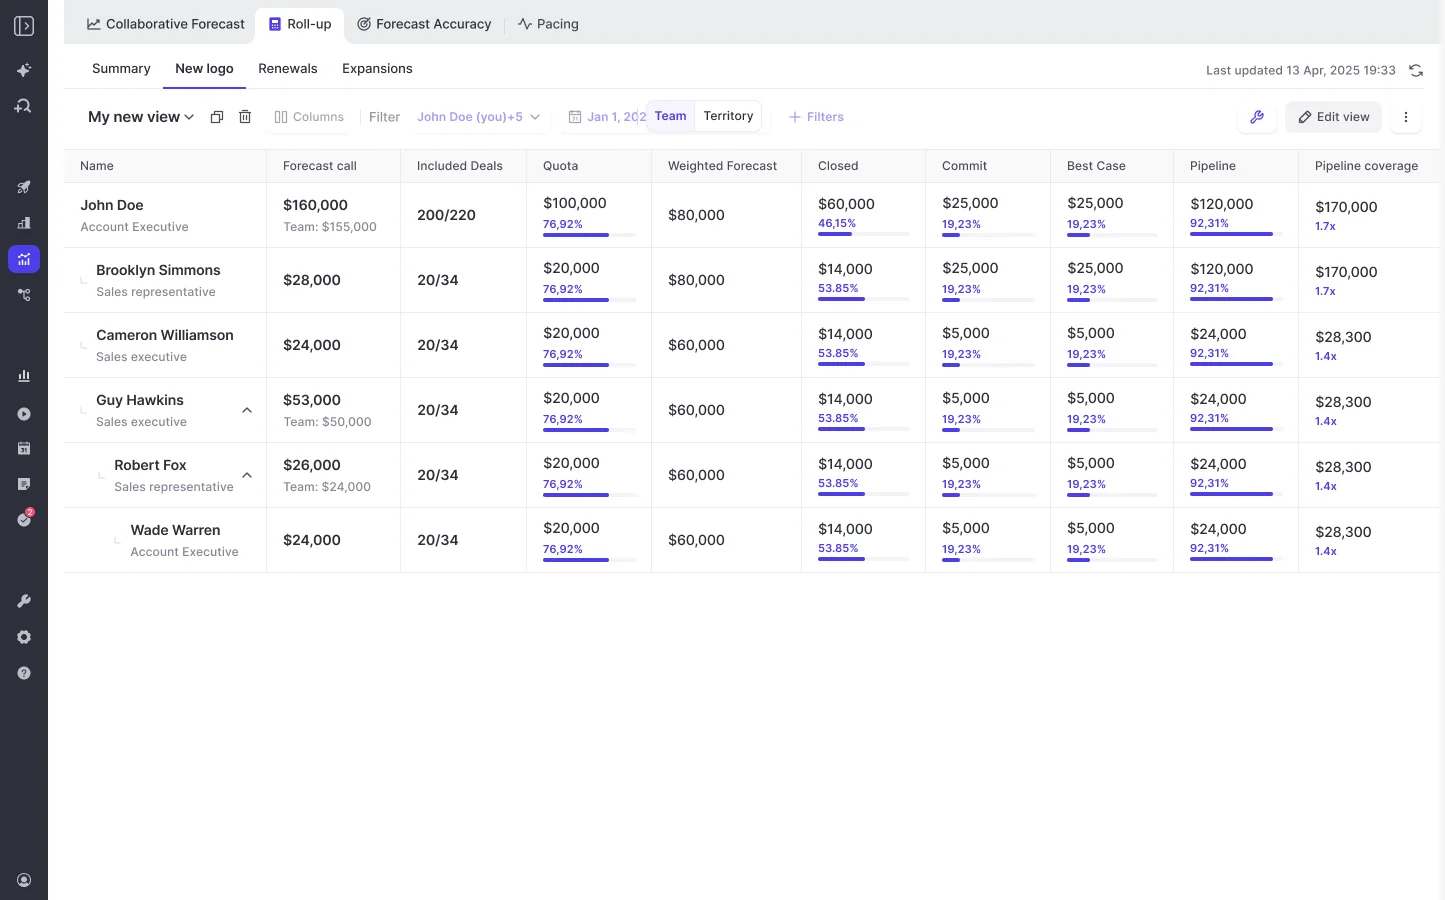
For the 1 ÷ win rate input, our dynamic weighted forecast recomputes stage win rates per rep and team over a rolling 90- or 180-day window, ignoring the static stage probabilities in Salesforce. It's switched on per workspace.
The Stage Win Rate report shows each stage's rate over time, measured as the share of now-closed deals that were won after reaching that stage. That's the rate the method needs.
Hourly snapshots and the waterfall show where coverage went
Weflow snapshots opportunity data every hour. The waterfall reconciles starting pipeline to ending pipeline through created, increased, moved in, moved out, lost, decreased and won, and each bucket drills down to the deals.
That answers the "coverage evaporated by week six" problem: you see whether it pushed, died or shrank, and which deals did it.
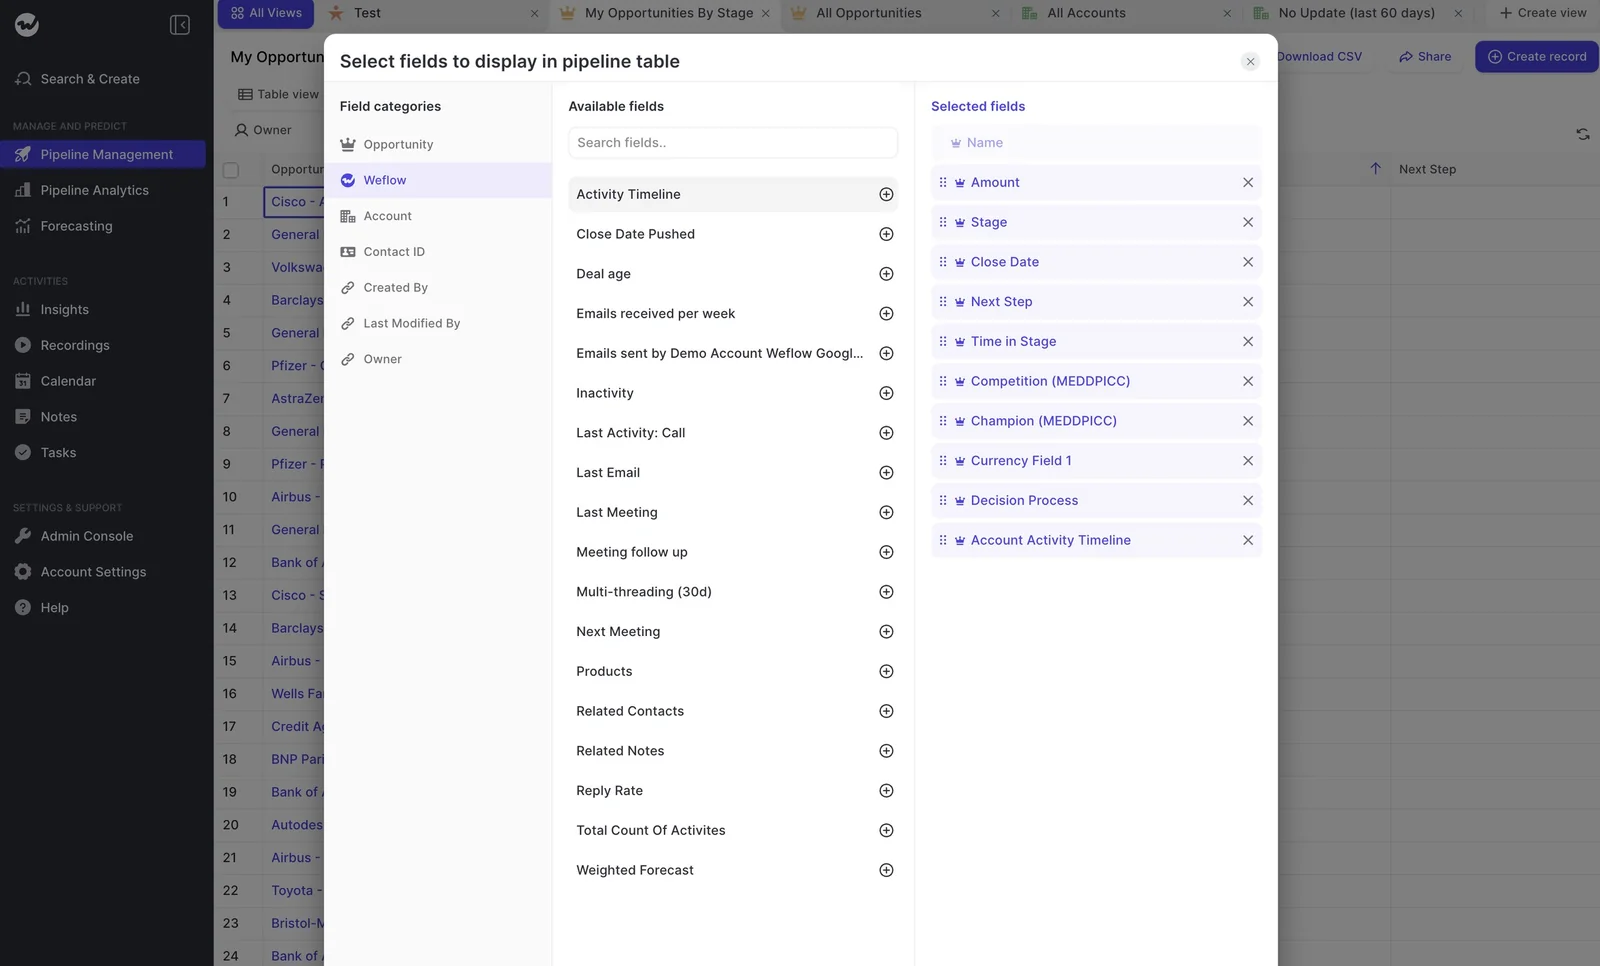
Deal signals sit beside the ratio as columns in the same pipeline view: inactivity, close date pushed, deal age and multi-threading over 30 days. A rep at 4x on 150 deals shows up in the table, with the inactivity next to it.
Week 4 is where this pays off. Zeotap runs its forecast cadence in Weflow, and its CRO describes the result in terms of that same week:
"With Weflow, we forecast within 7% by week 4 of the quarter."
The out-quarter view and MCP connector for next quarter's gap
The out-quarter view filters pipeline by target quarter, segment and stage. You see next quarter's coverage building from mid-quarter, before this one closes.
For the "how much more pipeline do we need" question, the Weflow MCP connector gives assistants such as Claude or ChatGPT read-only access to the numbers. For each rep in scope it returns:
- Coverage ratio and gap to forecast.
- Win rate, weighted and unweighted pipeline, and average sales cycle length.
- Targets and manager targets, where your org has configured them in Weflow.
- The opportunity IDs behind every number.
A per-rep breakdown covers up to 25 owners per request.
Where Weflow's coverage tracking stops today
Weflow doesn't cover everything this method asks for, so here's what you'll still handle yourself:
- Weflow has no trend view comparing today's pipeline with the same week in earlier quarters, so building your decay curve means comparing snapshots by hand.
- Netting expected create-and-close business out of the denominator is a formula column you set up, not a built-in calculation.
- Targets are monthly at the finest grain, so you can't set weekly targets.
- Targets are amounts only, so you can't set a target for a number of deals or new logos.
- Weflow doesn't read targets from Salesforce, so if you keep targets in a Salesforce object too, you update both copies.
- Coverage, pipeline movement and pipeline creation sit in separate reports rather than one central dashboard.
- Weflow forecasts deal-based revenue only, so consumption revenue needs a different tool.
To be clear, gap-to-goal coverage isn't our invention. Gong Forecast's pacing chart computes coverage against quota still to go and recalculates the pipeline still needed as the period runs down. Avoma divides pipeline by target minus what's already attained.
Outreach's Next Period Coverage tracks next period's pipeline week by week against the coverage the team historically needed. And Clari's comparison against the same day in previous quarters is the view we don't have yet.
The formula is available in plenty of tools, so the real choice is where it lives and whether the targets, per-motion win rates and snapshot history sit on the same page as your forecast.
What Weflow Deal Intelligence & Forecasting costs, and what comes first
Weflow Deal Intelligence & Forecasting is $39 per user per month, billed annually, with a 10-user minimum. It includes Ask Weflow AI Pro and Agent Builder Free, and Pipeline Analytics comes with the Forecasting license.
Coverage is only as complete as the pipeline data under it, which is why we roll out capture first, then Conversation Intelligence, then forecasting.
| Product | Price per user per month | What it adds to the coverage method |
|---|---|---|
| Weflow Activity & Contact Capture | $19 | Activity lands on opportunities automatically, which removes the reason reps hold opportunities back until late |
| Weflow Conversation Intelligence | $39 | Calls are recorded, transcribed and turned into Salesforce data managers can check deals against |
| Weflow Deal Intelligence & Forecasting | $39 | Targets, gap to target, coverage columns, per-motion setups, recomputed win rates, snapshots and the waterfall |
| Weflow Revenue AI Enterprise | $79 | All three products together, including forecasting |
Weflow Revenue AI Foundation ($49) and Weflow Revenue AI Business ($59) don't include forecasting, so the coverage columns and Pipeline Analytics come with Weflow Revenue AI Enterprise or the standalone forecasting product.
FAQ: Pipeline coverage targets
How do I estimate the in-quarter create-and-close share to subtract?
Look at your last four quarters of bookings and measure the share whose opportunity was created and closed in the same quarter. Apply that share to this quarter's target and subtract it from the gap to goal.
Should pipeline coverage use weighted or unweighted pipeline?
Either works, as long as you pick one, stick with it and match it to how you measured the win rate. Mixing the two makes ratios across teams or quarters incomparable.
What pipeline coverage is healthy at week 4 versus week 10?
It depends on your own curve, built from past quarters. Week 4 is your first honest read against the required multiple, and by week 10 coverage should be converging toward 1x.
How far forward should I track pipeline coverage?
Track the current quarter weekly and, from mid-quarter, add the next two quarters, so a shortfall shows up while there's still time to act on it.
Can I build a gap-to-goal coverage report in Salesforce alone?
Yes, for the current state of your pipeline. To see how coverage moved over time, though, you'll need stored snapshots.