How to Run Forecast Pacing in Weflow: AI Projection, Team Forecast and Weighted Forecast Against Target
Learn to read Weflow forecast pacing: AI Projection vs Team vs Weighted Forecast against target.


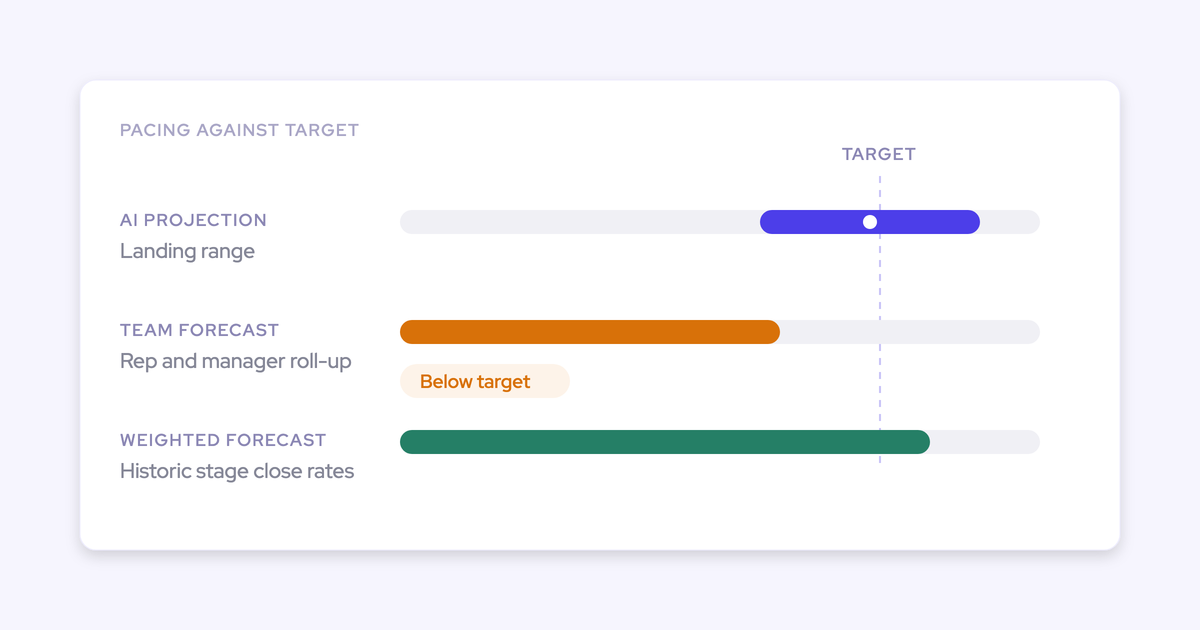

You open the pacing view and see three forecast lines plus Pipeline, Commit and Closed. None of them agree. If you set forecasting up yourself and have never read a pacing chart, your first thought is that something's broken.
Usually nothing is broken. When a pacing view looks way off, the cause is almost always a setup or definition gap, not a bad forecast. Each of the three methods is wrong in a predictable direction, so the disagreement between them is the information. You read pacing in a fixed order:
- Is the setup complete?
- What does each line calculate?
- Where do the three forecasts diverge?
- Which deals explain the gap?
After that, you lock an early-quarter snapshot, and the chart answers the question you actually care about: what did we project, and where did we land?
Weflow is the Revenue AI Orchestration platform for sales, customer success, and RevOps teams. In Weflow Deal Intelligence & Forecasting, the AI Projection, Team Forecast and Weighted Forecast sit together on one pacing chart, so we use our view as the worked example. The reading method itself works anywhere you keep forecast history.
What forecast pacing in Weflow shows you
Forecast pacing plots independent forecasts against how the period is actually moving, so you can see week by week whether the quarter is on track. Weflow's pacing chart shows three forecasts against three reference series. You read it as a corridor, not as one right answer: where the forecasts converge is your credible range, and where they split is your agenda.
Here's what's on the chart:
- AI Projection: where a model built on deal behavior expects you to land, as a range.
- Team Forecast: what your reps and managers submitted.
- Weighted Forecast: what your open pipeline is worth at recent stage win rates.
- Pipeline: open opportunities in the period.
- Commit: deals your team has put in commit.
- Closed: what's already won.
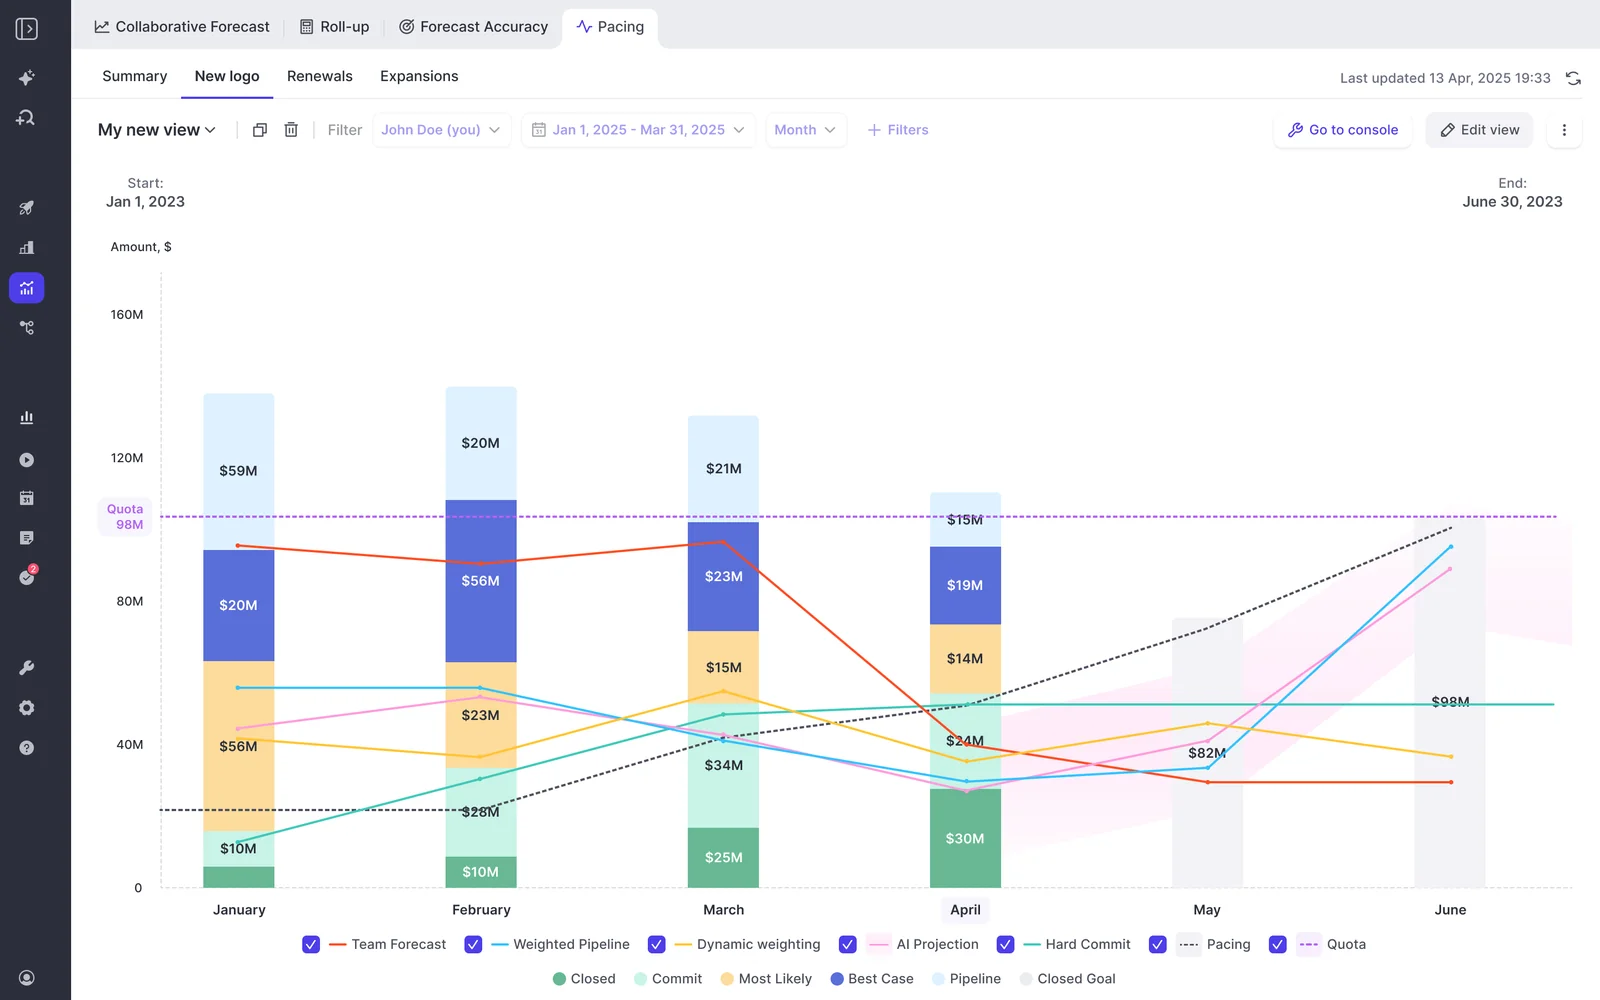
Targets sit on the forecast page beside pacing, in the quota, gap to target and gap to forecast columns. Step 5 covers them. By the end of this guide, you'll have a weekly reading routine and a projected-versus-landed comparison you can show leadership.
Step 1: Check the setup before you trust the chart
Rule out setup artifacts before you interpret a single line. A new or half-finished setup produces charts that look like bad forecasts, and you can fix most of them.
| What you see | Setup cause | What to do |
|---|---|---|
| Pacing and accuracy charts are empty | The forecast configurations don't exist yet, or the import ran before them | Create the configurations first, then run the import. The import reads their field mapping. |
| History on a custom amount field looks flat or wrong | Salesforce field history tracking wasn't on for that field | Accept that history starts from Weflow's snapshots onward. Snapshots build automatically from then on. |
| The AI Projection shows no range | Less than six months of opportunity history, or the model isn't confident | Read the reason it gives. Lean on the Weighted and Team Forecasts until the history builds. |
| Stage conversion and weighting look thin after a CRM move | Stage history wasn't migrated, only first and final status | Treat only the months since go-live as usable history for weighting and projection. |
| The AI Projection hasn't appeared at all | The import finished recently | Give it 48 to 72 hours after the import. |
Run this checklist once, in this order:
- You have the Forecasting module.
- Each forecast configuration exists, with its amount field, date field and filters.
- The opportunity import ran after the configurations were saved. Weflow imports 12 months of Salesforce history by default, and more on request where field history allows.
- Field history tracking covers the custom fields you forecast on.
- You have at least six months of opportunity history for the AI Projection.
- If you migrated CRMs, you know whether stage history came across.
Step 2: Learn what each forecast line actually calculates
The three forecasts read different inputs over different windows, and each one is wrong in a predictable direction. You'll trust the view exactly as far as you can explain each line, so start here.
| Team Forecast | Weighted Forecast | AI Projection | |
|---|---|---|---|
| What it's built from | Baseline and best case calls tied to named deals, submitted by reps and adjusted by managers | Open pipeline multiplied by each stage's recent win rate | More than fifty deal signals: seasonality, rep performance, conversion rates, communication cadence, next meeting booked, methodology health |
| History or window | The current submission, with every earlier version kept | A rolling window, for example the last 90 or 180 days, per rep and team | Up to two years of opportunity history, refreshed nightly |
| What it carries | Judgment from the people closest to the deals | History | Signals nobody has time to read |
| Direction it tends to be wrong | High early in the quarter, low late, and inflated by summing raw amounts | Blind to context on any single deal | No accountability, and thin on reps with little history |
| When to doubt it | A call that never moves all quarter, or sits far above the weighted line | Small deal counts, or motions with very different conversion | New products, motions or territories, and ramping reps |
How the Weflow AI Projection builds its low, middle and high range
The Weflow AI Projection reads deal behavior, not stage. A large deal sitting in a late stage with no next meeting and a falling email cadence gets projected down, whatever stage the rep put it in. It returns a low, middle and high value instead of one number.
Weflow builds a separate model for each forecast configuration, so new logo and renewal each get projected from their own history. When the model isn't confident, it shows no range and tells you why. A blank range is an answer, not a bug.
"The AI prediction is not one number, it is actually a mid, high, and base case, so you have a corridor, because the reality is it is a corridor and a lot of things can happen."
— Janis Zech, Co-founder and CEO, Weflow
Expect the range to widen or disappear when:
- You have less than six months of opportunity history.
- The business is changing: new products, new motions or new territories.
- Stage history is missing after a migration.
- A rep is still ramping. The projection doesn't adjust for ramp yet, so a new hire's deals rest on very little history of their own. The team-level range absorbs this, but read a single new rep's line with care.
Why the Weighted Forecast won't match your Salesforce stage probabilities
Weflow recalculates each stage's win rate from a rolling window of recent history, per rep and per team, instead of using the probability typed on the stage in Salesforce. So a mismatch is expected. Most of the time it means the Salesforce number is stale.
| Salesforce stage probability | Weflow rolling-window weighting | |
|---|---|---|
| Where the rate comes from | Typed once on the stage | Recent conversions, for example the last 90 or 180 days |
| How often it changes | When someone edits it | As your conversion history moves |
| Who it applies to | Every deal at that stage, everywhere | Calculated per rep and per team |
| What a gap tells you | Your typed probability has drifted from how deals convert | How your deals have actually converted lately |
One limit to hold onto: weighting is accurate across many deals and says almost nothing about one. A deal is won or lost in full, so a 20% weight on a single opportunity isn't a prediction about that opportunity. Read the weighted line in aggregate.
Why the Team Forecast usually sits above the weighted line
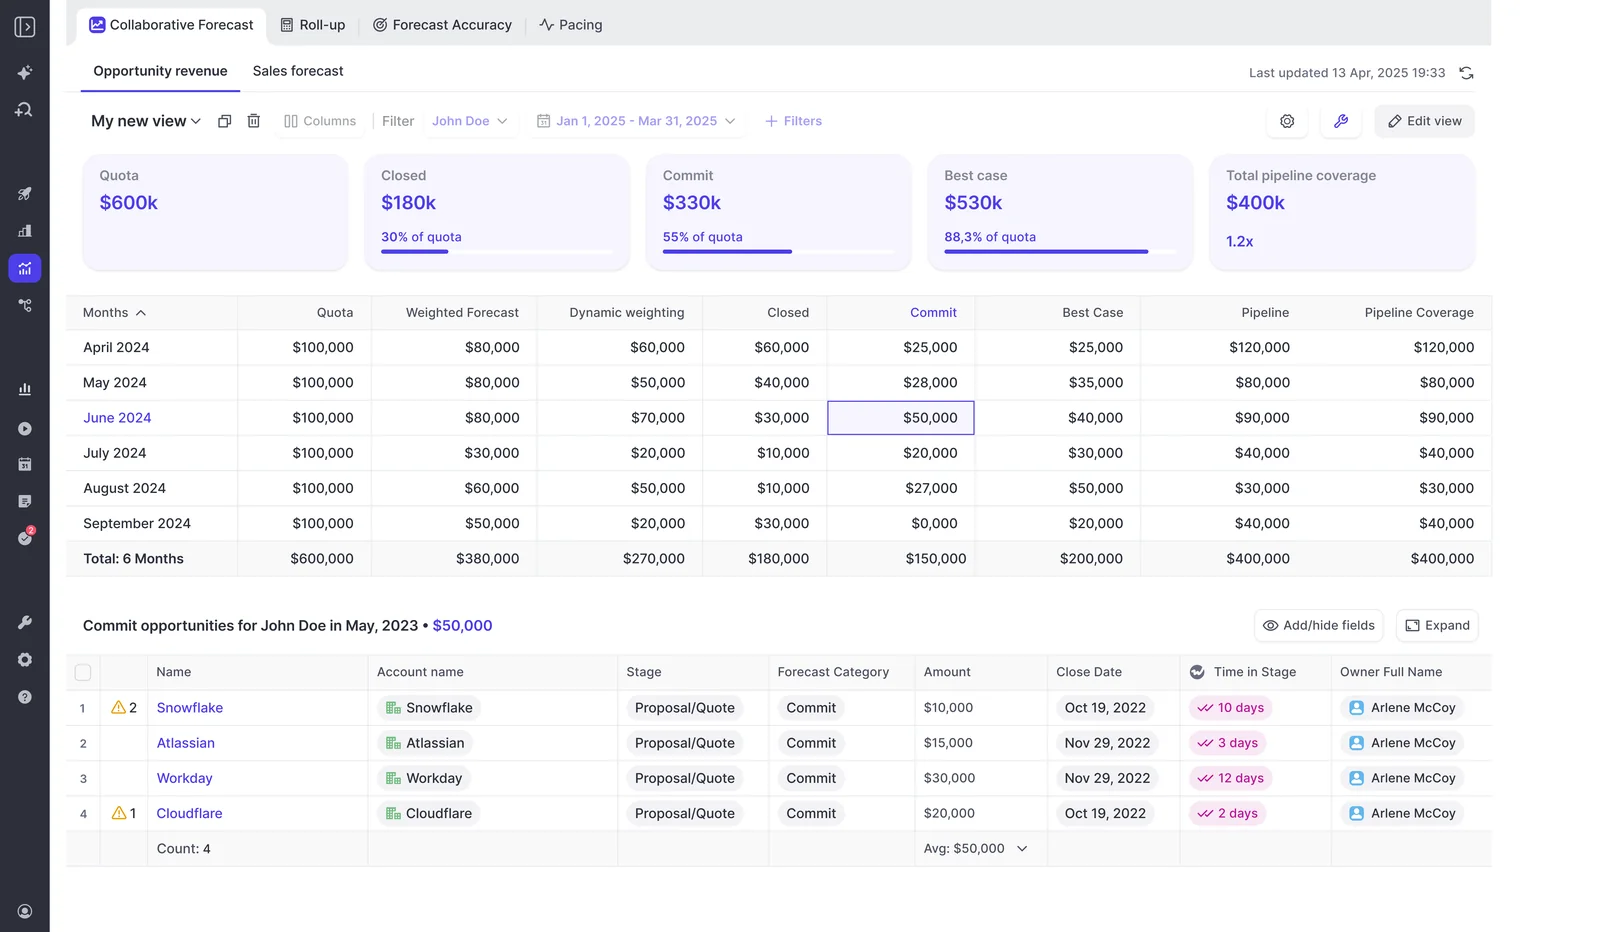
The Team Forecast sums the chosen amount field on the deals your reps select. It doesn't apply probability weighting unless the field you forecast on is itself a weighted value. Five deals at 20% count as five full deals, not one.
Disposition adds to it. Reps tend to be optimistic in month one and pessimistic in month three. So a team line above the weighted line is how the roll-up works, not proof that your team is inflating the number.
If your team thinks in probability terms, you have two options:
- Forecast on a weighted Salesforce field as the foundation, so the roll-up sums weighted values.
- Treat the raw sum as best case and use the baseline call for conviction.
What Pipeline, Commit and Closed add to the pacing chart
Pipeline, Commit and Closed are the ground truth of how the period is moving. You judge the three forecasts by how they track against these through the quarter. Because Weflow snapshots opportunities every few hours, these series carry history, not just today's state.
- Pipeline: shows whether there's enough open value left to support the forecasts.
- Commit: shows how much your team is willing to stand behind, and how that moves week to week.
- Closed: shows how far the period has already landed, which every forecast should converge toward.
Step 3: Find where the three forecasts disagree, and why
Where the three forecasts converge is your credible range. Where they diverge is the agenda for your forecast call. You're not looking for a fourth number. You're looking for the three you have to come together.
Each pattern points to a specific kind of cause:
| Divergence pattern | What it usually means | What to check next |
|---|---|---|
| Team Forecast well above Weighted | Raw-sum roll-up plus early-quarter optimism | The deals selected into the call, and whether stalled deals sit inside it |
| AI Projection below Team Forecast | Large deals in the call are being worked poorly: no next meeting, cadence dropping | The biggest deals in the call and their activity |
| Weighted far below the team on a renewal-heavy pipeline | Renewals sit in early stages but close at much higher rates than new business | Whether renewals and new business share one forecast setup |
| Team Forecast flat all quarter | Nobody is updating the call | The submission versions for that rep or team |
| AI range wide or missing | Thin history or a changing business | The reason shown, then read the Weighted and Team Forecasts together |
Over a couple of quarters, the goal is a narrowing spread. If the gap between the three shrinks, your data and your discipline are both improving.
Step 4: Trace the gap back to specific deals
Weflow's snapshots and named-deal calls mean every movement on the pacing chart drills to the deals that caused it. You stop clicking through the pipeline one record at a time.
Explain a week-over-week commit drop with the pipeline waterfall
Weflow's pipeline waterfall reconciles starting pipeline to ending pipeline through named buckets, and every bucket drills to the actual opportunities. Run it like this:
- Open the Waterfall tab for the period and filter to the team in question.
- Find the bucket that carries the drop.
- Click it to open the opportunities behind it.
- Add the fields you care about, such as close date, stage and owner, and take that list into the forecast call.
The buckets:
- Newly created
- Increased
- Moved into the period
- Moved out of the period
- Decreased
- Lost
- Won
Because the waterfall is built from snapshots, it shows deals pushed out mid-quarter and chronic slippage that a live pipeline report hides. Stage conversion is available by month and by stage, but it isn't drillable the same way yet.
Check the named deals and overrides behind a Team Forecast
Weflow ties every team call to named opportunities, keeps every version, and logs manager overrides with who made them and why. So you can test a submitted number deal by deal. Open these in order:
- The current call, with its baseline, best case and the opportunities selected behind each.
- The version history, to see how the call moved this quarter.
- Any manager overrides, with their timestamp, author and rationale.
- The deals a manager added from reps' pipelines, since a manager's team call can include deals the manager doesn't own.
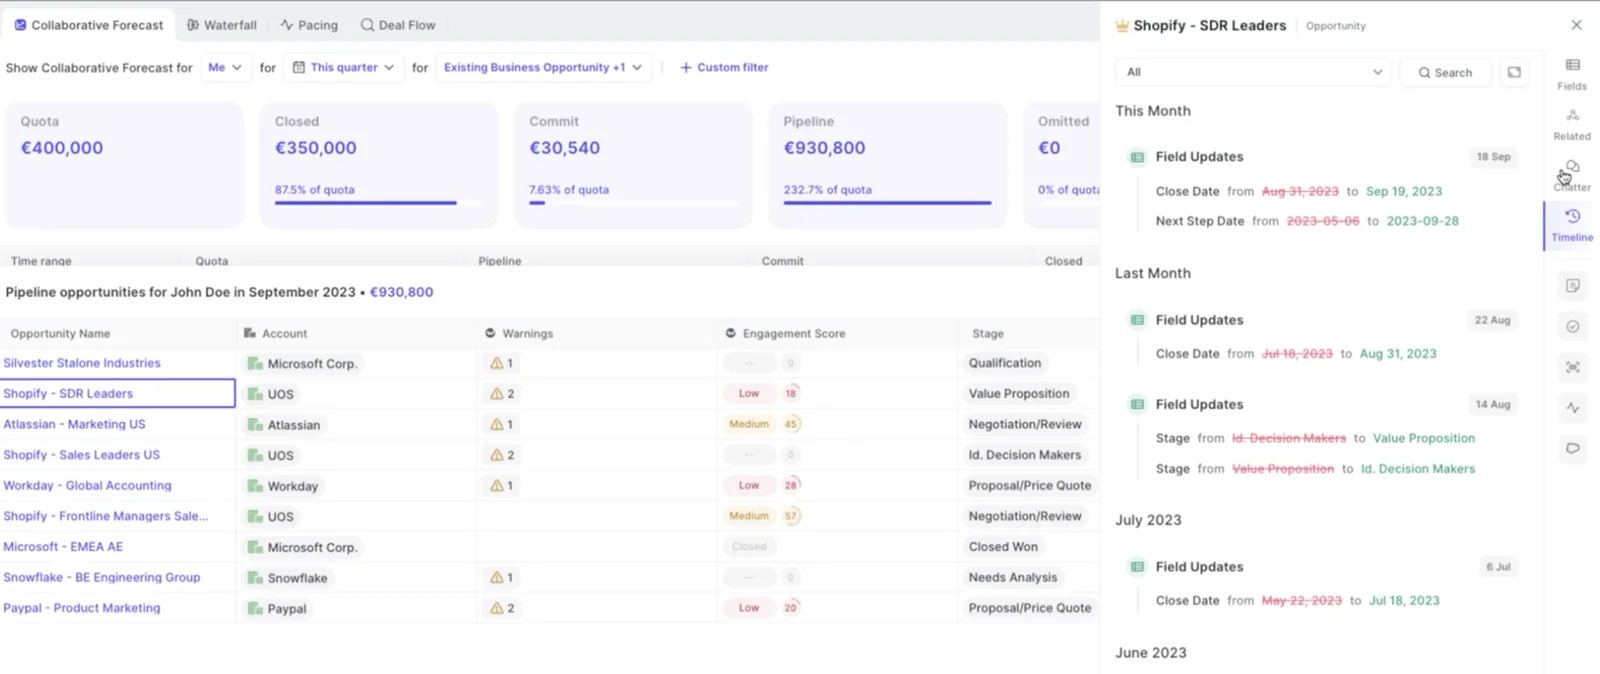
A call that never moves all quarter tells you as much as one that swings. Usually it means the rep isn't revisiting the deals behind it.
Step 5: Compare forecast against target on the Weflow forecast page
You compare forecast against target on the Weflow forecast page, right beside pacing, in the quota, gap to target and gap to forecast columns. You control who sees them, and you can restrict forecast submission and adjustment rights to managers.
Know the target limits going in:
- Targets are amounts. You can't set a target for a number of new logos or deals.
- Monthly is the finest grain. Weekly targets aren't supported.
- You enter targets in Weflow or load them by CSV. Weflow doesn't read them from Salesforce.

Why targets don't show up on the forecast page
A target set outside the active forecast period won't surface. That's the usual reason quotas look missing. To fix it:
- Make sure the target's period overlaps the period you're viewing.
- Make sure the target is attached to the forecast configuration you have open.
An annual quota set per Salesforce user breaks down into quarters and months automatically, and you can still edit each period by hand for seasonality.
Why the manager target doesn't equal the sum of rep quotas
Manager targets are often deliberately different from the sum of rep quotas, and Weflow lets you set a manager target on its own instead of summing it. Most of our customers do exactly that. A manager can carry an individual target and a team target at the same time.
Take three first-line managers carrying a million each under a senior leader carrying two and a half. The half million of difference is the buffer for attrition, ramp and a bad patch. Where rep quotas don't add up to the team target, Weflow carries the remainder on the manager, so the gap to target stays visible instead of hidden.
Step 6: Lock week 4 to compare projected and landed
Locking a submission in week 3 or 4 of the quarter is what turns pacing into a prediction you can score. A forecast given in the final days is a report of what already happened. Week 4 is early enough that the number is still a judgment.
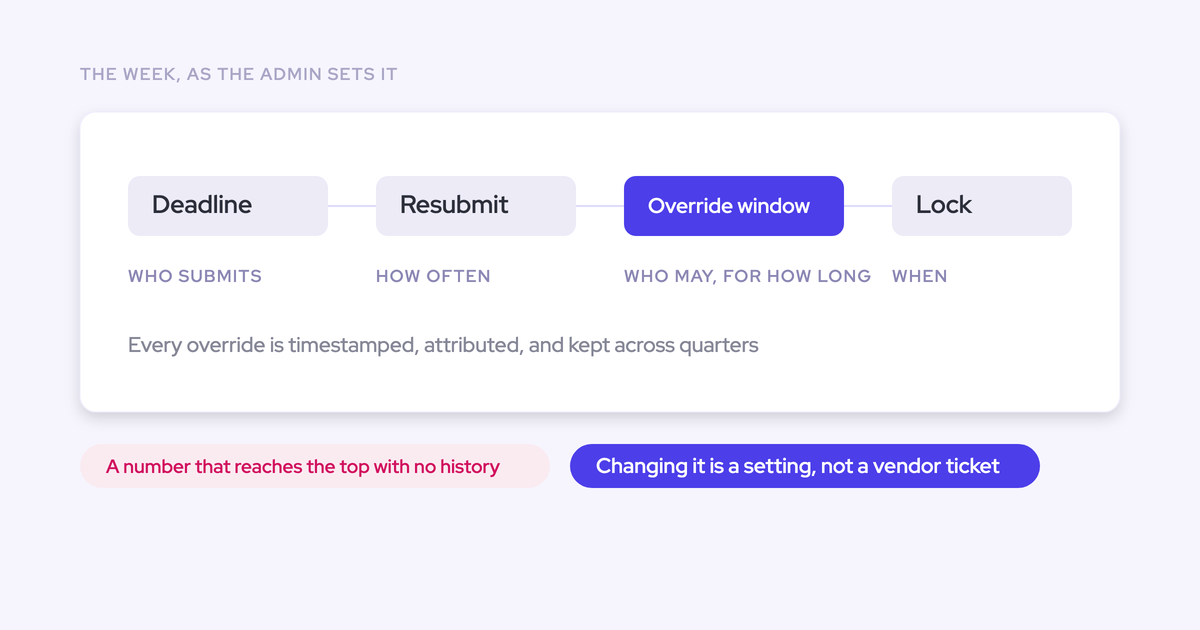
Weflow lets you configure the whole cadence: submission deadlines, how often reps resubmit, who can submit, who can override, how long an override stays open, and when the forecast locks. Set it up like this:
- In the forecast cadence, set the lock to fall at the end of week 3 or week 4.
- Let reps submit and managers review before the lock.
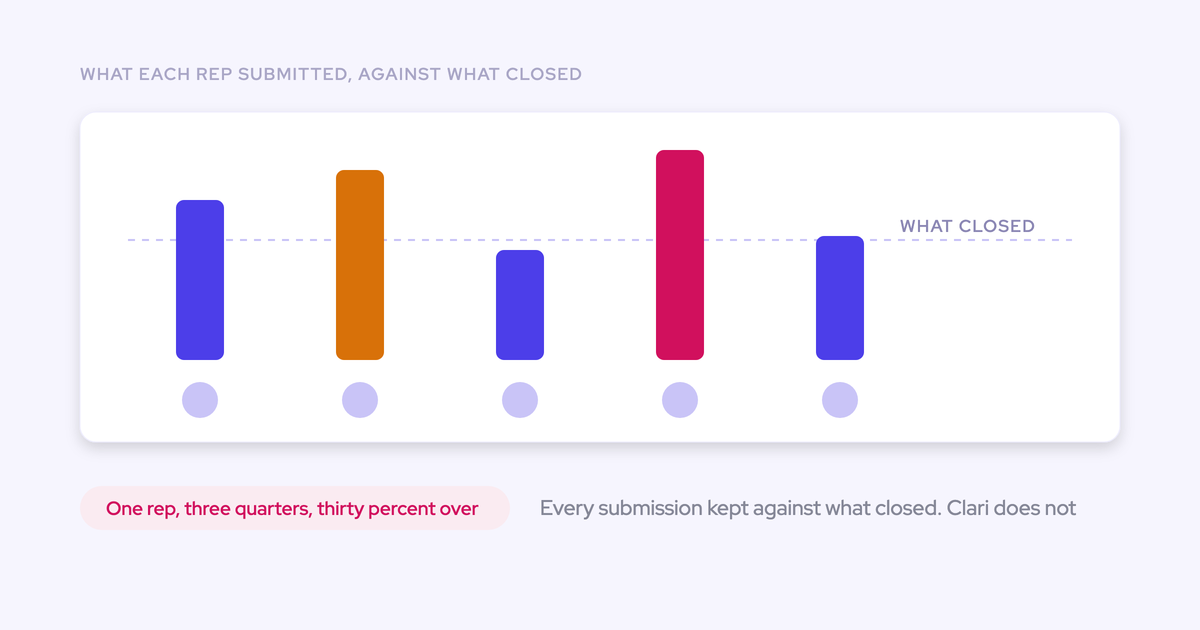
- At period end, open the Forecast Accuracy tab and read accuracy per rep, manager and team against the field your admin chose, for example Closed Won.
Accuracy tracking is on for every Weflow Forecasting customer with no switch to flip. Manager and team averages sit on their own rows, so you can read a manager's own call against the team's.
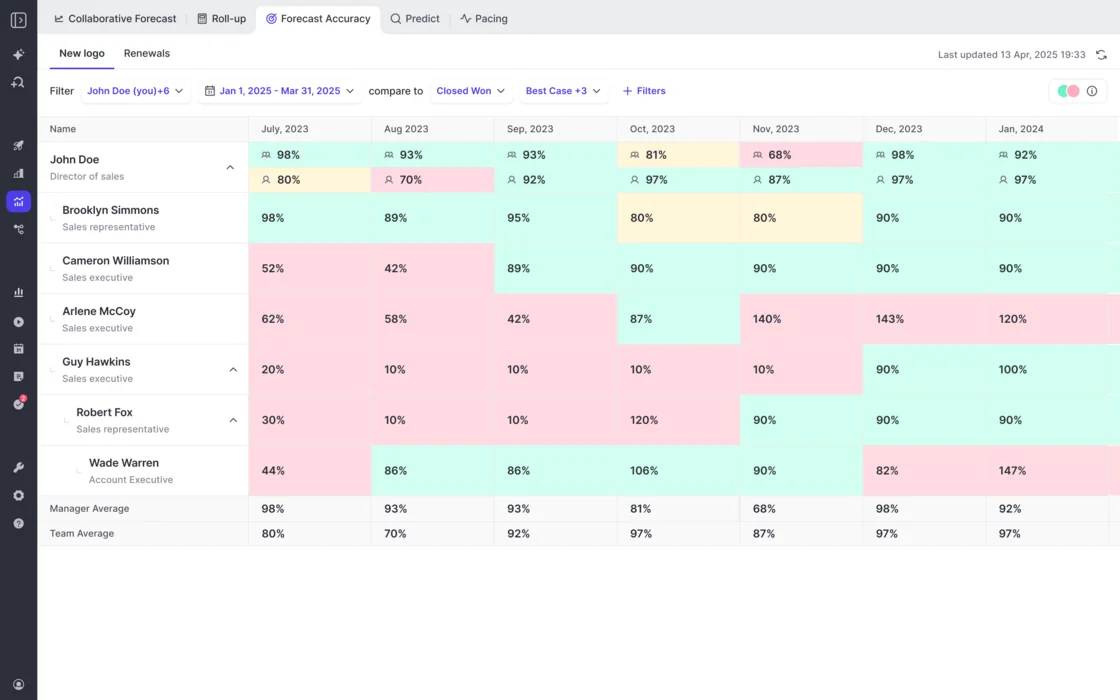
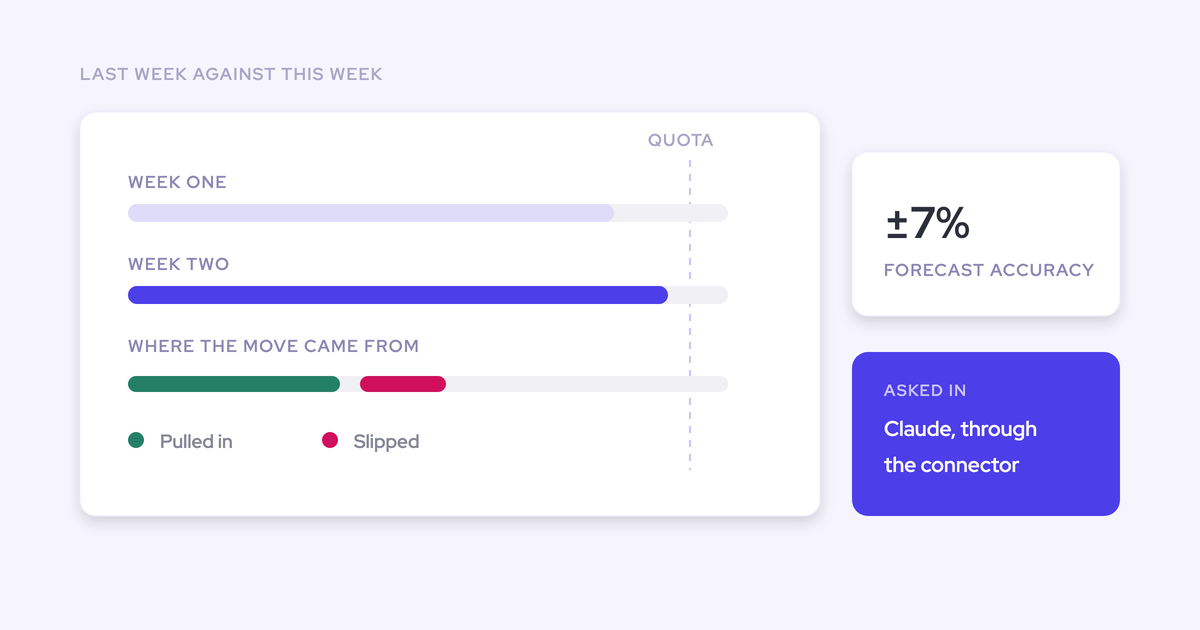
"With Weflow, we forecast within 7% by week 4 of the quarter."
— Tibor Stefán, Chief Revenue Officer, Zeotap
Measuring accuracy across consecutive quarters, and coaching on it, is its own exercise. The week-4 lock is the starting point for it.
Reading mistakes that make a sound forecast look broken
Once pacing is running, most distrust comes from reading the view the wrong way, not from the view being wrong. These are the mistakes we see most:
- Picking one line as the answer. Read the three as a corridor and work the gaps between them.
- Haircutting the number instead of cleaning the pipeline. A downward adjustment leaves stalled deals in place, so the same miss repeats next quarter. Work those deals or close them lost, and keep them out of the roll-up.
- Judging the AI Projection on a ramping rep. Their history is thin. Judge the projection at team level.
- Reading the weighted line on a single deal. It's an average across many opportunities. Use the AI Projection and the deal itself for single-deal questions.
- Treating a blank AI range as a bug. It's the model declining to guess. Read the reason it gives.
- Scoring accuracy on the last call of the quarter. Score the locked week-3 or week-4 call.
- Expecting the forecast inside Salesforce. Submissions, targets and roll-up data live in Weflow. The Weighted Forecast and AI Projection run off your CRM data, but submitted calls don't land on a Salesforce field.
Can you run forecast pacing in Salesforce or Excel instead?
Pacing needs stored history, and that's where both alternatives run short. Salesforce shows pipeline as it is now and doesn't history-track calculated or roll-up fields. An Excel rebuild has no snapshot to compare against unless you saved one yourself.
| Excel rebuild | Salesforce native forecasting | Weflow pacing | |
|---|---|---|---|
| Stored history | Only the exports you saved and kept | Pipeline as it stands now, with no history on calculated or roll-up fields | Opportunity snapshots every few hours, plus 12 months imported at setup |
| Three forecasts together | Each built by hand | Weighting on fixed stage probabilities | AI Projection, Team Forecast and rolling-window Weighted Forecast on one chart |
| Explaining week-over-week change | Diff two exports by hand | Ask reps which deals slipped | Drillable pipeline waterfall |
| Projected vs landed | Only if you kept the week-4 file | No record of what the forecast said at a point in time | Locked submissions scored per rep, manager and team |
| Targets | Anywhere you like | Native quota fields, which stop fitting once you forecast on custom revenue fields | Entered in Weflow or by CSV, amounts only, monthly at finest |
| Real limits | Rebuilt every cycle and a week old by the time you act | No waterfall, and quota tracking happens somewhere else | Roll-up isn't probability-weighted, submissions aren't written to Salesforce, no consumption forecasting |
| Who it suits | A go-to-market org still changing shape | A quarter that rests on about ten material deals | Salesforce teams with many reps, managers and roll-up layers |
If your quarter rests on about ten material deals, native Salesforce forecasting and pipeline inspection can carry it. With ten deals, the forecast is a deal-by-deal judgment and there's nothing to reconcile. The case for a pacing tool grows with the number of deals, managers and roll-up layers, not with how much the number matters.
If you want to see how the three lines read on a live view before you decide, walk through the product yourself, no call required.
FAQ: forecast pacing in Weflow
Can I pace new business, renewal and expansion separately in Weflow?
Yes. Weflow runs several forecast setups in parallel, each with its own amount field, date field, stages, cadence, targets and forecast calls. Roll-up shows a tab per deal type plus a combined view, so you can carry one combined quota and separate targets per motion at the same time.
Does the Weflow forecast write back to Salesforce for BI and the warehouse?
No. Submitted forecasts, targets and roll-up data live in Weflow and don't land on any Salesforce field. Everything else Weflow captures does write back, and the Weighted Forecast and AI Projection run off your CRM data. Today, you reach submitted forecast calls through the MCP connector, and API access is planned.
Can an AI assistant read Weflow forecast data over MCP?
Yes. Weflow's read-only MCP connector returns the most recent submitted call for a period next to the live pipeline total and the delta between them, plus per-rep pipeline metrics and the opportunity IDs behind them. It returns null when nothing was submitted, and per-rep breakdowns cap at 25 owners. Team scope follows your reporting hierarchy, and with no hierarchy configured it resolves to every active user in the company.
Can Weflow read targets from Salesforce or a custom target object?
No. You enter targets in Weflow, or our team loads a CSV for you so a large team doesn't have to be keyed in by hand. If your BI also reads targets from a Salesforce object, you keep two copies and update both when a target changes.
Does my existing Salesforce forecast configuration carry over to Weflow?
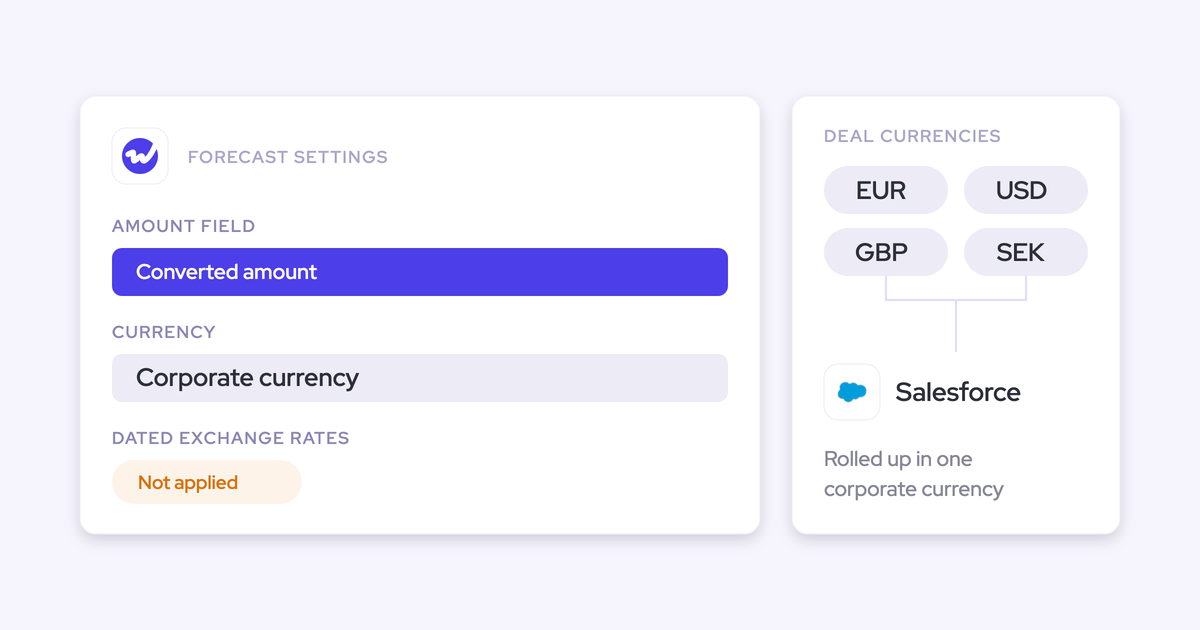
No. You set forecasting up in Weflow, independently of Salesforce forecasting. You can forecast on any standard, custom or formula field, with multi-currency support.
Does Weflow support consumption-based forecasting?
No. Weflow's forecasting models deal-based revenue: stage weighting, rep roll-up and the AI Projection. Usage-based revenue needs a different method, and we don't support it.
How long does Weflow forecasting setup take, and can a trial prove it?
Forecasting takes longer than activity capture or conversation intelligence, which can roll out in about two weeks, because it encodes an operating cadence: who submits, how often, at deal or manager level, and against which quota. The AI Projection is ready 48 to 72 hours after the import. A two-week trial rarely proves forecasting, because a roll-up has to run for a cycle before anyone can judge it. For that, we offer a three-month paid pilot that's contractually the first three months of a multi-year agreement, with an opt-out at the end.
Which Weflow plan includes forecast pacing, and what does it cost?
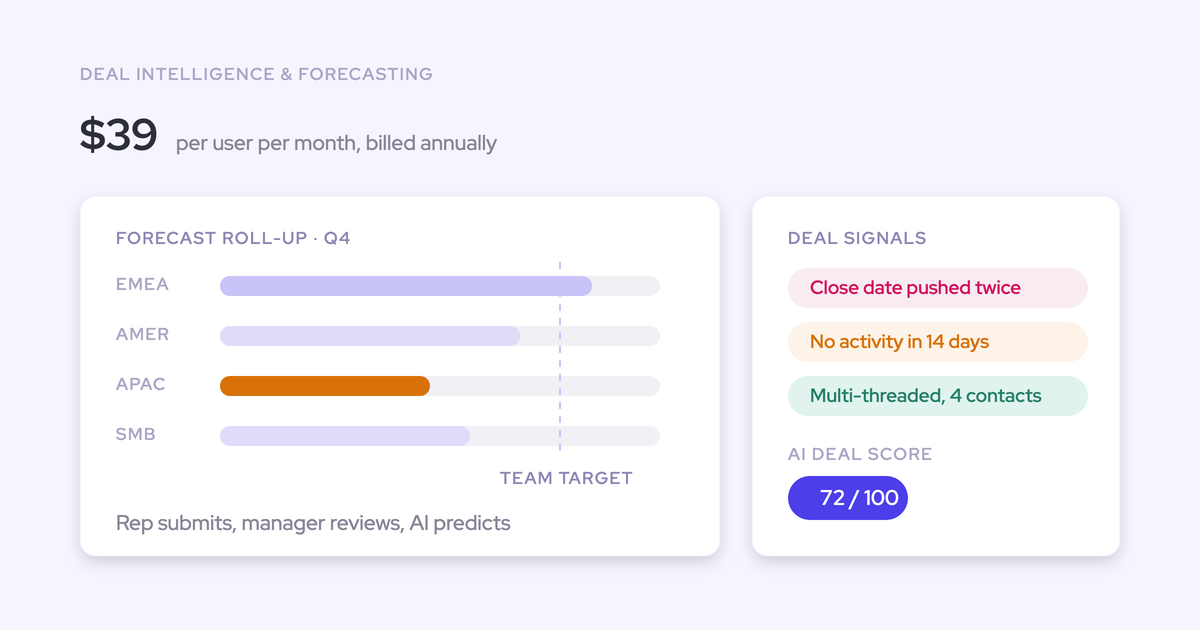
Pacing comes with Weflow Deal Intelligence & Forecasting at $39 per user per month standalone, or with Weflow Revenue AI Enterprise at $79 per user per month, which includes the full forecasting layer. Weflow Revenue AI Business at $59 includes Deal Intelligence but excludes pipeline analytics and forecasting, and Pipeline Analytics is sold only with Forecasting. All plans bill annually with a 10-user minimum and include Ask Weflow AI Pro and Agent Builder Free.