Weighted vs Roll-up vs AI forecast: Why Your Numbers Disagree and What To Do About It
Learn why weighted, roll-up, and AI forecasts disagree and how to improve forecast accuracy.


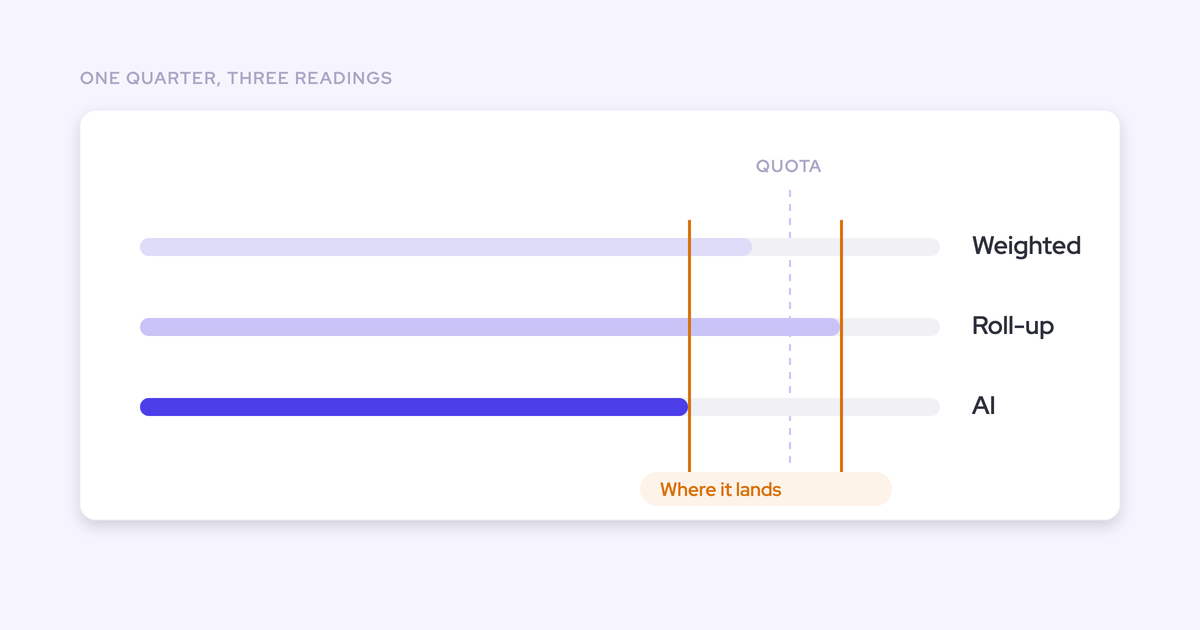

Three numbers, one quarter, and no rule for which one wins. The team commits 300, the weighted pipeline says 700, the deal-by-deal forecast says 400. Reconciling them by hand every Monday is the job, not the anomaly.
One prospect told us:
"They give me a forecast at the beginning of the quarter of what they think they're going to close. What I'm trying to do is get all three to match what they've told me. Maybe they say they're going to close 300. My weighted forecast is saying 700. The deal forecast is saying 400. I want to get them to converge."
Here's the position we'd argue for: don't pick a winner and don't average them. Each method is wrong in a predictable direction, so where the three converge is your credible range, and where they diverge is the exact deal, rep, or data gap to interrogate.
Convergence isn't something a smarter model hands you either. It's what a working cadence produces over a couple of quarters, which is why we built the three-method view into Deal Intelligence & Forecasting rather than shipping a fourth number.
Why your weighted, roll-up, and AI forecasts disagree
They disagree because they read different inputs. The roll-up reads people, the weighted forecast reads stage history, the AI projection reads deal behavior. Three different questions produce three different answers, and the spread between them is structural rather than a bug in anyone's math.
| Method | What it reads | Predictable bias |
| Roll-up | The judgment of the people closest to the deals | Optimistic in month one, conservative in month three |
| Weighted | Historic stage conversion applied to current pipeline | Inherits every flaw in stage discipline, usually the outlier |
| AI projection | Deal-level behavior: activity, threading, velocity, methodology health | No accountability attached, and only as good as the captured data |
The roll-up carries judgment, and rep incentives
The roll-up is the only number produced by people who have actually spoken to the buyer. That's its value and its problem.
A rep gives an account of a deal, the manager adjusts for what they know about that rep, and the number that comes out is a blend of two opinions with nothing in the room to check either of them.
Everybody already knows who sandbags and who runs hot. Correcting for it by hand is the work, which is why the same set of deals produces a different number depending on who runs the call.
The weighted forecast carries history without context
The weighted forecast is the least trusted of the three because it compounds whatever is wrong with your stage data.
Nothing in Salesforce stops a rep dragging a deal from the first stage straight to closed won. With no enforced entry and exit criteria, stages get skipped routinely, so the stage history is thin: a couple of hundred opportunities can yield twenty-odd with usable tracking data.
Then you apply conversion rates derived from that history to today's pipeline and call it a forecast.
"We have very clearly defined exit criteria which I don't think are being adhered to because it's just a manual. Someone in there says yes, I'm going to move this from proposal to negotiate. I'm like well did we really meet the exit criteria?"
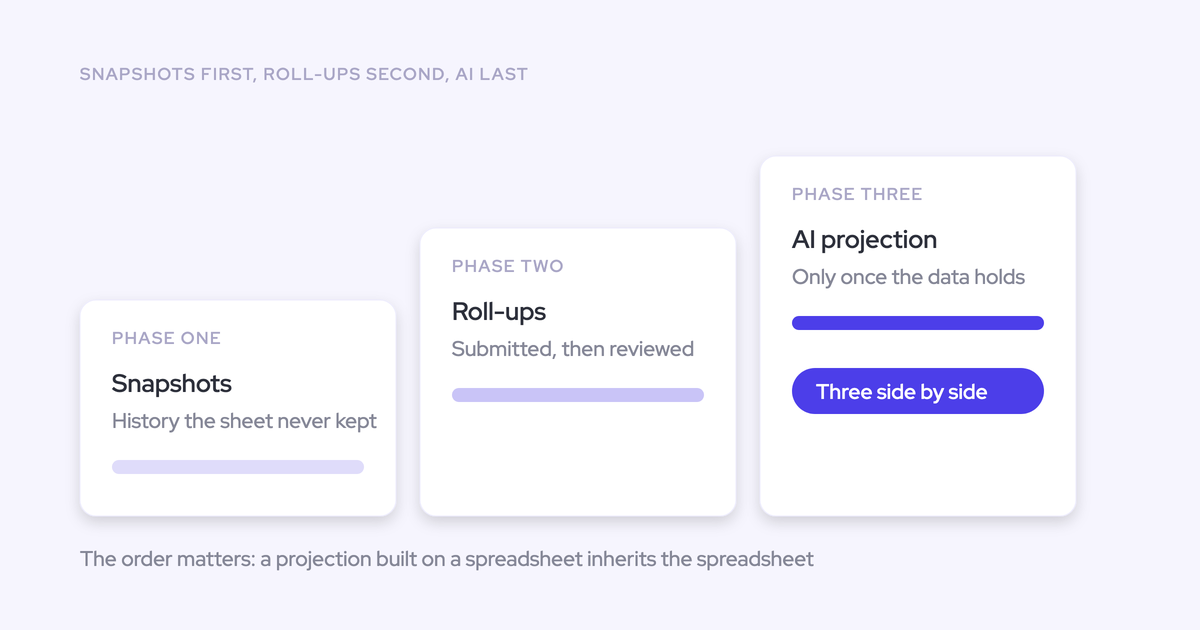
The mechanism that fixes it isn't a better weighting scheme. It's making the stage change happen because criteria were met on a recorded conversation, not because someone remembered to drag a card. Automate that and the same arithmetic starts describing the pipeline instead of describing rep behavior.
The AI projection carries signals nobody has time to read
A good AI projection is the only one of the three that reads what's happening inside the deals at a scale a human can't: response patterns, threading, velocity in the last thirty days, whether a next meeting is on the calendar.
Two honest limits sit next to that.
First, it owes nothing to anyone. No AI model gets a quarterly review, so a projection that's confidently wrong costs the model nothing and costs you a board conversation.
Second, it's downstream of your data. We shipped a prediction forecast at Weflow before we had automated Salesforce capture underneath it, and it wasn't accurate. That's how we learned the problem has to be solved end to end.
"The best AI models are based on the data foundation. If you do not automate good data quality on an opportunity by opportunity basis, it will be very hard to have accurate prediction models."
— Janis Zech, Co-founder and CEO, Weflow
Clari's opportunity score is the cautionary version of this. It's computed from the customer's own historical performance, so a team with weak stage discipline gets a confident number built on that weakness. Once a score has been wrong in front of a manager, nobody in that room ever looks at it again.
Pick one, average them, or read the corridor
You have three realistic ways to handle the disagreement. Two of them destroy the information the disagreement carries.
Picking one method and haircutting it by gut
This is what most teams do, and it's defensible in exactly one situation: a small deal count, no stored forecast history, and one person who genuinely has the best read on every deal in the pipe.
Everywhere else it stacks two instincts on top of each other and calls the result a board number. The rep's optimism gets trimmed by the leader's feel, and neither adjustment is written down anywhere it can be checked next quarter.
The tell that you've outgrown it: a leader looks at the model number, agrees it looks about right, and adjusts it anyway.
Averaging the three into a blended number
Averaging looks rigorous and isn't. It produces a fourth number that no rep submitted, no model generated, and no one owns.
Worse, it deletes the only useful output of running three methods. A 300 and a 700 average to 500, and 500 tells you nothing about which deals are inflated or whose stage data is fiction. You've smoothed away the diagnostic to get a rounder answer.
Reading all three as a landing corridor
Run them in parallel and read the spread. Because each method's bias is predictable, the gaps between them point at specific causes.
Where the three converge is the range you can defend upstairs. Where they diverge is the agenda for Monday's call.
"What I am a big fan of is combining three main metrics to keep it simple: a dynamically weighted forecast that looks at your last six and twelve months of stage conversion rates, a bottom up roll up forecast, and an AI prediction based on the data foundation. The AI prediction is not one number, it is actually a mid, high, and base case, so you have a corridor, because the reality is it is a corridor and a lot of things can happen."
— Janis Zech, Co-founder and CEO, Weflow
Two things have to be true before this works. You need stored history, so a submission can be compared to what closed.
And you need a submission cadence that repeats on a fixed rhythm, so this week's spread is comparable to last week's. Without both, you're not reading a corridor, you're comparing three guesses taken on different days.
How to read the gaps between your three forecasts
Each pairwise gap has a specific meaning and a specific next action. This is the part worth sharing with your managers.
Where all three converge: your credible range
When the roll-up, the weighted number, and the projection land inside a tight band, that band is your forecast. Take the width of the band upstairs with it.
Convergence is also evidence about your process, not just about the quarter. It means stage data, captured activity, and rep judgment are describing the same pipeline.
For calibration: the strongest revenue teams we see land around 95% forecast accuracy. The average sits closer to 85%. That ten-point gap doesn't close with a better model, it closes with a cadence repeated often enough to be judged.
Roll-up far above the AI projection: deals nobody is working
When the team's submitted number sits well above the projection, the gap is almost always specific deals whose behavior doesn't support their value.
Large amount, real logo, and no activity in three weeks. One contact on the deal. No next meeting booked. Close date pushed twice already.
This is the diagnostic that only deal-level scoring gives you, because an aggregate projection tells you the total is too high and never tells you which rows caused it. Forecasts miss because unhealthy deals carry real dollar value into the number, not because the arithmetic went wrong. Pull those deals into the review before the call and the gap resolves itself, one way or the other.
Weighted forecast far from both: your stage data is broken
A weighted number wildly off the other two is a data alarm, not a modeling artifact.
It means stages are being skipped, backdated, or moved without criteria, and the conversion rates you derived from that history don't describe your business. Everything downstream inherits it: time in stage, cycle length, win rate by stage, coverage targets.
Don't reweight. Go fix the entry and exit criteria, then re-derive the rates from a period where they were enforced.
A rep's number that never moves: sandbagging on the record
Some gaps are about the forecaster rather than the forecast. A submission that sits far from the corridor every week, or one that never moves at all from week one to week twelve, is telling you something about how that person calls deals.
That only becomes coachable if submissions are versioned and a manager override sits next to the rep's original rather than replacing it. Collapse the chain into one editable figure and after a missed quarter nobody can say whose judgment was wrong.
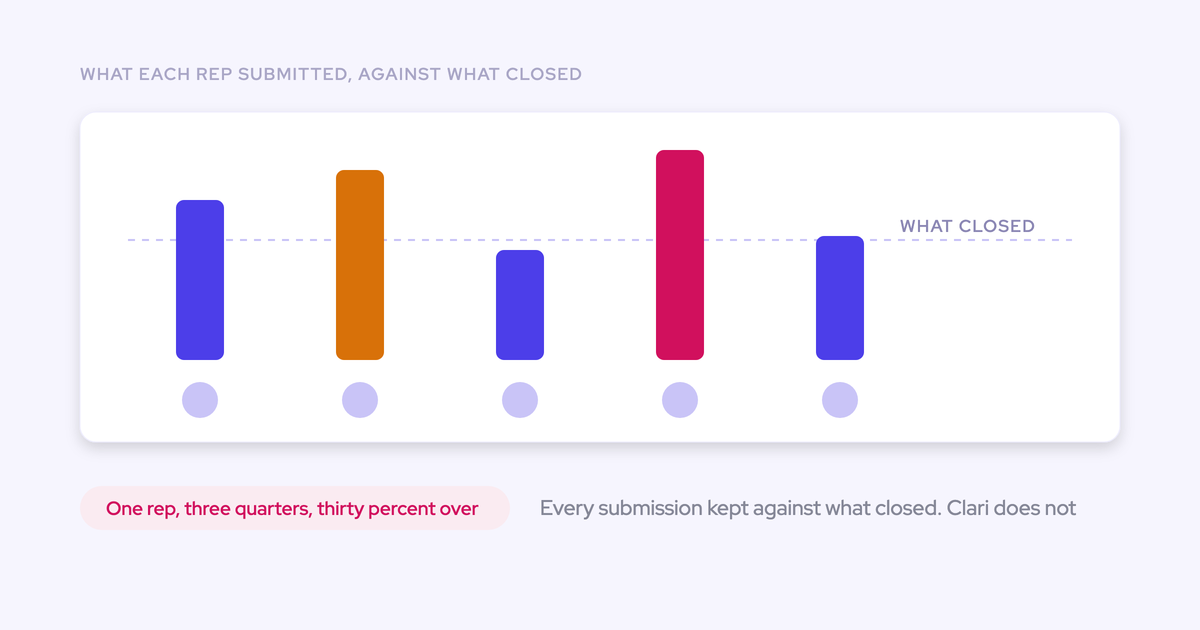
Which is how a rep misses by 30% three quarters running and it never surfaces anywhere a manager could act on it.
| What you see | What it usually means | What to interrogate |
| All three inside a tight band | Credible range, and the discipline underneath is working | Nothing. Report the band, note its width |
| Roll-up well above the AI projection | Committed deals aren't being worked | Named deals: activity, threading, next meeting, push count |
| Weighted far from both | Stage history is unreliable | Stage entry and exit criteria, skipped stages, backdating |
| One rep's number never moves | Habitual sandbagging or habitual optimism | That rep's submission history against what closed |
What to do when the forecasts stay apart all quarter
Persistent divergence means the inputs are broken, not the method. A corridor that never narrows is a data and cadence problem wearing a forecasting costume. Work it in this order:
- Fix the snapshot timing first. Lock the forecast in week three or four of the quarter. A commit given in the last two weeks is a report, not a prediction, and it can't be scored against anything meaningful.
- Store every submission against the closed number. Per rep, per manager, per segment, across consecutive quarters. Until you do this you don't have a bad accuracy number, you have no baseline at all.
- Write the stage entry and exit criteria down, then enforce them. The weighted forecast can't converge on anything while stages move on rep memory.
- Complete the capture layer. If activity, contacts, and conversation content aren't landing on the opportunity automatically, the projection is scoring an empty record and the deal review is still hearsay.
- Judge it on the spread narrowing over two quarters, not on this Monday. Separate forecast accuracy from commit accuracy while you're at it. Measuring only what a rep committed produces a flattering number and answers a narrower question.
"we wouldn't punish publicly the people who got it wrong. There's multiple reasons for that, right? But we would celebrate the teams and people who got it right."
— Robert Gimbel, GTM Advisor and former CRO at Camunda
Why Clari and spreadsheets can't show you the corridor
Most readers of this article already own a forecasting tool and are still doing the comparison by hand. That's not a discipline failure, it's a tooling one.
Clari's roll-up is genuinely strong and flexible, and the pacing view, the waterfall, and the same-day-last-quarter comparison are the three things teams actually open. Credit where it's due: seeing and editing the whole forecast inline is a real capability.
The corridor is where it stops. Clari doesn't measure forecast accuracy, so submitted-versus-closed never becomes a track record. It can't calculate a field, so any derived metric, including the delta between what a rep committed and what their manager submitted, has to be built as a formula field in Salesforce first. It can't compare two date fields relative to each other, so views that depend on one date falling after another get hard-coded by quarter and quietly break when the calendar moves.
And its multi-level forecast shows what each direct report submitted, not what the reps beneath them said, so the place in the hierarchy where the number changed stays invisible.
Spreadsheet teams have a simpler problem: no stored history, so there's nothing to compare against. Salesforce doesn't snapshot the pipeline, field history has to be enabled in advance, and calculated or roll-up fields can't be history-tracked at all, which is usually the exact custom ARR field you forecast on.
| What the corridor needs | Clari | Spreadsheet |
| Three methods in one view | Roll-up is strong; deal health is weak | Manager forecast only, no rep submissions |
| Submitted vs closed, stored | Not measured | No snapshot retained |
| A derived gap between two numbers | Must be built in Salesforce first | Possible, and rebuilt by hand every cycle |
| Visibility into where the number changed | Adjacent level only | None |
How Weflow runs all three forecast methods in one view
Weflow is the Revenue AI Orchestration platform for sales, customer success, and RevOps teams, and on the forecasting side the corridor is the product rather than a report you assemble.
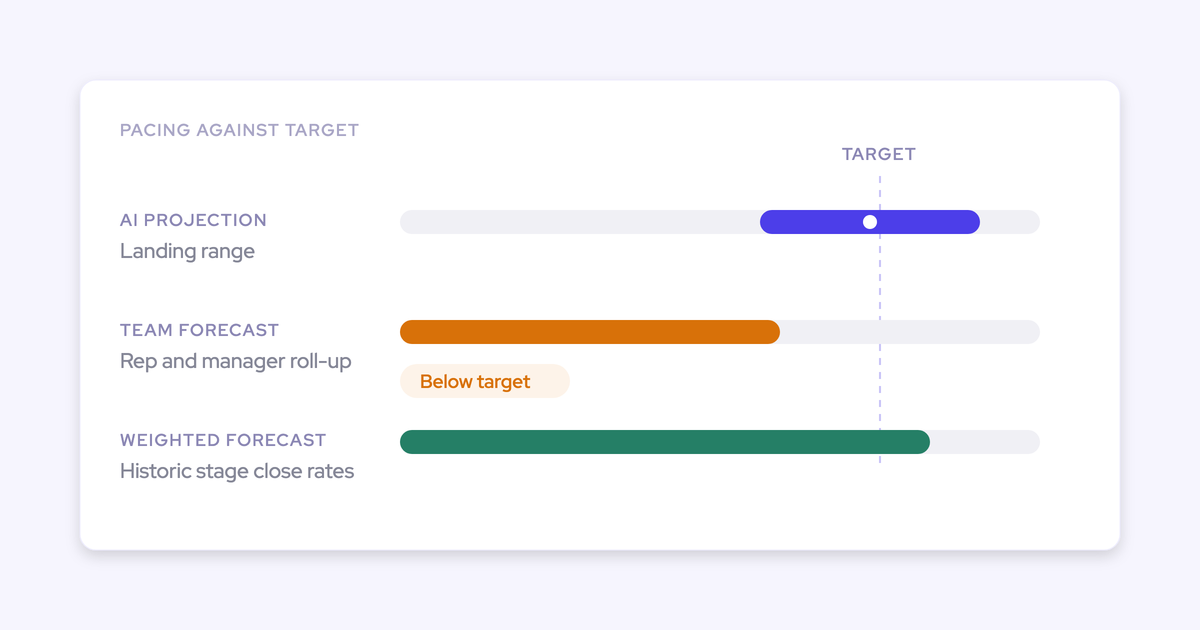
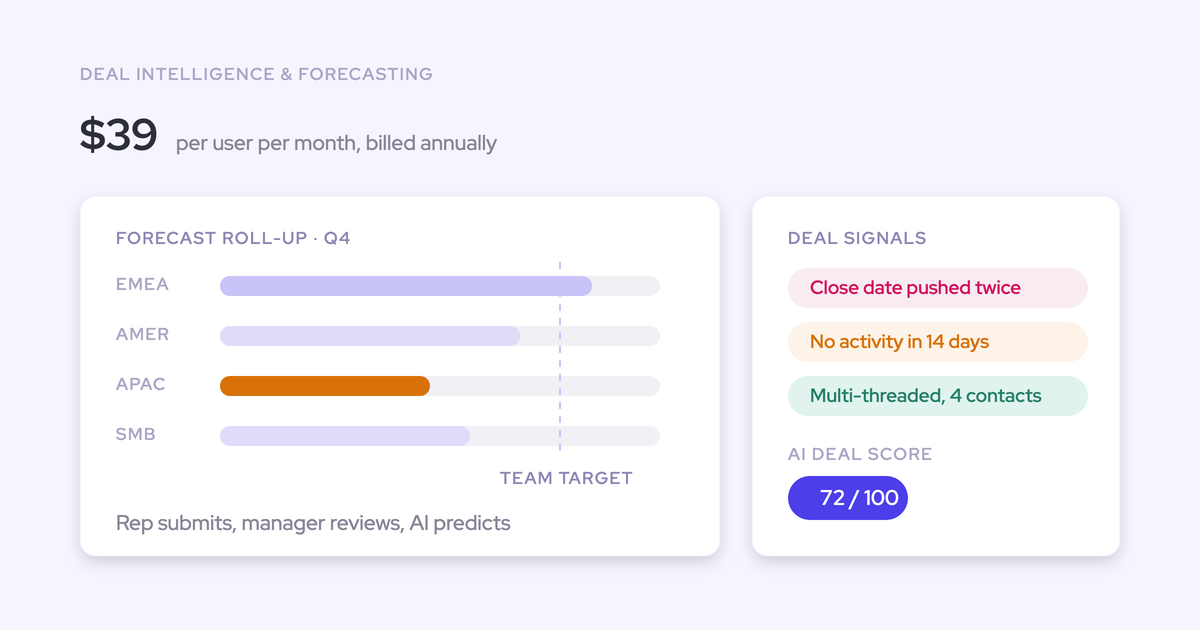
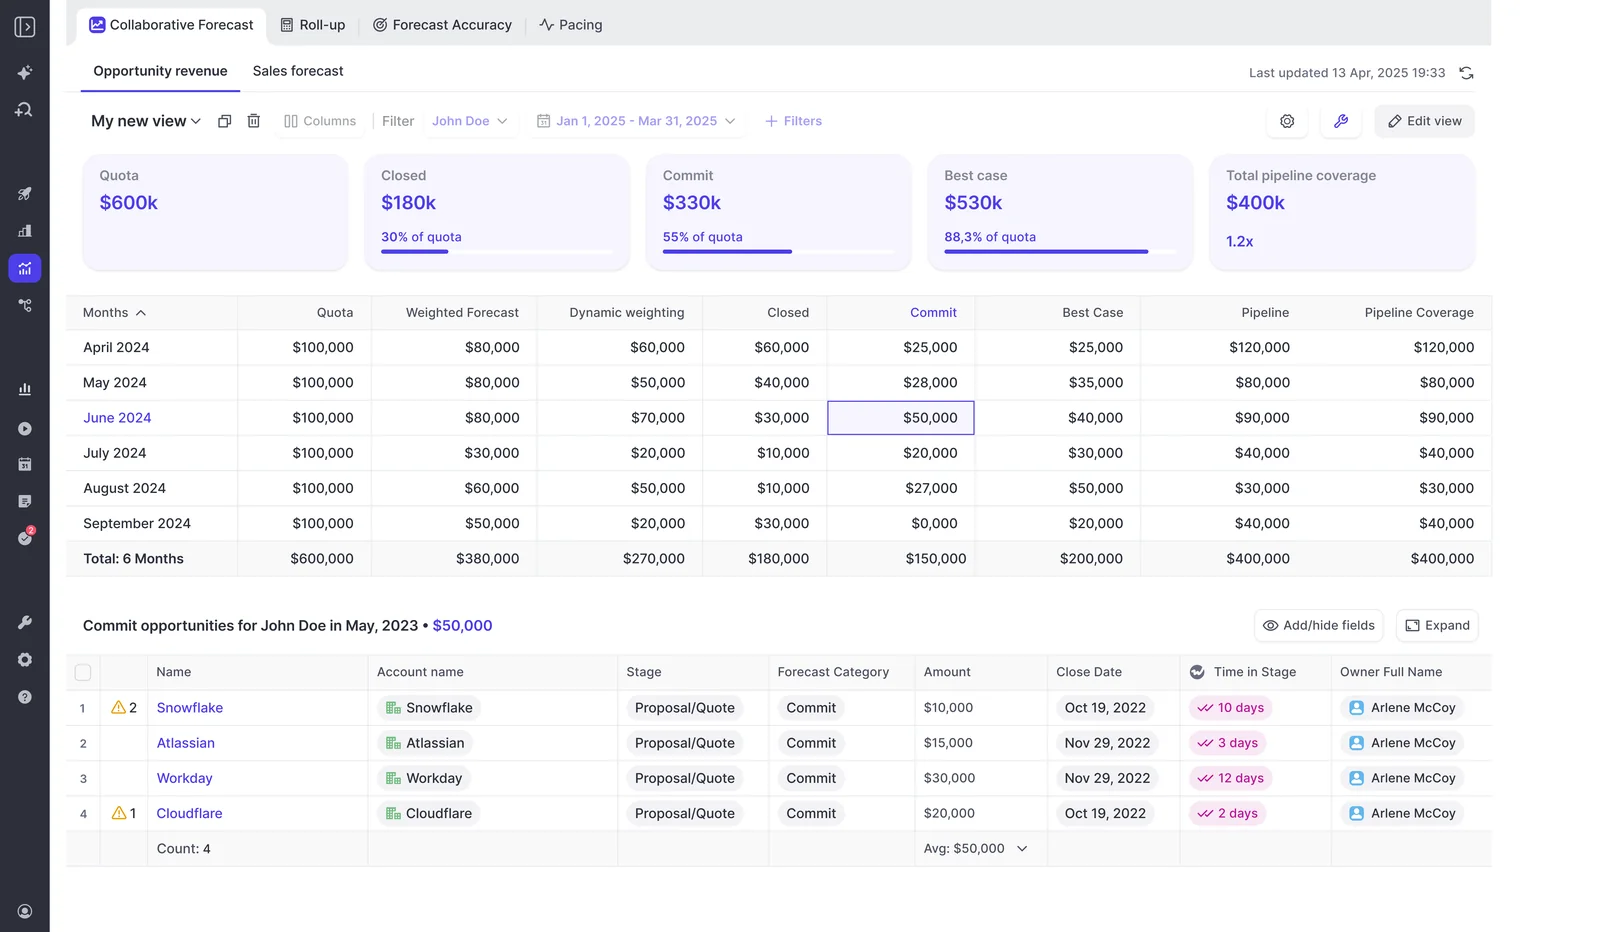
The pacing view puts AI Projection, Team Forecast, and Weighted Forecast side by side against Pipeline, Commit, and Closed. Same period, same amount field, same refresh. You're reading gaps instead of stitching three sources together on a Monday morning.
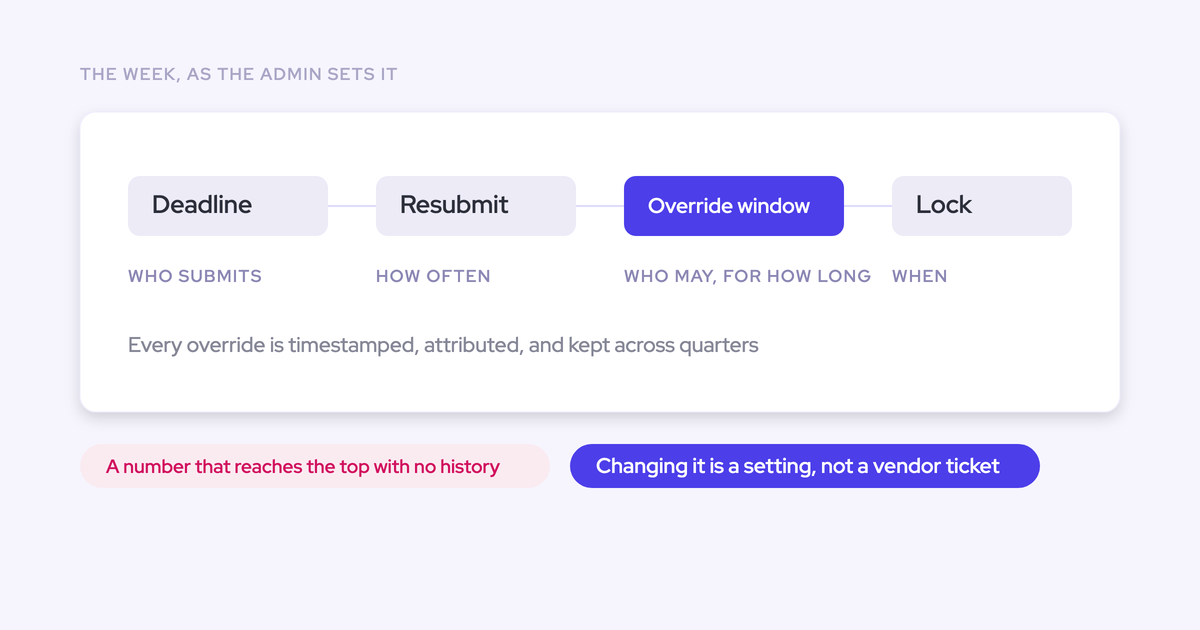
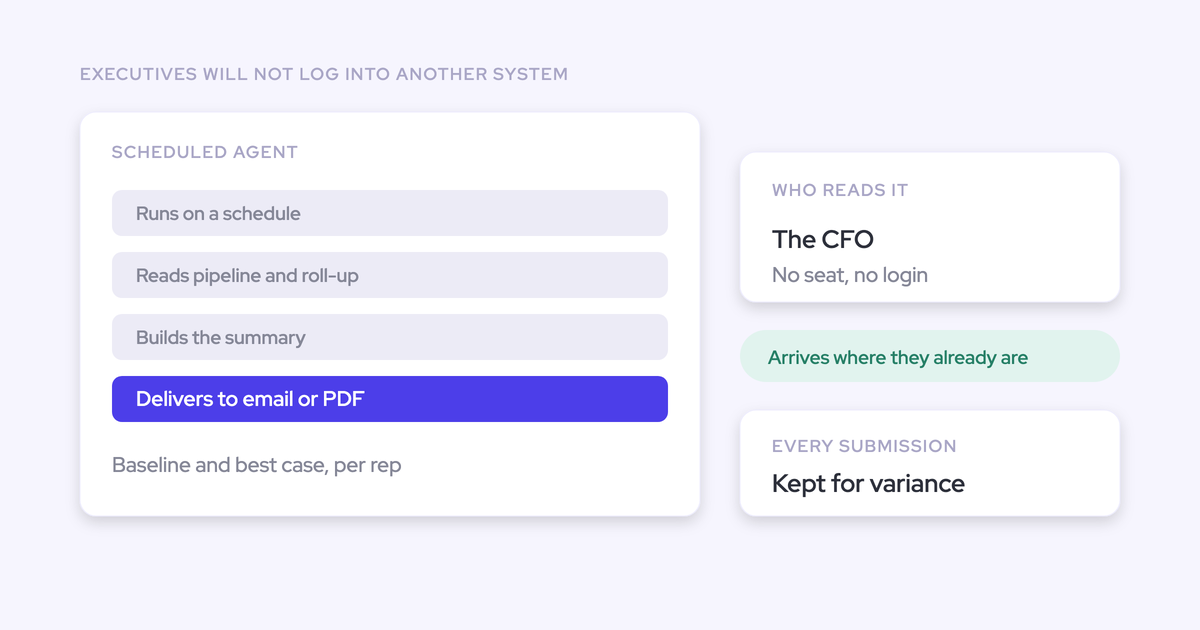
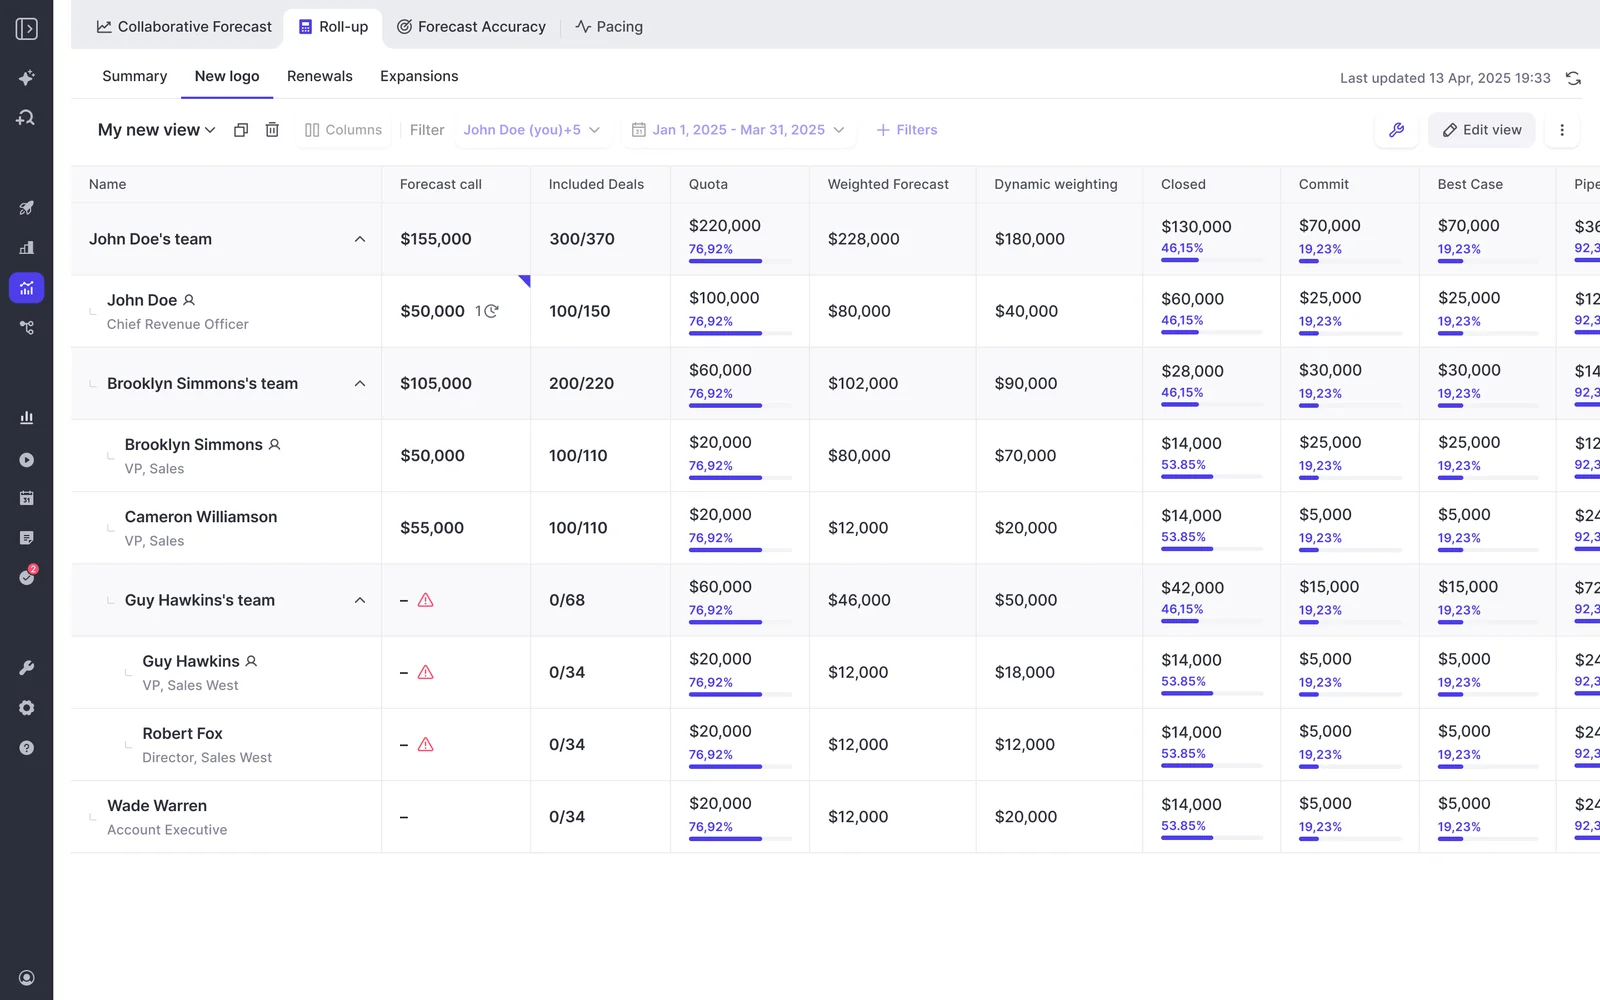
The roll-up underneath it works deal by deal: each rep submits a baseline and a best case, either as a total or by picking the specific opportunities behind each figure, with a comment. Every submission is versioned, managers can override, and deadlines lock the field.
Deal-level AI scoring that explains a gap, not just names it
Weflow's AI projection scores each deal on more than fifty signals and up to two years of history, then returns a landing range rather than a single number.
Because it works deal by deal, a large opportunity that's being poorly worked gets projected down, and the gap between the roll-up and the projection resolves into a list of named deals instead of a mystery at the aggregate level.
That's the question to ask any vendor selling you an AI forecast: does it score each deal individually, or does it project from the aggregate? Aggregate models are stage probability with better branding, and they inherit whatever is wrong with your history.
The warnings from those signals also surface inside the submission screen, at the moment a rep picks which deals to commit. Catching an inactive, single-threaded deal there beats finding it in a report after the number is already wrong.
Forecast accuracy measured per rep, quarter over quarter
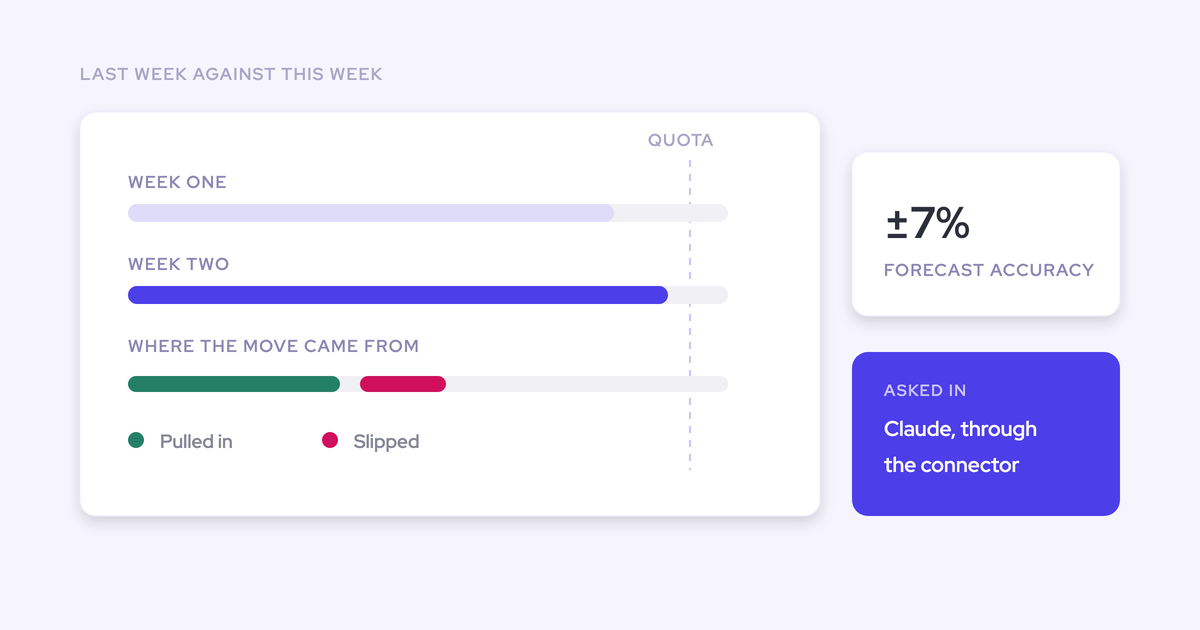
Weflow records every forecast submission against the final closed amount, so variance is reportable per rep, per manager, and by segment across consecutive quarters.
That's the piece Clari doesn't do, and it's what turns "whose call do I trust" from a debate into a track record you can point at.
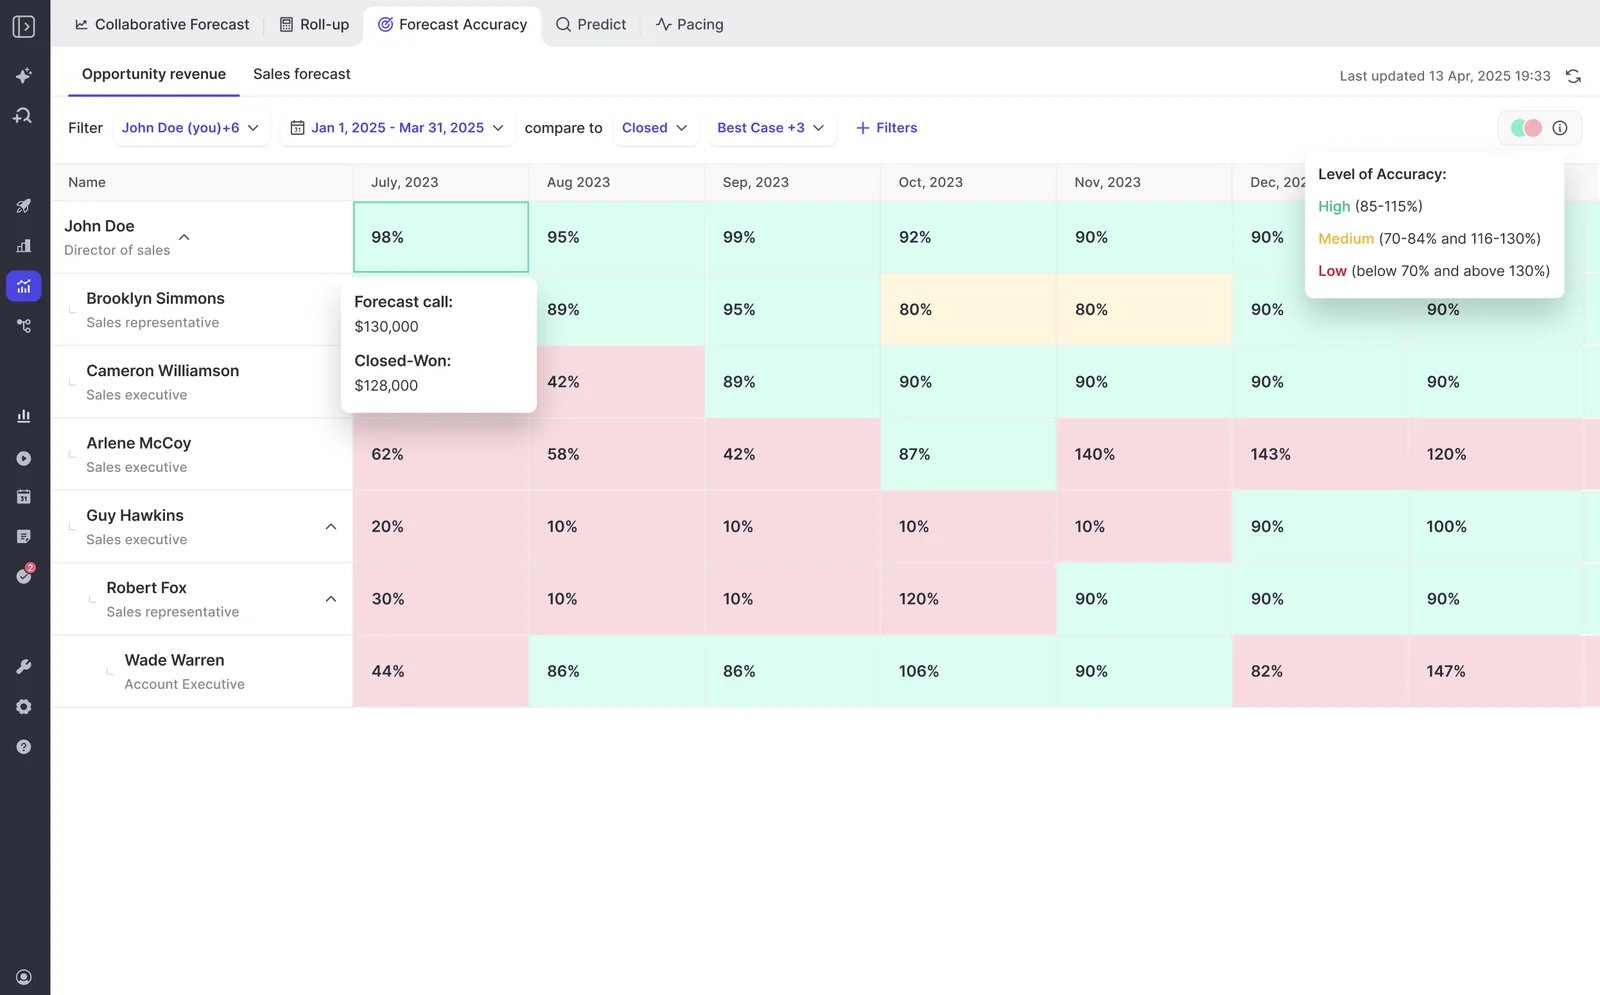
Overrides are timestamped, attributed, and kept with their rationale, and the rep's original stays visible next to the manager's adjustment. After a missed quarter you can say who moved what, and when.
"Weflow helps us create predictability, accountability, and accuracy. Quarter after quarter."
— Chris MacKinnon, VP Revenue Operations, Zeotap
What Weflow won't fix: weak data and a missing cadence
None of this works on weak data, and we've proved that on ourselves. The prediction forecast we shipped before automating capture wasn't accurate enough to run a business on.
The second limit is organizational. Forecasting is a leadership motion, not a rep tool, and it's the one part of a rollout that fails when the cadence underneath it doesn't exist.
"If you don't run an operating cadence, the best tool in the world won't help you."
— Philipp Stelzer, Co-founder and CPO, Weflow
So if reps don't submit weekly, stages have no enforced criteria, and activity isn't captured automatically, fix that sequence first. We'd rather challenge a prospect on their cadence during the evaluation than sell them a forecast view that gets opened twice.
FAQ: weighted vs roll-up vs AI forecasting
Is the AI forecast projection just stage probability in disguise?
Not in Weflow. The projection scores each opportunity individually across more than fifty deal signals and up to two years of history, including velocity, communication cadence, whether a next meeting is booked, and whether the deal is healthy against your methodology.
Stage probability applies one number to every deal sitting in the same stage. That distinction is the single most useful question to ask when evaluating any AI forecast.
Does the three-forecast corridor replace the weekly forecast call?
No, it changes what the call is about. The gaps become the agenda, so you spend the hour on the eight deals that explain the spread instead of walking the whole list.
That matters commercially. A weekly forecast call is an hour in the calendar and several days of prep across ops, managers, and reps. Anything that adds a fourth prep step has made the problem worse.
Can I forecast on ARR or a converted currency field instead of Amount?
Yes. A Weflow forecast setup is built on one chosen opportunity currency field, indexed on one chosen date field, and you can run several setups in parallel with their own stages, cadence, and targets.
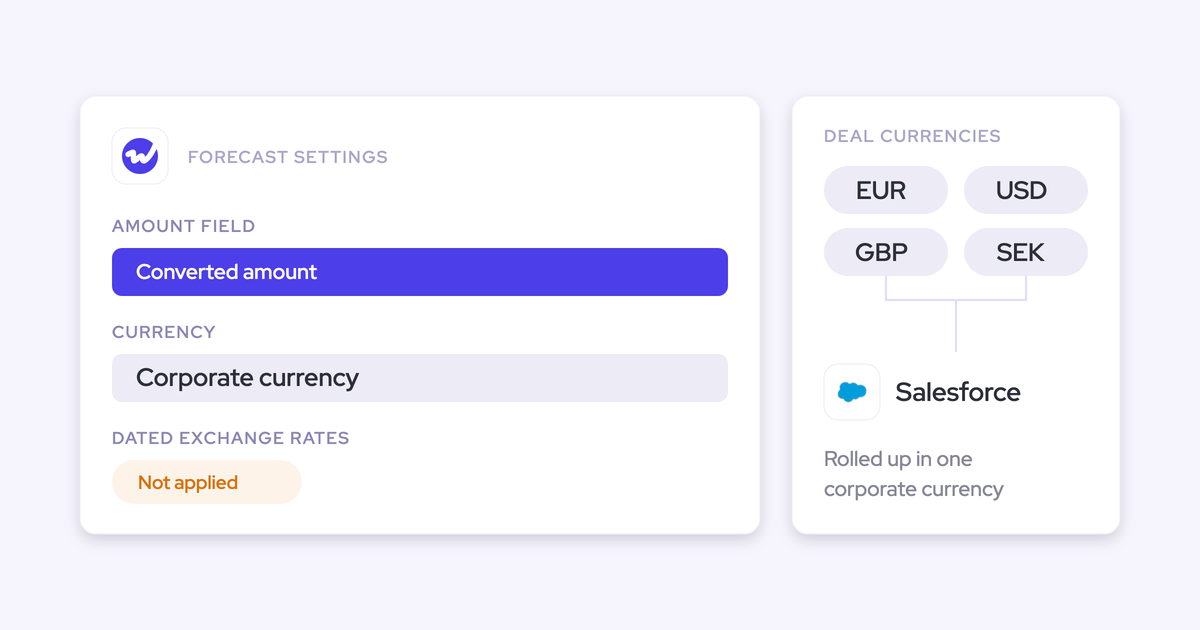
Two caveats worth knowing up front. Weflow reads the standard Salesforce currency field and doesn't apply dated exchange rates, so multi-currency teams point the forecast at their own converted amount field. And a setup places the full opportunity amount into the single period its date field falls into, so it can't split one deal across quarters.
How long until the three-forecast method proves out?
Longer than a trial. Weflow's 14-day free trial includes implementation at no cost and proves out activity capture and conversation intelligence cleanly, because those act on meetings and emails that are already happening.
Forecasting needs enough cycles to compare what was submitted against what closed, which is closer to three months. That's why we offer a three-month paid pilot, contractually the first three months of a multi-year agreement with an opt-out at the end of it.
Where does the forecast roll-up data live, Salesforce or Weflow?
Forecast submissions, targets, and roll-up data live in the Weflow application and are not written into Salesforce objects. That's the one exception to how everything else works, since activity, transcripts, summaries, and AI field updates all land in native Salesforce objects.
The weighted forecast and the AI projection run off CRM data with no rep input, so a team that insists reps live only in Salesforce can still use those two. Teams that snapshot forecasts into a BI tool pull the roll-up through the public API.
What does Weflow forecasting cost compared to Clari?
Weflow Deal Intelligence & Forecasting is $39 per user per month standalone, and Revenue AI Enterprise, which adds Activity & Contact Capture and Conversation Intelligence underneath it, is $79. Annual billing, ten-user minimum, no implementation fee.
Clari runs an estimated $120 to $180 per user per month, plus reported professional services fees of $15,000 to $50,000 to implement.
If you're locked into a forecasting renewal, the sensible move is to land on capture and conversation intelligence now, which sit outside that contract, and expand into forecasting later for a small per-user increment rather than a second six-figure line item.