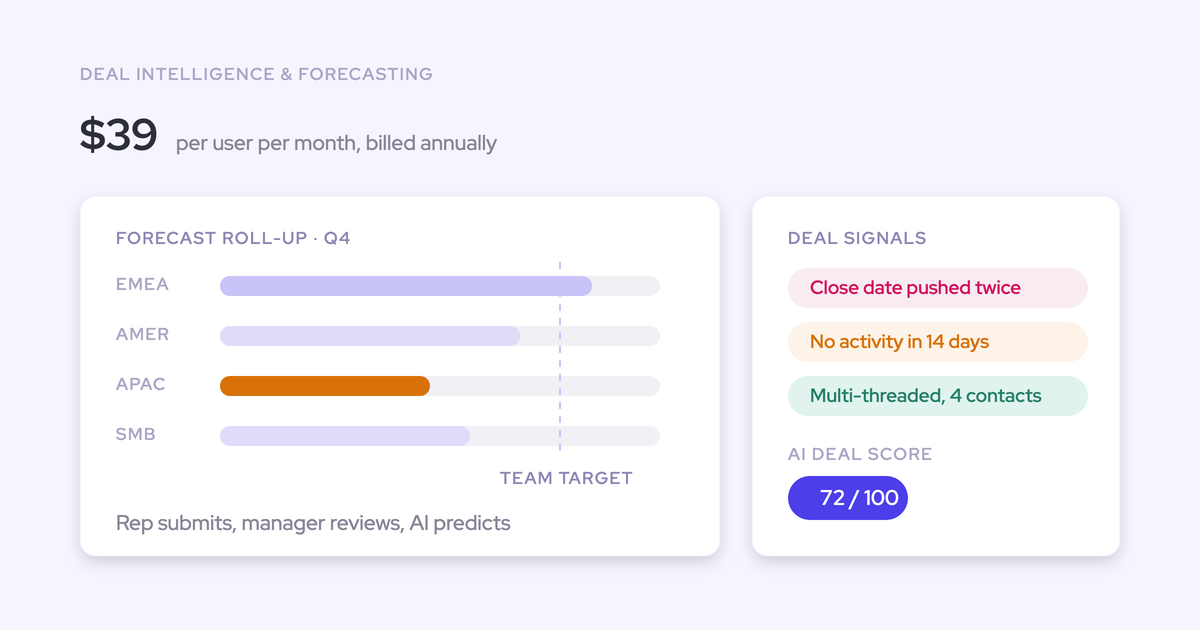
Sales Forecasting Methods: 10 Approaches Compared
Compare 10 sales forecasting methods by accuracy, data needs, and best-fit use cases.



Top-Down vs. Bottom-Up Forecasting: Which Approach Fits Your Sales Org?
Top-down forecasting starts with market-level data and works backward to individual rep quotas; bottom-up forecasting starts with rep-level pipeline data and rolls it up to company projections. The right approach depends on your data maturity, sales cycle complexity, and how much you trust your CRM activity data.
Top-down works best when you have reliable market data but sparse pipeline visibility—common in early-stage orgs or when entering new segments. Bottom-up delivers more accuracy when you have clean opportunity data, consistent stage definitions, and reps who actually update Salesforce. Most mature RevOps teams use a hybrid: bottom-up as the primary method, with top-down as a sanity check against market constraints.

Dimension | Top-Down Forecasting | Bottom-Up Forecasting |
|---|---|---|
Starting point | Total addressable market or historical revenue | Individual opportunities and rep pipelines |
Data source | Market research, industry benchmarks, prior-year revenue | Salesforce opportunities, activity data, deal stages |
Best for | New markets, annual planning, board-level projections | Quarterly commits, pipeline reviews, rep accountability |
Accuracy level | Lower—relies on assumptions about market capture | Higher when CRM data is complete and up to date |
Qualitative, Time Series, and Causal: 3 Sales Forecasting Model Categories
Sales forecasting methods fall into three categories based on how they use data: qualitative (expert judgment), time series (historical patterns), and causal (relationship-based). Understanding which category fits your situation helps you pick the right method without overengineering.
What are qualitative sales forecasting methods?
Qualitative methods rely on human judgment rather than quantitative data. They’re useful when historical data is unavailable or unreliable—launching a new product, entering an unfamiliar market, or forecasting for an early-stage team with limited CRM history. The Delphi method is a structured qualitative approach: multiple experts submit independent forecasts, see aggregated results, and revise until consensus emerges. The downside is bias—reps tend toward optimism, managers toward sandbagging.
How does time series analysis work in sales forecasting?
Time series methods analyze historical revenue patterns to predict future outcomes. Moving averages smooth out noise by averaging revenue over rolling periods (e.g., trailing three months). Exponential smoothing weights recent data more heavily than older data—useful when your business is changing. ARIMA (AutoRegressive Integrated Moving Average) handles seasonality and trends mathematically but requires clean, consistent historical data spanning multiple years. These methods assume the future resembles the past, which breaks down during market shifts or strategic pivots.
What are causal forecasting models?
Causal models identify relationships between variables that drive revenue—lead volume, marketing spend, sales headcount, economic indicators. Regression analysis is the most common approach: it quantifies how changes in input variables predict changes in revenue. A RevOps team might model the relationship between MQL volume, AE capacity, and closed-won revenue to forecast based on planned marketing spend and hiring. Causal models require more setup but explain why revenue changes, not just that it will change.
10 Sales Forecasting Methods Compared (With Pros, Cons, and Use Cases)
Each sales forecasting method trades off accuracy, complexity, and data requirements differently. The comparison table below summarizes the 10 methods covered in this guide.
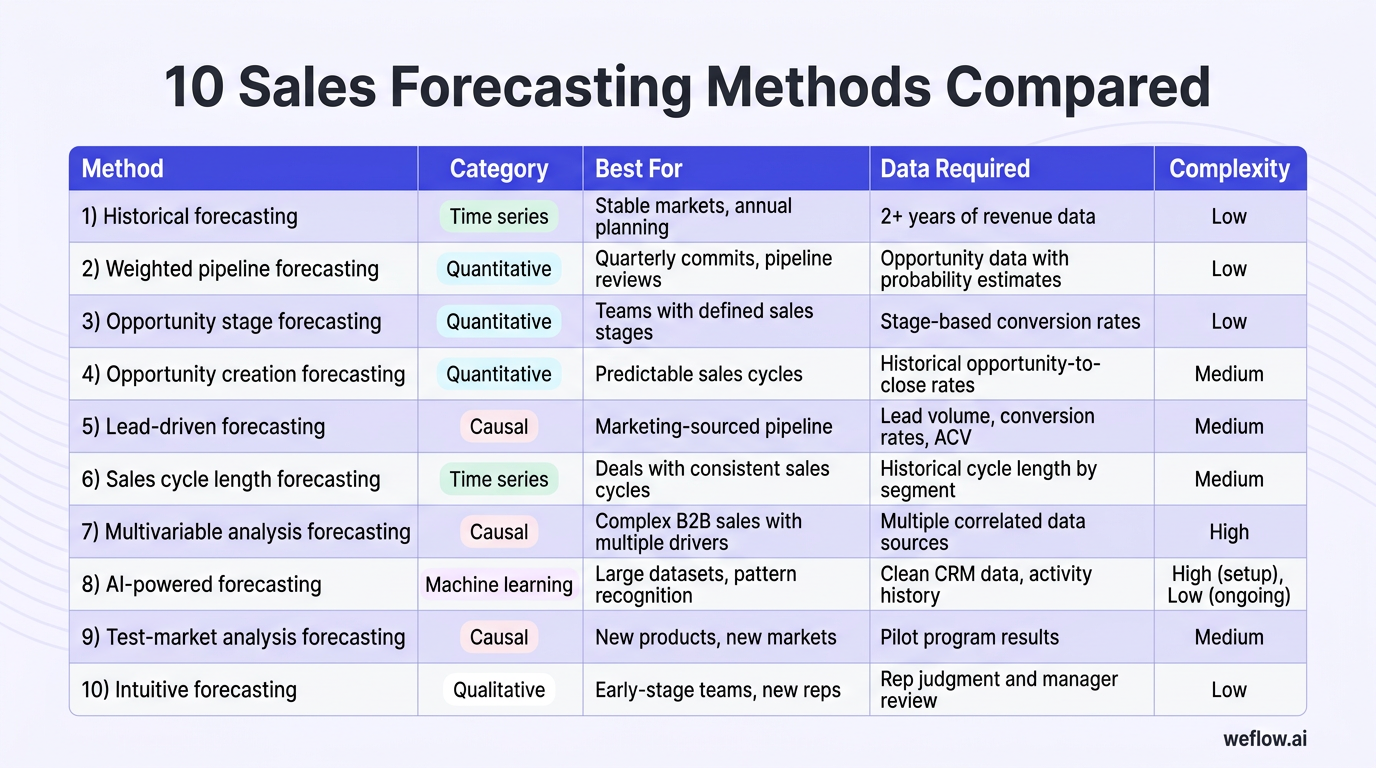
Method | Category | Best For | Data Required | Complexity |
|---|---|---|---|---|
Historical forecasting | Time series | Stable markets, annual planning | 2+ years of revenue data | Low |
Weighted pipeline forecasting | Quantitative | Quarterly commits, pipeline reviews | Opportunity data with probability estimates | Low |
Opportunity stage forecasting | Quantitative | Teams with defined sales stages | Stage-based conversion rates | Low |
Opportunity creation forecasting | Quantitative | Predictable sales cycles | Historical opportunity-to-close rates | Medium |
Lead-driven forecasting | Causal | Marketing-sourced pipeline | Lead volume, conversion rates, ACV | Medium |
Sales cycle length forecasting | Time series | Deals with consistent sales cycles | Historical cycle length by segment | Medium |
Multivariable analysis forecasting | Causal | Complex B2B sales with multiple drivers | Multiple correlated data sources | High |
AI-powered forecasting | Machine learning | Large datasets, pattern recognition | Clean CRM data, activity history | High (setup), Low (ongoing) |
Test-market analysis forecasting | Causal | New products, new markets | Pilot program results | Medium |
Intuitive forecasting | Qualitative | Early-stage teams, new reps | Rep judgment and manager review | Low |
Historical forecasting
Historical forecasting projects future revenue based on past performance, typically applying year-over-year growth rates to prior-period actuals.
Pros | Cons |
|---|---|
Simple to calculate and explain | Assumes stable conditions |
Requires minimal data infrastructure | Ignores current pipeline health |
Good baseline for sanity-checking other methods | Breaks down during market shifts or pivots |
When to use it:
Annual planning when you need a starting point for territory and quota allocation
Board reporting when stakeholders want context against prior-year performance
Sanity-checking bottom-up forecasts against historical norms
Worked example: Q1 2025 revenue was $2.4M. Your market grew 8% year-over-year. Applying the same growth rate: Q1 2026 forecast = $2.4M x 1.08 = $2.59M. Adjust based on known factors like rep capacity changes or product launches.
Weighted pipeline forecasting
Weighted pipeline forecasting multiplies each deal’s value by its probability of closing and sums the results across your pipeline.
Formula: Forecast = Sum of (Deal Value x Close Probability)
Pros | Cons |
|---|---|
Accounts for deal-level variation in likelihood | Accuracy depends on probability estimates |
Works with standard Salesforce opportunity fields | Reps often inflate probabilities to look productive |
Updates automatically as pipeline changes [banner type="download" url="https://www.weflow.ai/resources/cheat-sheets/the-ultimate-sales-forecasting-guide" text="Sales Forecasting Guide" subtitle="Tighten cadence, CRM hygiene, and roll-ups so your number holds up at QBR" button="Get the guide"] | Doesn’t account for deal velocity or age |
When to use it:
Weekly pipeline reviews where you need a single number to track
Quarterly forecasting when you have reasonably calibrated probabilities
Combining with opportunity stage forecasting to cross-validate
Worked example:
Deal | Value | Probability | Weighted Value |
|---|---|---|---|
Acme Corp | $50,000 | 75% | $37,500 |
Beta Inc | $30,000 | 50% | $15,000 |
Gamma LLC | $80,000 | 25% | $20,000 |
Total | $160,000 | — | $72,500 |
Opportunity stage forecasting
Opportunity stage forecasting assigns fixed conversion probabilities to each sales stage and weights pipeline value accordingly.
Pros | Cons |
|---|---|
Standardizes probability across reps and deals | Stage definitions must be enforced consistently |
Based on historical conversion data, not rep judgment | Doesn’t account for deal-specific risk factors |
Easy to implement with Salesforce Path and reports | Requires ongoing calibration as win rates change |
Stage probability table (example):
Stage | Probability |
|---|---|
Discovery | 10% |
Demo | 30% |
Proposal | 50% |
Negotiation | 75% |
Verbal Commit | 90% |
When to use it:
Teams running a defined sales process (MEDDIC, SPICED, etc.)
Manager roll-ups where you need consistency across territories
Replacing gut-feel probabilities with data-backed estimates
Opportunity creation forecasting
Opportunity creation forecasting predicts revenue based on the volume of new opportunities created in prior periods and historical close rates.
Pros | Cons |
|---|---|
Leading indicator based on early funnel activity | Assumes consistent opportunity quality over time |
Useful for pipeline coverage analysis | Lag between creation and close can be months |
Highlights capacity gaps early | Requires accurate historical close rates by cohort |
When to use it:
Monthly pipeline reviews to project 90-180 day revenue
Capacity planning when assessing whether current pipeline supports quota
Identifying pipeline gaps before they become forecast misses
Lead-driven forecasting
Lead-driven forecasting projects revenue based on lead volume, conversion rates, and average deal size—useful when marketing is the primary pipeline source.
Formula: Forecast = Lead Volume x Conversion Rate x Average Contract Value
Pros | Cons |
|---|---|
Directly ties marketing activity to revenue outcomes | Only works for inbound-heavy sales motions |
Enables marketing ROI analysis | Conversion rates vary by lead source and quality |
Clear inputs that are measurable and controllable | Ignores outbound and partner-sourced pipeline |
When to use it:
Inbound-led growth companies with predictable lead flow
Marketing planning when allocating budget to channels
Early-stage teams with limited historical opportunity data
Worked example: 200 leads x 8% lead-to-close conversion rate x $15,000 ACV = $240,000 forecasted revenue.
Sales cycle length forecasting
Sales cycle length forecasting uses the age of deals relative to your average sales cycle to estimate close probability.
Formula: Close Probability = Days in Pipeline / Average Cycle Length
Pros | Cons |
|---|---|
Accounts for deal velocity, not just stage | Cycle length varies by deal size and segment |
Identifies stalled deals objectively | Doesn’t work for non-linear sales processes |
Complements stage-based forecasting | Requires accurate close date tracking in CRM |
When to use it:
Flagging at-risk deals that have exceeded typical cycle length
Segmenting forecasts by deal size (SMB vs. enterprise)
Improving forecast timing accuracy, not just amount accuracy
Multivariable analysis forecasting
Multivariable analysis forecasting uses regression or correlation models to predict revenue based on multiple input factors simultaneously.
Pros | Cons |
|---|---|
Captures complex relationships between variables [banner type="download" url="https://www.weflow.ai/resources/cheat-sheets/bottom-up-sales-forecasting" text="Bottom-Up Forecasting Guide" subtitle="Roll up rep pipeline into a forecast leadership stops second-guessing" button="Download guide"] | Requires statistical expertise to build and maintain |
More accurate when multiple factors drive outcomes | Data quality issues amplify forecast errors |
Quantifies the impact of specific drivers | Black-box feel can reduce stakeholder trust |
When to use it:
Enterprise orgs with dedicated analytics or RevOps capacity
Markets where multiple external factors (economic indicators, competitor activity) influence outcomes
Long-range planning where you need to model scenarios
AI-powered sales forecasting
AI-powered forecasting uses machine learning models trained on CRM data, activity history, and deal patterns to predict revenue outcomes without manual probability assignments.
Pros | Cons |
|---|---|
Identifies patterns humans miss (email sentiment, activity gaps) | Requires substantial historical data to train |
Removes subjective bias from forecasts | Accuracy depends on CRM data completeness |
Improves over time as models learn | Initial setup and calibration can take weeks |
Flags at-risk deals based on behavioral signals | Explainability can be limited for some models |
How AI forecasting differs from manual methods: Traditional methods require humans to assign probabilities or define rules. AI models analyze thousands of data points—email response times, meeting frequency, stakeholder engagement, deal progression velocity—to generate probabilities automatically. Tools like Salesforce Einstein, Clari, and Gong offer built-in AI forecasting. The catch: AI is only as good as your data. If reps don’t log activities or update opportunities, AI models underperform basic weighted pipeline methods.
When to use it:
Teams with 50+ reps and 2+ years of clean CRM data
Organizations where forecast misses have significant business impact
Environments with consistent sales processes and stage definitions
When you’ve automated activity capture to ensure complete data
Test-market analysis forecasting
Test-market analysis forecasting uses results from pilot programs or limited rollouts to project full-market revenue potential.
Pros | Cons |
|---|---|
Real-world data from actual buyer behavior | Pilot conditions may not reflect full market |
Reduces risk before major resource commitment | Takes time to run and collect meaningful data |
Useful when historical data doesn’t exist | Sample size limits statistical confidence |
When to use it:
New product launches before scaling go-to-market
Entering new geographic markets or verticals
Pricing experiments before broad rollout
Intuitive forecasting
Intuitive forecasting relies on rep and manager judgment about deal outcomes, typically gathered through pipeline reviews or forecast calls.
Pros | Cons |
|---|---|
Incorporates qualitative context data can’t capture | Subject to cognitive biases (optimism, anchoring) |
No data infrastructure required | Accuracy varies wildly by rep experience |
Fast to implement for early-stage teams | Hard to aggregate consistently across territories |
When to use it:
Startups with limited CRM history
Deal-level calls where relationship context matters
As a supplement to data-driven methods, not a replacement
How to Choose the Right Sales Forecasting Method
The right forecasting method depends on your data maturity—how complete, accurate, and historical your CRM data is. Teams with sparse data should start simple; teams with rich data can layer more sophisticated approaches.
Data Maturity Level | Recommended Methods | Why |
|---|---|---|
Early (limited CRM history, inconsistent data) | Intuitive, historical, lead-driven | These methods require minimal infrastructure and work with incomplete data |
Developing (1-2 years of data, improving hygiene) | Weighted pipeline, opportunity stage, sales cycle length | Enough historical patterns to calibrate probabilities |
Mature (2+ years, clean data, automated capture) | AI-powered, multivariable analysis, hybrid approaches | Rich data enables pattern recognition and complex modeling |
Most RevOps teams don’t use a single method—they layer complementary approaches. A common stack: opportunity stage forecasting as the baseline, weighted pipeline for deal-level adjustments, historical growth rates as a sanity check, and AI-powered signals to flag at-risk deals. The key is matching method complexity to data quality. Sophisticated models on bad data produce worse results than simple models on clean data.
How to Improve Sales Forecasting Accuracy: 3 Proven Tactics
Forecast accuracy isn’t just about picking the right method—it’s about the operational practices that ensure your inputs are reliable. These three tactics have the highest impact across mid-market and enterprise sales orgs.

Set a weekly, monthly, and quarterly forecasting cadence
Forecasting improves with frequency. Weekly reviews catch issues while there’s time to course-correct; monthly and quarterly roll-ups feed planning cycles.
Weekly: Rep-level pipeline review focused on commit and best-case deals. Update close dates, amounts, and stage for any deal with new information.
Monthly: Manager roll-up comparing forecast to target. Identify coverage gaps and prioritize deals for acceleration.
Quarterly: Leadership review of commit vs. actuals. Recalibrate stage probabilities based on observed conversion rates.
Post-quarter: Analyze forecast accuracy by rep, segment, and method. Document what caused misses.
Clean up your CRM data
Forecast accuracy has a ceiling determined by CRM data quality. Missing activities, stale close dates, and incomplete opportunity fields make every forecasting method less reliable.
Automate activity capture so emails, meetings, and calls log to Salesforce without rep effort. Manual logging creates gaps—reps forget, skip, or summarize inaccurately. Tools like Weflow capture activities automatically and sync them to native Salesforce objects, ensuring reports and forecasts reflect actual engagement.
Enforce required fields at stage progression. If reps can advance a deal to Proposal without entering MEDDIC fields, your data is incomplete.
Run weekly data quality reports. Flag opportunities with no activity in 14+ days, close dates in the past, or missing key fields.
Assign data stewardship. Someone on RevOps should own CRM hygiene metrics and have authority to enforce compliance.
Account for internal and external factors
Forecasts break when they ignore context. Both internal changes (rep turnover, territory realignment) and external shifts (market conditions, competitor moves) affect outcomes in ways historical data alone can’t capture.
Factor | Example Impact |
|---|---|
Rep ramp time | New hires produce 50-70% of quota in first two quarters |
Territory changes | Reassignments create 30-60 day productivity dips |
Seasonality | Budget cycles compress Q4 closes, delay Q1 decisions |
Economic conditions | Recessions extend sales cycles 20-40% |
Competitor pricing | Aggressive discounting pressures win rates and deal sizes |
Build adjustment factors into your forecast model for predictable impacts. Document assumptions so you can validate them against actuals and refine over time.
Frequently Asked Questions About Sales Forecasting Methods
What is the most accurate sales forecasting method?
AI-powered forecasting typically delivers the highest accuracy for teams with clean, complete CRM data and 2+ years of history. For teams without that data foundation, opportunity stage forecasting calibrated on historical conversion rates outperforms more complex methods. Accuracy depends more on data quality than method sophistication.
What is the difference between qualitative and quantitative sales forecasting?
Qualitative forecasting relies on human judgment—rep intuition, manager assessment, expert consensus. Quantitative forecasting uses numerical data: pipeline values, conversion rates, historical revenue. Most effective forecasting combines both: quantitative methods as the baseline, with qualitative adjustments for context data can’t capture.
How do I choose the right sales forecasting method for my team?
Start with your data maturity. Early-stage teams with sparse CRM history should use intuitive or historical methods. Teams with 1-2 years of clean data can implement weighted pipeline or stage-based forecasting. Mature orgs with automated activity capture and consistent processes benefit most from AI-powered or multivariable approaches. Match complexity to data quality.
What is weighted pipeline forecasting and how does it work?
Weighted pipeline forecasting multiplies each opportunity’s value by its probability of closing, then sums across all deals. A $100K deal at 50% probability contributes $50K to the forecast. The challenge is calibrating probabilities accurately—most teams tie probability to sales stage rather than relying on rep judgment.
How often should you update a sales forecast?
Weekly updates are standard for commit and best-case forecasts. Monthly roll-ups support planning and resource allocation. Quarterly reviews recalibrate methodology against actuals. More frequent updates catch issues earlier but require more rep and manager time. Automate pipeline data capture to reduce the update burden without sacrificing freshness.
Can AI improve sales forecasting accuracy?
Yes—when data quality supports it. AI models analyze patterns across thousands of deals: email sentiment, meeting frequency, stakeholder engagement, deal velocity. They identify risk signals humans miss and remove subjective bias from probability estimates. The catch: AI trained on incomplete data produces unreliable forecasts. Teams using AI forecasting typically see 10-20% accuracy improvements after 2-3 quarters of model tuning.
What is the biggest challenge in sales forecasting?
Data quality. Every forecasting method depends on accurate inputs—opportunity amounts, close dates, stage progression, activity history. When reps don’t update Salesforce, when activities don’t sync, when stage definitions aren’t enforced, forecast accuracy suffers regardless of method. Solving the data problem solves 80% of the forecasting problem.
What is the difference between top-down and bottom-up sales forecasting?
Top-down forecasting starts with market-level data (total addressable market, historical revenue growth) and works backward to rep quotas. Bottom-up forecasting starts with rep-level pipeline data and aggregates upward. Bottom-up is more accurate when CRM data is reliable; top-down provides useful sanity checks against market constraints. Most mature teams use both.