

Sales Forecasting Best Practices: A Guide for RevOps and Sales Leaders
What is sales forecasting? (And why it matters for revenue teams)
Sales forecasting is the process of predicting future revenue based on pipeline data, historical performance, and deal-level signals. It answers a straightforward question: how much revenue will your team close in a given period?
For RevOps leaders and VPs of Sales, the forecast isn't just a number—it's the foundation for hiring decisions, territory planning, marketing spend, and board-level commitments. When forecasts are accurate, finance can plan confidently and leadership can make resource allocation decisions without guesswork. When forecasts are off, the downstream effects cascade: missed quotas, budget shortfalls, and eroded credibility with stakeholders.
The challenge is that most forecasts fall short. Gartner reports that only 45% of sales leaders are confident in their forecast accuracy. The gap between forecast and actual results typically stems from three root causes: unreliable CRM data, inconsistent forecasting methodology, and insufficient deal-level visibility. The sales forecasting best practices in this guide address each of these gaps systematically.
Who owns the sales forecast? Aligning sales, RevOps, and finance
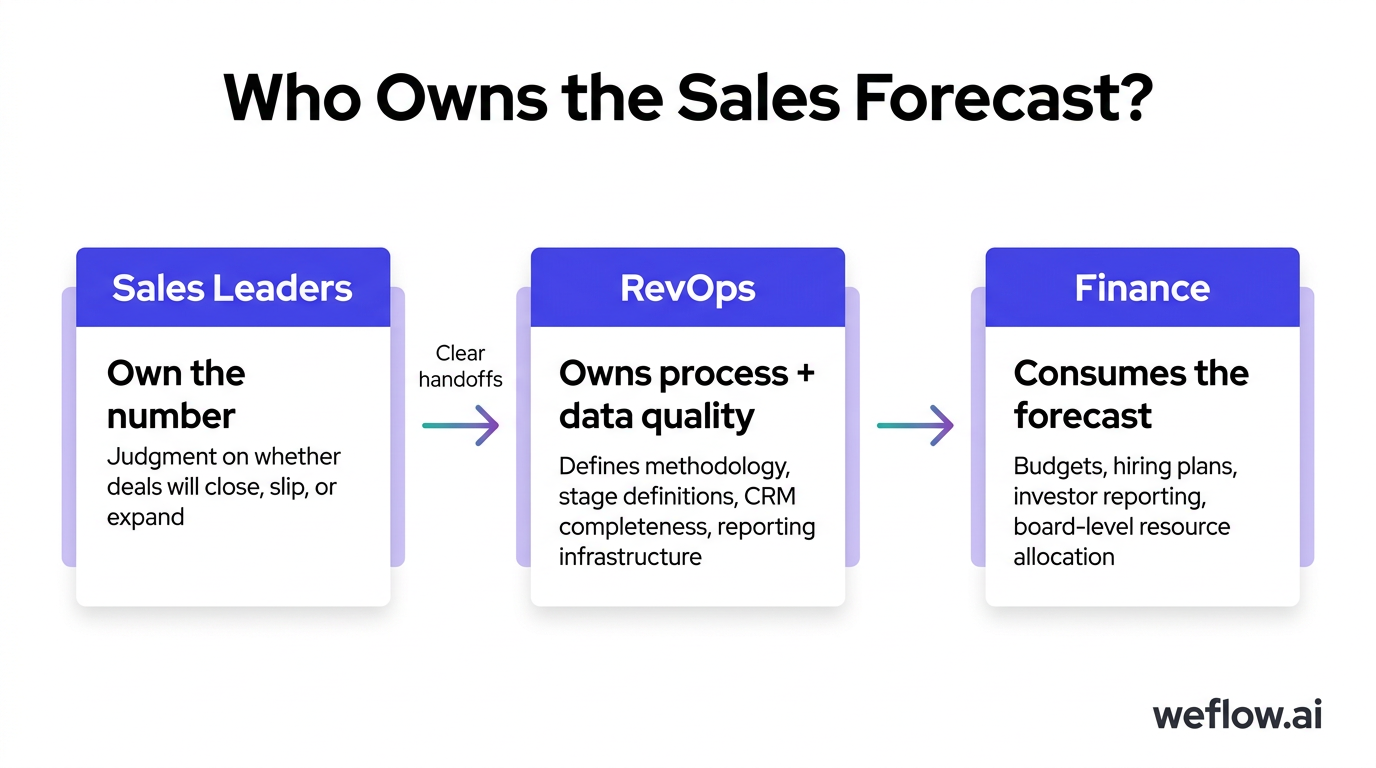
The forecast has multiple owners, each with distinct responsibilities:
- Sales leaders own the number. They're accountable for delivering on the commit and providing the qualitative judgment that data alone can't capture—whether a deal will close, slip, or expand.
- RevOps owns the process and data quality. They define forecasting methodology, maintain stage definitions, ensure CRM data is complete and accurate, and build the reporting infrastructure that makes forecasts trustworthy.
- Finance consumes the forecast for budgets, hiring plans, and investor reporting. They need numbers they can defend to the board and use for resource allocation across the organization.
Problems emerge when these roles blur or when one function doesn't trust the data the others produce. The most reliable forecasting processes establish clear handoffs: sales provides the judgment calls, RevOps ensures the data is clean and methodology is consistent, and finance gets a number they can build plans around.
Start with clean, trustworthy CRM data
No forecasting methodology produces accurate results if the underlying data is unreliable. Before optimizing your forecasting approach, audit your CRM data quality.
The data problems that kill forecasts aren't subtle—they're the basics: missing close dates, outdated opportunity amounts, deals stuck at the wrong stage, and activity gaps that hide whether reps are actually working their pipeline. When RevOps teams inherit a Salesforce instance with years of accumulated data debt, forecasting accuracy becomes impossible until the foundation is fixed.
Data hygiene checklist for forecasting:
- Make critical CRM fields mandatory. Close date, amount, stage, and forecast category should require values. Opportunities without these fields are invisible to your forecast model.
- Run automated data quality checks weekly. Flag deals with close dates in the past, amounts that don't match your average deal size by segment, or stages that haven't progressed in 30+ days.
- Audit rep pipelines monthly. Pull a list of each rep's open opportunities and have managers validate that deals are real, stages are accurate, and close dates are achievable.
- Automate activity syncing. Manual activity logging fails—reps don't do it consistently. Tools like Weflow automatically capture emails, meetings, and calls to Salesforce, giving RevOps complete visibility into deal engagement without relying on rep data entry.
Activity data matters for forecasting because it reveals engagement patterns that predict deal outcomes. A deal showing a healthy stage progression but zero activity in the past two weeks is likely stalled, regardless of what the stage field says. When activity capture is automated, your forecasting model can incorporate these signals instead of relying solely on stage-based probabilities.
How to choose the right sales forecasting method for your business
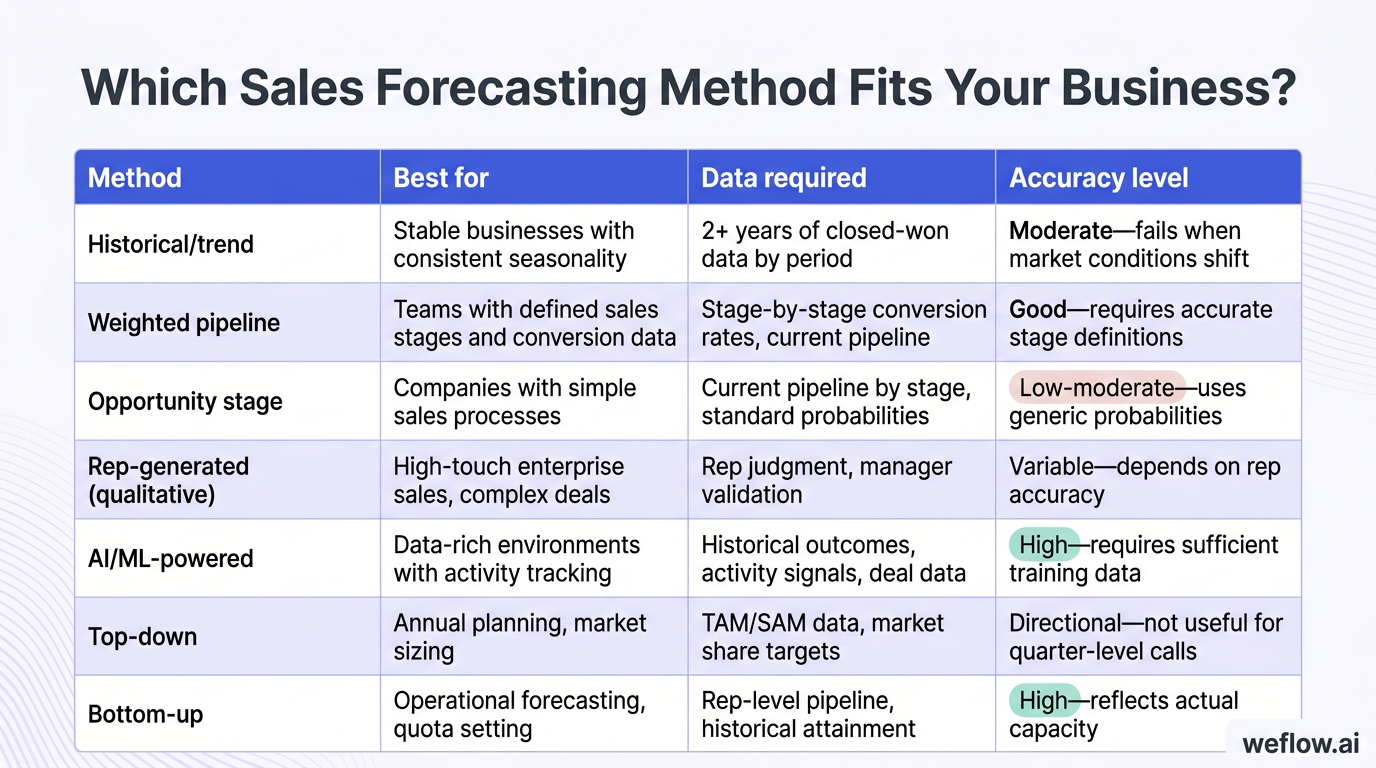
Different forecasting methods suit different business models, sales cycles, and data availability. The right choice depends on your deal velocity, data maturity, and how much historical performance data you have to work with.
| Method | Best for | Data required | Accuracy level |
|---|---|---|---|
| Historical/trend | Stable businesses with consistent seasonality | 2+ years of closed-won data by period | Moderate—fails when market conditions shift |
| Weighted pipeline | Teams with defined sales stages and conversion data | Stage-by-stage conversion rates, current pipeline | Good—requires accurate stage definitions |
| Opportunity stage | Companies with simple sales processes | Current pipeline by stage, standard probabilities | Low-moderate—uses generic probabilities |
| Rep-generated (qualitative) | High-touch enterprise sales, complex deals | Rep judgment, manager validation | Variable—depends on rep accuracy |
| AI/ML-powered | Data-rich environments with activity tracking | Historical outcomes, activity signals, deal data | High—requires sufficient training data |
| Top-down | Annual planning, market sizing | TAM/SAM data, market share targets | Directional—not useful for quarter-level calls |
| Bottom-up | Operational forecasting, quota setting | Rep-level pipeline, historical attainment | High—reflects actual capacity |
How weighted pipeline forecasting works:
Weighted pipeline is the most common method for B2B organizations because it balances simplicity with accuracy. You assign a probability to each stage based on historical conversion rates, then multiply each deal's value by its stage probability.
Worked example: A $100,000 deal at Stage 4 (70% historical conversion rate) = $70,000 expected revenue. Sum the expected revenue across all deals to get your weighted pipeline forecast.
The weakness of weighted pipeline is that it treats all deals at a given stage identically. A $100K deal at Stage 4 with strong buyer engagement and a confirmed close date gets the same 70% probability as a stalled deal at Stage 4 that hasn't had activity in three weeks. AI-powered forecasting addresses this limitation by adjusting probabilities based on deal-specific signals.
Account for internal and external factors that skew forecasts
Pipeline data alone doesn't capture everything that affects forecast accuracy. Internal changes and external market conditions can shift outcomes in ways that historical conversion rates don't predict.
| Factor type | Examples | Impact on forecast |
|---|---|---|
| Internal: Hiring/layoffs | New reps ramping, departures mid-quarter | Reduces capacity; new hires have lower conversion rates until ramped |
| Internal: Territory shifts | Account reassignments, segment changes | Deals may slip as new owners rebuild relationships |
| Internal: Product changes | New product launches, pricing updates, feature deprecation | Can accelerate or stall deals depending on buyer reaction |
| Internal: Sales process changes | New methodology adoption, stage redefinition | Historical conversion rates may not apply to new process |
| External: Economic conditions | Recession, budget freezes, inflation | Extends sales cycles, increases deal scrutiny |
| External: Seasonality | Holiday slowdowns, fiscal year-end buying | Predictable but must be built into forecast models |
| External: Market/industry changes | New competitors, category consolidation | Affects win rates and competitive displacement deals |
| External: Regulatory changes | Compliance requirements, data privacy laws | Can accelerate or block deals depending on your positioning |
Build these factors into your forecasting process by maintaining adjustment factors for known events. If you're launching a new product mid-quarter, don't apply historical conversion rates to deals involving that product. If you're adding five new reps, reduce capacity assumptions for their territories until they're ramped.
How AI and machine learning are changing sales forecasting
AI-powered forecasting analyzes patterns that humans can't process at scale: historical deal outcomes, rep activity levels, email sentiment, meeting frequency, buyer engagement signals, and dozens of other variables that predict whether a deal will close.
Traditional forecasting methods assign static probabilities to pipeline stages. A deal at Stage 3 gets 40% probability regardless of whether the buyer responded to the last three emails or went silent two weeks ago. AI forecasting adjusts probabilities dynamically based on deal-specific signals.
Key AI forecasting capabilities:
- Time-decay probability adjustment. Deals that stall lose probability over time. If a Stage 4 deal hasn't had buyer activity in 14 days, AI models reduce its expected conversion rate automatically.
- Activity-based scoring. Deals with strong engagement patterns—multiple stakeholders involved, increasing meeting frequency, quick email response times—get probability boosts that static stage models miss.
- At-risk deal flagging. AI models identify deals likely to slip or churn based on signals that precede losses in historical data: single-threaded deals, declining activity, extended time in stage.
- Automated stage probability calibration. Instead of using generic probabilities (Stage 3 = 40%), AI models calculate probabilities based on your organization's actual conversion history and the specific characteristics of each deal.
Modern CRM-native tools like Weflow apply AI to forecast accuracy by combining activity capture with deal signal analysis. When your Salesforce data includes complete activity history—every email, call, and meeting—AI models have the inputs they need to predict outcomes. Without activity data, AI forecasting is just a fancier version of weighted pipeline.
Set a forecasting cadence: how often to review and update
Forecasting cadence depends on your sales cycle length, deal volume, and how the forecast is used downstream. Most B2B organizations need three distinct rhythms:
| Frequency | Purpose | Who's involved |
|---|---|---|
| Weekly | Pipeline hygiene and deal-level inspection | Sales managers, reps (in 1:1s or team pipeline reviews) |
| Monthly | Roll-up forecast review and adjustment | Sales leadership, RevOps, finance |
| Quarterly | Forecast accuracy analysis and methodology refinement | RevOps, sales leadership, executive team |
Weekly reviews focus on deal movement: what progressed, what stalled, what's at risk. Managers should inspect the top 10-20 deals in their team's pipeline and validate that stages, close dates, and amounts are accurate. This is where data hygiene happens.
Monthly reviews aggregate the weekly inputs into a forecast number that sales leadership can commit to. This is where judgment calls happen—weighing qualitative signals that data doesn't capture, adjusting for deals that are sandbagged or over-optimistic.
Quarterly reviews step back from individual deals to evaluate the forecasting process itself. How accurate were your forecasts last quarter? Where did they miss and why? This is where RevOps refines methodology, adjusts stage probabilities based on actual conversion data, and identifies systemic issues.
When to move from spreadsheets to sales forecasting software
Spreadsheet forecasting works for small teams with simple sales processes. It breaks down as you scale.
Signs you've outgrown spreadsheets:
- Version control problems. Multiple forecast versions circulate, and no one knows which is current.
- Manual data aggregation. Someone spends hours each week pulling data from Salesforce into a spreadsheet.
- Stale data. By the time the forecast is compiled, the underlying pipeline has changed.
- No audit trail. You can't see what changed between last week's forecast and this week's.
- Formula errors. Hidden calculation mistakes that propagate undetected.
- Limited analysis. You can't easily slice forecasts by segment, region, or rep without building new spreadsheets.
What to look for in forecasting software:
- Native Salesforce integration. The tool should read and write to Salesforce in real time—not sync data to a separate database that creates version conflicts.
- Collaborative forecasting workflows. Reps, managers, and leadership should be able to submit, review, and adjust forecasts in the same system.
- Activity data integration. Forecasting is more accurate when it incorporates engagement signals. Tools that combine activity capture with forecasting (like Weflow) give you both clean data and predictive insights.
- Historical accuracy tracking. The tool should show how accurate past forecasts were so you can calibrate methodology over time.
- Drill-down capability. Leadership needs the roll-up number; RevOps and managers need deal-level detail. Both views should be one click apart.
Deployment time matters. Enterprise forecasting tools that take quarters to implement mean quarters of continued spreadsheet chaos. Salesforce-native tools like Weflow deploy in weeks because they work with your existing Salesforce data model rather than requiring a parallel data infrastructure.
Common sales forecasting mistakes (and how to avoid them)
1. Relying on gut instinct over data
Experienced sales leaders develop intuition about deals—and that intuition has value. But gut calls without data validation lead to biased forecasts. The sales leader who “feels good” about a quarter may be anchoring on a few large deals while ignoring patterns in the rest of the pipeline. Combine judgment with systematic data review: inspect activity levels, stage progression, and buyer engagement before accepting qualitative assessments.
2. Ignoring pipeline hygiene
Garbage in, garbage out. When reps don't update close dates, amounts stagnate at placeholder values, and deals sit in early stages for months, no forecasting methodology can produce accurate results. The fix isn't more sophisticated models—it's enforcing CRM data standards and making data entry frictionless through automation.
3. Static quarterly forecasts
Submitting a forecast at the start of the quarter and checking it again at the end ignores how deals actually move. Pipeline changes weekly. Close dates slip. New opportunities emerge. Companies that forecast once a quarter are flying blind for 12 weeks at a time. Build a weekly review cadence that catches changes before they become surprises.
4. No segmentation
A single forecast number hides important variation. Enterprise deals, mid-market deals, and SMB deals have different conversion rates, cycle lengths, and risk profiles. New business and expansion revenue behave differently. Segment your forecast by deal type, region, and sales motion so you can identify where accuracy is strong and where it's weak.
5. Not tracking forecast accuracy
If you don't measure how accurate your forecasts are, you can't improve them. Track forecast vs. actual at the end of every quarter. Calculate accuracy by segment, by rep, and by forecast category. Identify patterns: Are certain reps consistently over-optimistic? Do deals in specific stages slip more than others? Use the data to refine your methodology.
Next steps: improve your sales forecasting process
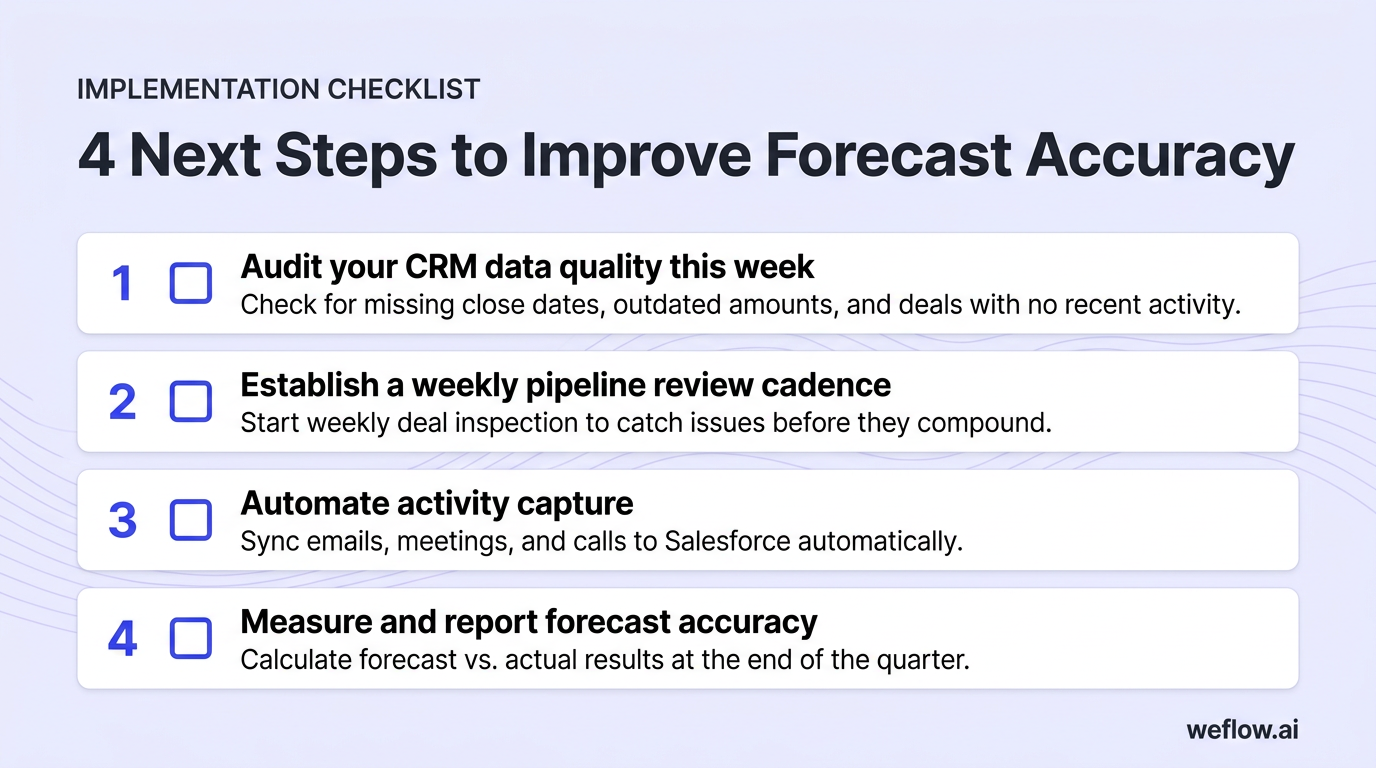
Improving forecast accuracy is an ongoing process, not a one-time fix. Start with these priorities:
- Audit your CRM data quality this week. Pull a report of all open opportunities and check for missing close dates, outdated amounts, and deals with no recent activity. Fix the data gaps before refining methodology.
- Establish a weekly pipeline review cadence. If you're not already doing weekly deal inspection, start. Even 30 minutes per manager per week catches issues before they compound.
- Automate activity capture. Manual activity logging is unreliable. Implement tools that sync emails, meetings, and calls to Salesforce automatically so your forecast has complete engagement data to work with.
- Measure and report forecast accuracy. At the end of this quarter, calculate how your forecast compared to actual results. Share the analysis with your team and identify specific areas for improvement.
The organizations that forecast accurately don't have magic—they have clean data, consistent methodology, and a process that catches problems early. Build that foundation, and forecast accuracy follows.
Frequently asked questions
What are the most important sales forecasting best practices?
The three practices that matter most are: (1) maintaining clean, complete CRM data so your forecast inputs are accurate, (2) choosing a forecasting method that matches your business model and data maturity, and (3) establishing a consistent cadence of pipeline review and forecast updates. Everything else builds on these fundamentals.
How often should I update my sales forecast?
Weekly deal-level reviews with monthly roll-up forecasts work for most B2B organizations. Weekly reviews catch pipeline changes early; monthly reviews produce the committed number leadership needs. Quarterly-only forecasting leads to surprises because pipeline shifts faster than a 90-day review cycle can capture.
What is the most accurate sales forecasting method?
AI/ML-powered forecasting typically produces the highest accuracy because it adjusts probabilities based on deal-specific signals rather than applying static stage-based percentages. However, AI forecasting requires sufficient historical data and activity capture to work. For organizations without that data foundation, weighted pipeline forecasting calibrated to your actual conversion rates is the next best option.
What is weighted pipeline forecasting?
Weighted pipeline forecasting assigns a probability to each pipeline stage based on historical conversion rates, then multiplies each deal's value by its stage probability to calculate expected revenue. For example, a $100,000 deal at a stage with 60% historical conversion contributes $60,000 to the weighted forecast. The sum of all weighted deal values equals your pipeline forecast.
How do I improve sales forecasting accuracy?
Start with data quality: ensure CRM fields are complete and current, automate activity capture to eliminate logging gaps, and validate deal stages regularly. Then measure accuracy by comparing forecasts to actual results at the end of each period. Use accuracy data to identify patterns—which segments, reps, or deal types have the largest forecast errors—and address root causes systematically.
What is the difference between top-down and bottom-up forecasting?
Top-down forecasting starts with a target (like a revenue goal or market share objective) and works backward to determine what pipeline and conversion rates are needed to hit it. Bottom-up forecasting starts with actual pipeline—what deals exist, at what stages, with what probabilities—and aggregates upward to a forecast number. Most organizations use top-down for annual planning and bottom-up for operational quarterly forecasts.
How is AI used in sales forecasting?
AI forecasting models analyze historical deal outcomes alongside real-time signals—activity levels, email engagement, meeting frequency, time in stage, number of stakeholders—to predict which deals will close and when. Unlike static stage probabilities, AI adjusts each deal's forecast contribution based on its specific characteristics. AI models also identify at-risk deals by recognizing patterns that preceded losses in historical data.
What are the biggest sales forecasting mistakes to avoid?
The most common mistakes are: relying on gut instinct without validating against data, tolerating poor CRM data hygiene, forecasting quarterly instead of weekly, treating all deals identically instead of segmenting by type and stage, and failing to track forecast accuracy over time. Each of these mistakes compounds—fix them systematically rather than trying to address all five at once.


.png)


