

Sales Forecasting: Methods, Process, and Tools Explained
What is sales forecasting?
Sales forecasting is the process of estimating future revenue based on historical performance, current pipeline data, and market conditions. It answers a simple question: how much revenue will your team close in a given period?
To forecast accurately, you need three things:
- Historical sales data — past performance by rep, segment, and deal type gives you baseline conversion rates and cycle lengths
- Pipeline visibility — real-time access to deal stages, values, and activity signals in Salesforce
- Understanding of internal and external factors — territory changes, hiring plans, economic conditions, and seasonality all affect whether deals close on time
Why is sales forecasting important for revenue teams?
Accurate forecasts give revenue leaders the data they need to make decisions with confidence. Here's what forecasting enables:
- Predict business performance — know whether you'll hit your quarterly number before it's too late to course-correct. A reliable forecast tells the board what to expect and gives sales managers time to act on gaps.
- Make data-driven decisions — stop guessing which deals will close. Use stage progression, activity levels, and deal age to prioritize where reps spend their time.
- Improve budget and resource allocation — headcount planning, marketing spend, and capacity models all depend on knowing how much revenue is coming. Bad forecasts lead to over-hiring or missed growth targets.
- Set realistic sales targets — quotas based on historical data and pipeline trends are achievable. Quotas based on wishful thinking destroy rep morale and credibility with leadership.
Common sales forecasting challenges (and how to fix them)
Most forecasting problems trace back to a few root causes. Here's what goes wrong and how to address it:
| Challenge | How to fix it |
|---|---|
| Subjectivity and rep bias — reps sandbagging or inflating commit calls based on gut feeling rather than data | Use objective criteria for forecast categories. Define what qualifies as "commit" vs. "best case" based on deal stage, activity recency, and MEDDIC completeness — not rep confidence. Track forecast accuracy by rep over time to identify patterns. |
| Poor CRM data quality — missing close dates, stale deal stages, incomplete contact data | Automate activity capture so Salesforce reflects what's actually happening. Implement validation rules that prevent deals from advancing without required fields. Run weekly data hygiene reports to flag gaps. |
| Lack of formal pipeline reviews — forecasts get updated in spreadsheets, not in the system of record | Run structured pipeline reviews inside Salesforce where deal updates happen in real time. Use a dedicated forecasting tool that tracks changes week-over-week so nothing slips through. |
| Poor tool integration — forecast data lives in spreadsheets disconnected from CRM data | Use forecasting tools that read directly from Salesforce, not exports. When your forecast is always in sync with pipeline data, you eliminate reconciliation errors and version control problems. |
| Over-optimistic forecasting — deals that haven't moved in weeks still counted at full value | Apply probability weighting based on stage and deal age. Flag deals with no activity in 14+ days as at-risk. Build a culture where early bad news is better than late surprises. |
How to create a sales forecast: a 3-step process
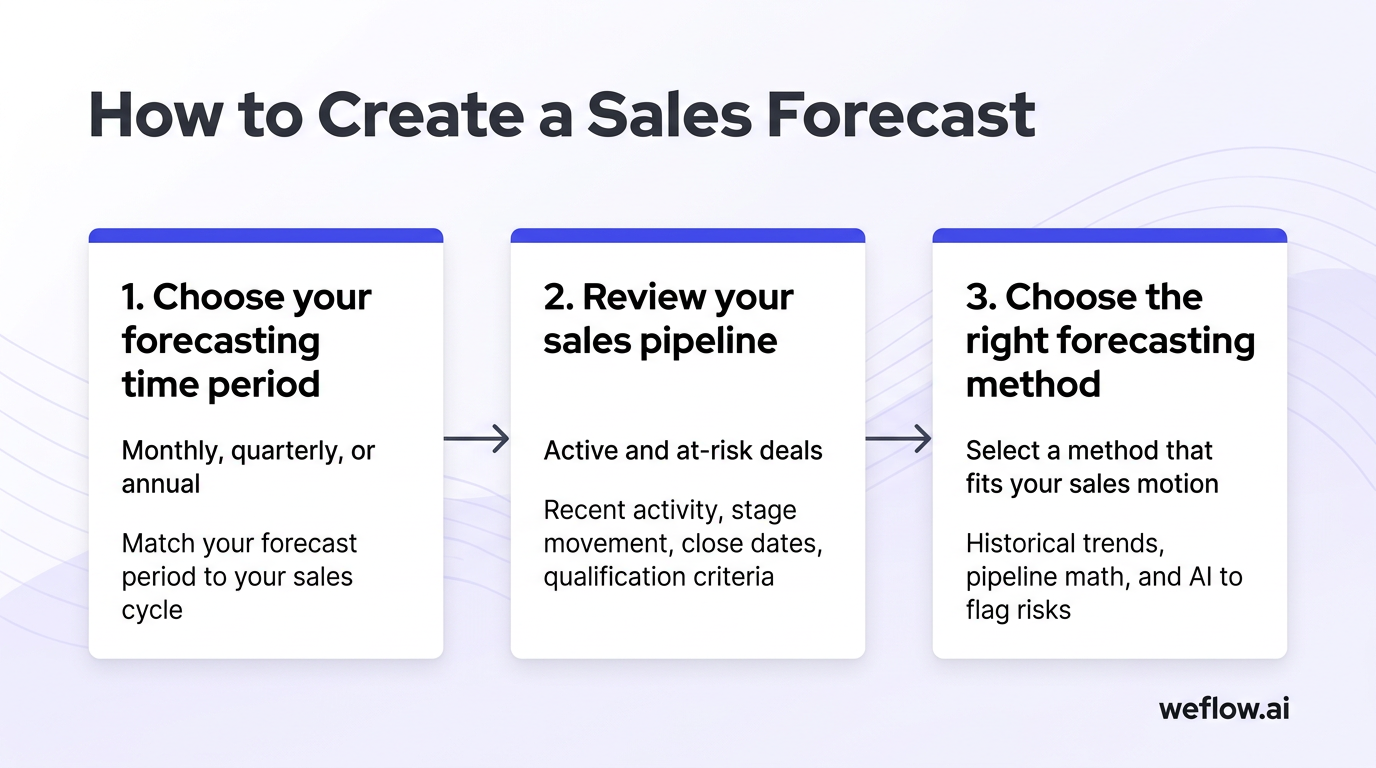
Building an accurate forecast starts with choosing the right time horizon, reviewing your pipeline health, and selecting a forecasting method that fits your sales motion.
Step 1: Choose your forecasting time period (monthly, quarterly, or annual)
Your forecasting cadence depends on your sales cycle length and how your business operates:
- Monthly forecasts work for transactional sales with short cycles (under 30 days). They give managers frequent checkpoints but require more overhead to maintain.
- Quarterly forecasts are standard for most B2B SaaS organizations. They align with board reporting, quota periods, and capacity planning. Most RevOps teams run weekly forecast calls that roll up to a quarterly view.
- Annual forecasts set the top-line target for budgeting and headcount planning. They're directional — updated quarterly as actuals come in — not operationally precise.
Match your forecast period to your sales cycle. If your average deal takes 90 days to close, weekly forecast updates on a quarterly horizon make sense. If deals close in two weeks, monthly forecasts with daily pipeline reviews work better.
Step 2: Review your sales pipeline for active and at-risk deals
Before applying any forecast method, you need a clean view of what's actually in play. Run through your pipeline with these questions:
- Which deals have recent activity? A deal with no emails, calls, or meetings in the last two weeks is stalled — regardless of what stage it's in.
- Which deals have moved stages recently? Forward momentum is the best predictor of close. Deals stuck in the same stage for longer than your average cycle time at that stage are at risk.
- Which deals have close dates in the past? Pushed deals that never got updated are common sources of forecast error. Either update the close date or move them to a future period.
- Which deals are missing key qualification criteria? If you use MEDDIC or another methodology, check whether committed deals have identified decision-makers, defined timelines, and validated pain.
Use pipeline metrics like stage conversion rates, average deal velocity, and win rate by segment to benchmark individual deals against historical patterns. A $500k deal at Stage 3 with no champion identified and a close date next week deserves scrutiny — even if the rep calls it a commit.
Step 3: Choose the right sales forecasting method
Different forecasting methods suit different situations. Most mature RevOps teams combine multiple approaches — using historical trends to set baselines, pipeline math to forecast the quarter, and AI to flag risks. Here's how each method works.
Historical forecasting: using past sales data to predict revenue
Historical forecasting uses past performance to project future results. If your team closed $2M per quarter for the last four quarters with 10 reps, and you now have 12 reps, you might project $2.4M — adjusting for seasonality, market conditions, and any changes to your sales motion.
When it works: Stable businesses with consistent sales cycles, established markets, and predictable seasonality. It's a useful sanity check against bottom-up pipeline math.
When it doesn't: New products, new markets, major pricing changes, or significant team turnover break historical patterns. Don't rely on history alone if your go-to-market has changed.
Pipeline forecasting: estimating revenue from active deals
Pipeline forecasting sums the value of deals in your Salesforce pipeline, typically filtered by expected close date. It's the most common method for quarterly forecasts because it's grounded in real opportunities.
The formula: Forecast = Sum of all deal values expected to close in the period
The problem: Pipeline value alone overstates what will actually close. A $10M pipeline doesn't mean $10M in revenue — it means $10M in potential if every deal closed at full value on time. You need probability weighting or AI-based risk scoring to get realistic numbers.
Pipeline forecasting works best when combined with rigorous pipeline management — removing dead deals, validating close dates, and adjusting values based on negotiation signals.
Opportunity stage forecasting: probability-weighted revenue estimates
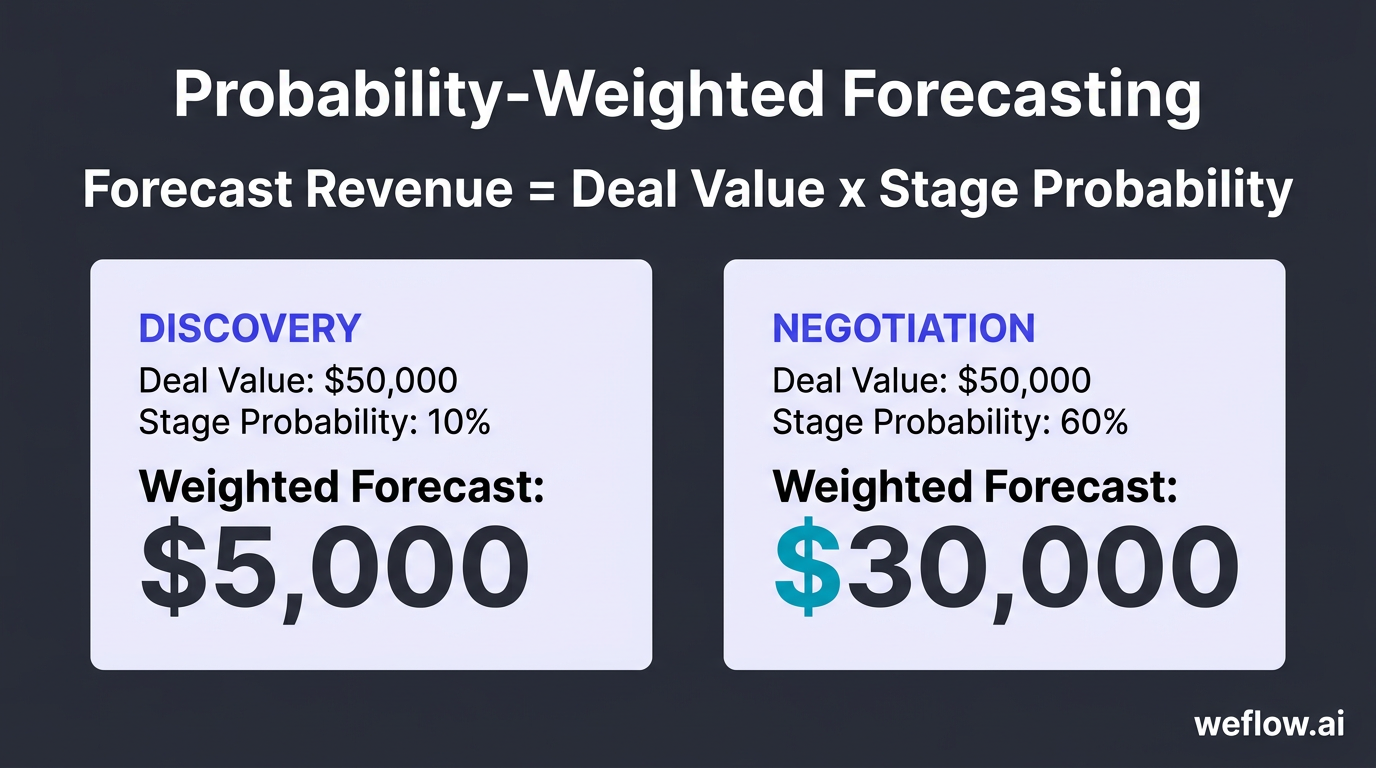
Opportunity stage forecasting assigns a win probability to each stage in your sales process and uses those probabilities to weight deal values. It's the default approach in Salesforce's standard forecasting features.
Formula: Forecast Revenue = Deal Value x Stage Probability
[banner type="download" url="https://www.weflow.ai/content/the-ultimate-sales-forecasting-guide" text="The Ultimate Sales Forecasting Guide" subtitle="Pick the right forecasting method and call your number with confidence" button="Get the guide"]
Example: A $50,000 deal at Discovery (10% probability) contributes $5,000 to the weighted forecast. The same deal at Negotiation (60% probability) contributes $30,000.
Setting stage probabilities: Don't guess. Calculate actual historical conversion rates from each stage to Closed Won over the last 12 months. If 40% of deals that reach Proposal stage eventually close, your Proposal probability should be 40% — not the 75% default many orgs inherited at Salesforce setup.
Limitation: Stage probabilities assume all deals at a stage have equal likelihood of closing. In reality, a $500k deal at Proposal with an engaged champion is more likely to close than a $50k deal at the same stage with no activity in three weeks. AI-based forecasting addresses this by scoring individual deals.
Sales cycle length forecasting: predicting close rates by deal age
Sales cycle length forecasting uses deal age relative to your average cycle time to estimate close likelihood. A deal that's been open for 90 days when your average cycle is 60 days is statistically less likely to close — even if it's at a late stage.
How to use it: Calculate your average sales cycle by segment, deal size, and source. Flag deals that exceed 1.5x the average as at-risk. In your pipeline reviews, ask reps what's different about aged deals — sometimes there's a valid reason (procurement delays, budget timing), but often it's just a deal that should have been disqualified.
Cycle length forecasting works best as a risk indicator layered on top of stage-based probability weighting.
Intuitive forecasting: rep-based judgment estimates
Intuitive forecasting relies on reps to call their own numbers. Reps categorize deals as Commit, Best Case, or Pipeline based on their judgment of what will close.
Why it persists: Reps have context that doesn't show up in CRM fields — buyer sentiment, political dynamics, verbal commitments. A good rep knows when a deal is real before the data confirms it.
Why it fails: Reps are systematically biased. Some sandbag to protect their number; others are optimistic to avoid difficult conversations. Without calibration against historical accuracy, intuitive forecasts are unreliable at the aggregate level.
How to make it work: Track forecast accuracy by rep over multiple quarters. Weight their calls based on their track record. If a rep's commits close at 90%, trust them. If another rep's commits close at 50%, apply a discount. Combine rep judgment with objective stage and activity data.
AI-driven and predictive sales forecasting
AI-driven forecasting uses machine learning to analyze historical patterns — deal attributes, activity levels, stage velocity, engagement signals — and predict close probability for each individual opportunity. It removes the subjectivity of rep calls and the over-simplification of stage-based probabilities.
What AI forecasting does differently:
- Scores each deal individually based on dozens of signals, not just stage
- Identifies at-risk deals before they slip — based on patterns like declining activity, longer-than-average time in stage, or missing key contacts
- Updates predictions continuously as new data comes in, rather than waiting for weekly forecast calls
- Removes rep bias by weighting objective signals over subjective confidence calls
When to use it: AI forecasting delivers the most value when you have 12+ months of closed deal data in Salesforce, consistent use of stages and fields, and enough volume for the model to identify patterns. It's not magic — it's pattern recognition at scale. Garbage data in means garbage predictions out.
Top-down vs. bottom-up forecasting: which approach is right?
Top-down and bottom-up forecasting are complementary approaches that answer different questions.
Top-down forecasting starts with market size, growth rates, and revenue targets, then allocates numbers down to teams and reps. It answers: "What do we need to hit to meet our plan?" It's useful for annual planning, board-level targets, and capacity models.
Bottom-up forecasting starts with individual deals in the pipeline and rolls up to a team and company number. It answers: "Based on what's in play right now, what will we actually close?" It's useful for quarterly execution, commit accuracy, and identifying gaps.
The gap between them is the forecast risk. If bottom-up shows $8M and top-down requires $10M, you have a $2M gap to close through pipeline generation, win rate improvement, or deal acceleration. Mature RevOps teams run both methods and use the variance to drive action.
Sales forecasting tools and technologies
Your forecasting tool stack depends on your team size, Salesforce complexity, and how much you're willing to invest. Here's what's available:
[banner type="download" url="https://www.weflow.ai/content/sales-forecasting-cheat-sheet" text="Sales Forecasting Cheat Sheet" subtitle="Tighten cadence, CRM hygiene, and roll-ups without rebuilding your stack" button="Get it free"]
CRM platforms (Salesforce) — Salesforce includes built-in forecasting features: forecast categories, roll-ups by hierarchy, and opportunity-based reports. For many teams, native forecasting plus dashboards is enough to get started. The limitation is flexibility — Salesforce forecasting requires significant customization to support scenario modeling, waterfall tracking, or AI predictions.
Dedicated forecasting platforms (Weflow) — Purpose-built forecasting tools integrate with Salesforce and add capabilities that native features lack: collaborative forecast submissions, change tracking over time (waterfall reports), AI-based deal scoring, and scenario modeling. Weflow, a Salesforce-native revenue AI platform, is designed for RevOps teams who need accurate forecasts without pulling data into spreadsheets.
BI and analytics tools — Tools like Tableau, Looker, or Power BI let you build custom forecast dashboards pulling from Salesforce and other data sources. They're flexible but require technical resources to maintain. Most useful for organizations with dedicated analytics teams who want to combine forecast data with finance, marketing, and product data.
AI and predictive analytics — Machine learning tools analyze historical deal data to predict close probability and identify risk. Some forecasting platforms (including Weflow) include built-in AI; others require separate tools or Salesforce Einstein add-ons. The value is objective deal scoring that doesn't rely on rep judgment.
Spreadsheets — Still the default for many teams. Spreadsheets are flexible and familiar, but they break at scale: version control problems, disconnection from live Salesforce data, manual roll-up errors, and no audit trail. Use spreadsheets for ad-hoc analysis, not as your forecast system of record.
Internal and external factors that affect forecast accuracy
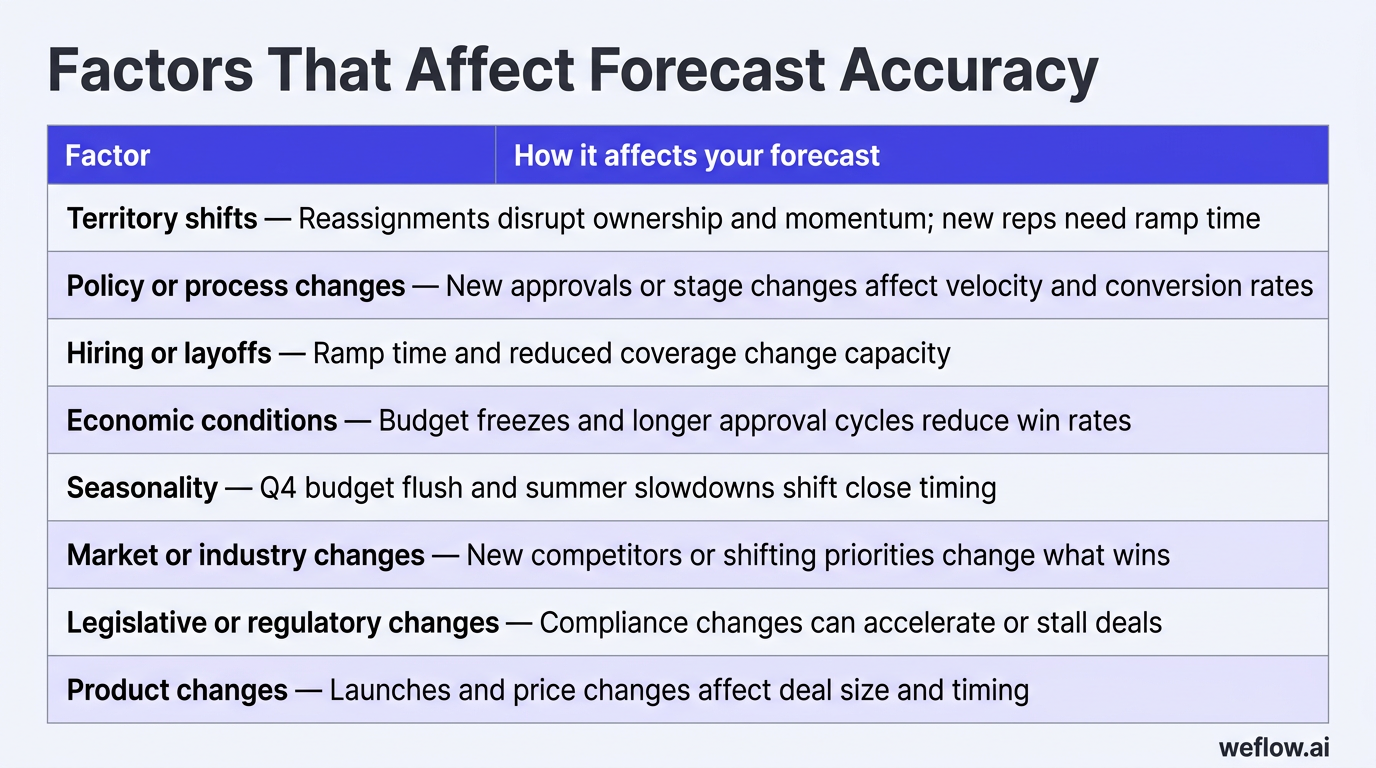
Even with clean data and the right methods, your forecast is only as good as your understanding of what's changing. Here are the factors that cause forecasts to miss:
| Factor | How it affects your forecast |
|---|---|
| Territory shifts | Reassigning accounts mid-quarter disrupts deal ownership and momentum. New reps need ramp time; deals in transition often stall. Adjust expectations for affected territories. |
| Policy or process changes | New discount approval requirements, changed qualification criteria, or updated sales stages affect deal velocity and conversion rates. Historical benchmarks may not apply after major process changes. |
| Hiring or layoffs | New reps take 3-6 months to ramp. Layoffs shift accounts and reduce coverage. Factor in rep productivity curves and capacity changes when forecasting. |
| Economic conditions | Budget freezes, longer approval cycles, and increased deal scrutiny during downturns extend sales cycles and reduce win rates. Watch for signals in your pipeline: deals stuck in procurement, requests for extended payment terms. |
| Seasonality | Q4 budget flush, summer slowdowns, fiscal year-end buying patterns — all affect when deals close. Use historical data to identify your seasonal patterns and adjust targets accordingly. |
| Market or industry changes | New competitors, category disruption, or shifts in buyer priorities change what wins. If your win rate suddenly drops, look for market-level explanations beyond individual deal execution. |
| Legislative or regulatory changes | New compliance requirements can accelerate deals (companies need to buy now) or stall them (buyers waiting for clarity). Industry-specific regulations affect deal timing in healthcare, financial services, and government. |
| Product changes | New product launches create demand but also deal delays as buyers wait for features. Price changes affect deal size and velocity. Major releases can shift pipeline from one quarter to the next. |
Frequently asked questions about sales forecasting
What is the most accurate sales forecasting method?
AI-driven forecasting that scores individual deals based on activity signals, stage velocity, and historical patterns delivers the highest accuracy for most B2B sales teams. It removes rep bias and adapts to your specific conversion patterns. That said, no method works without clean Salesforce data — the best approach combines AI predictions with structured pipeline reviews to catch what algorithms miss.
How often should you update a sales forecast?
Weekly for operational forecasts, with daily monitoring for at-risk deals. Most B2B SaaS organizations run weekly forecast calls where reps update commit categories and managers review pipeline changes. The forecast in Salesforce should reflect reality at all times — not just get updated before the weekly meeting.
What is the difference between a sales forecast and a sales quota?
A quota is a target — what you're expected to close. A forecast is a prediction — what you expect to actually close based on current pipeline data. Quotas are set at the start of a period and don't change. Forecasts update continuously as deals progress, stall, or close. The gap between forecast and quota tells you whether you'll hit your number.
How do you forecast sales for a new product with no historical data?
Use analogous data and conservative assumptions. Look at conversion rates and cycle lengths from similar products you've launched. Talk to early pipeline prospects about their timeline and decision process. Start with a bottom-up forecast based on identified opportunities, apply a discount for uncertainty, and adjust weekly as you gather real data. Expect high variance until you have two to three quarters of closed deals.
What causes sales forecasts to be inaccurate?
The most common causes are poor CRM data quality (missing or outdated deal information), rep bias (over-optimism or sandbagging), lack of clear qualification criteria (deals counted that shouldn't be in pipeline), and ignoring external factors (economic conditions, competitive losses, internal changes). Most forecast errors trace back to deals that should have been flagged as at-risk earlier.
Who is responsible for the sales forecast in an organization?
Sales leadership owns the forecast number — typically the VP of Sales or CRO — but RevOps owns the process and data integrity. Frontline managers are responsible for their team's forecast accuracy. Reps are responsible for keeping their deals updated and calling commits honestly. Finance relies on the forecast for planning. It's a shared accountability with different roles at each level.
How can AI improve sales forecasting accuracy?
AI analyzes patterns across thousands of historical deals to identify which signals actually predict close — activity levels, stakeholder engagement, stage velocity, deal attributes. It scores each opportunity individually rather than applying blanket stage probabilities, and it updates predictions continuously as new data arrives. The result is earlier identification of at-risk deals and more accurate aggregate forecasts that don't depend on rep judgment.
What tools do you need for sales forecasting?
At minimum, you need Salesforce with clean opportunity data, defined stages, and consistent field usage. Beyond that, most RevOps teams add a dedicated forecasting tool for collaborative submissions, change tracking, and reporting that Salesforce's native features don't provide. AI-based deal scoring helps at scale. The specific tools matter less than having a single source of truth connected to your CRM.
Improve your sales forecasting in 2026 with Weflow
Weflow, a Salesforce-native revenue AI platform, gives RevOps teams everything they need to forecast with confidence — without spreadsheets, manual data entry, or disconnected tools.
What Weflow delivers for forecasting:
- Submit, review, and track forecast changes — reps and managers update forecasts in a purpose-built interface, with full change history visible
- Automatic Salesforce sync — every forecast update writes back to Salesforce in real time, keeping your CRM as the single source of truth
- Collaborative forecasting — managers can adjust rep calls, add notes, and roll up forecasts by team, segment, or region
- Waterfall tracking — see how your forecast changed week-over-week, where deals slipped, and what got added
- Quarterly predictions — AI-based forecasting that scores deals individually and surfaces risk before it shows up in your commit
Combined with Weflow's automated activity capture and pipeline inspection, you get the complete picture of what's happening in your pipeline — not just what reps remember to log.


.png)


