Sales Forecasting: Why It Matters and How to Get Started
Learn why sales forecasting matters and how to build your first forecast from pipeline data.



What is sales forecasting?
Sales forecasting is the process of estimating future revenue based on pipeline data, historical performance, and market conditions. It gives revenue leaders a forward-looking view of what's likely to close in a given period—whether that's next month, next quarter, or next fiscal year. A reliable forecast is the foundation for nearly every major business decision, from headcount planning to board reporting.
Unlike simple pipeline reporting, which shows what's currently in play, forecasting applies probability, deal velocity, and rep-level patterns to predict actual outcomes. The goal isn't to know exactly what will close—it's to narrow the range of uncertainty enough to make confident decisions.
For RevOps leaders and CROs, accurate forecasting translates directly to credibility. When you can tell the board you'll land at $4.2M plus or minus 5%, you've earned trust that compounds over time. When you miss by 30%, you've lost the room—and often the budget for the next initiative.
What role does sales forecasting play in revenue prediction?
Forecasting is how finance, sales, and operations agree on a single number to plan around. Without it, each team operates on different assumptions—finance budgets based on last year's actuals, sales commits based on gut feel, and ops plans based on pipeline snapshots that are already stale.
A shared forecast creates alignment. It tells finance how much cash to expect and when. It tells ops how many customers to onboard. It tells leadership whether the quarter is on track or requires intervention. This shared visibility is what turns a sales organization from reactive to predictable.
The cadence matters too. Weekly forecast reviews during active quarters surface deal risk early enough to act. Monthly or quarterly reviews during planning periods set the targets everyone works toward. The forecast becomes the operating rhythm that keeps revenue teams coordinated across functions and time zones.
How sales forecasting enables data-driven business decisions
Revenue forecasts inform decisions that span every function. Here are the specific choices a reliable forecast supports:
- Product launch timing: If you're planning a new SKU launch, the forecast tells you whether there's enough pipeline capacity to absorb additional complexity—or if reps are already at quota pressure and can't take on a new pitch.
- Market expansion: Before entering a new region or segment, the forecast shows how much revenue is already committed elsewhere. That clarifies whether expansion is additive or a distraction from existing targets.
- Headcount planning: Hiring plans depend on revenue projections. A reliable forecast tells you whether you can afford three more AEs next quarter—or whether you should hold until the pipeline catches up.
- Budget reallocation: Marketing spend, CS investments, and infrastructure upgrades all compete for dollars. The forecast tells you which bets have runway and which are underfunded relative to the opportunity.
- Inventory and fulfillment: For companies selling physical products, forecast accuracy determines how much to manufacture and where to warehouse it. A 20% forecast miss can mean either empty shelves or excess inventory write-downs.
- Investor and board communication: Quarterly board meetings require a defensible revenue projection. A forecast built on pipeline data—not just gut feel—lets you present numbers you can stand behind.
How sales forecasts improve resource allocation across teams
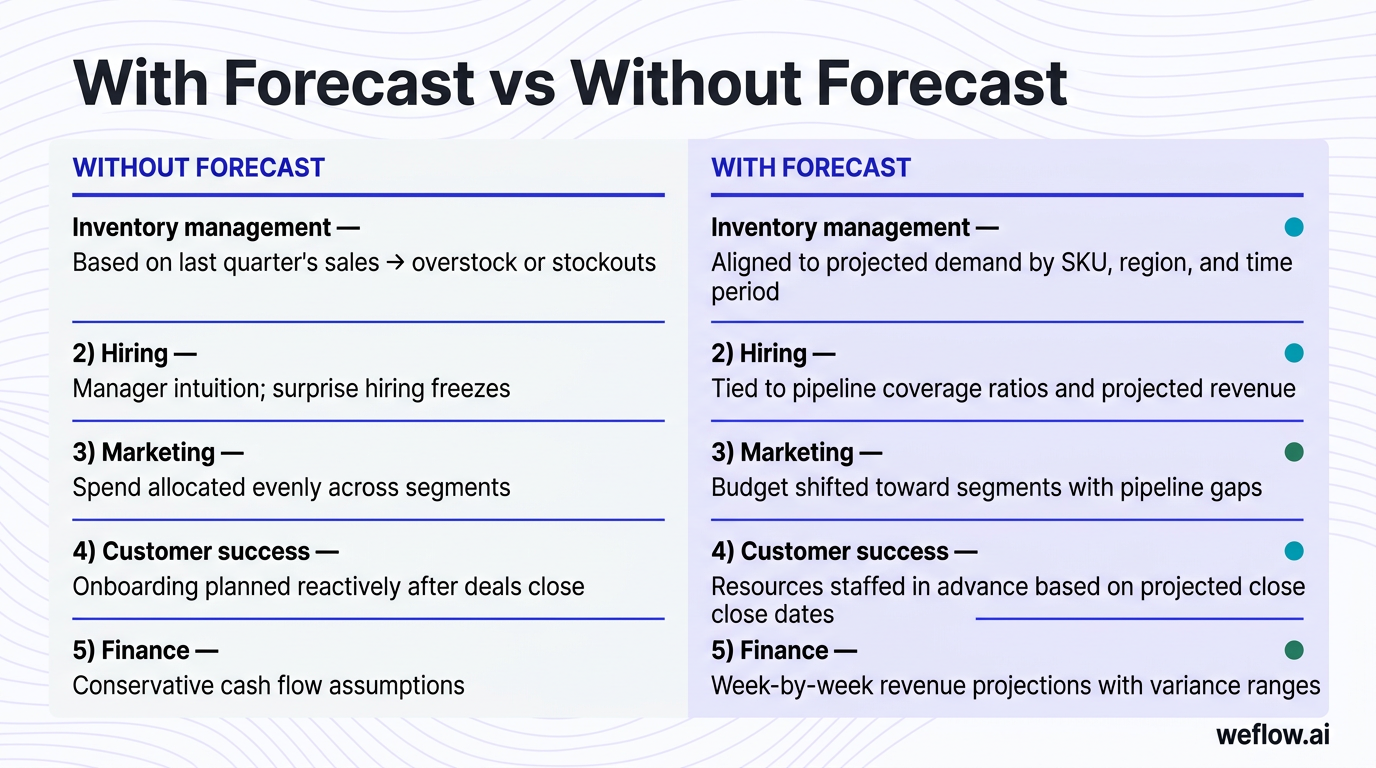
Forecasts don't just predict revenue—they tell you where to deploy resources before it's too late to act. Here's how different functions operate with and without forecast visibility:
| Area | Without forecast | With forecast |
|---|---|---|
| Inventory management | Production and procurement decisions based on last quarter's sales, leading to overstock or stockouts | Inventory levels aligned to projected demand by SKU, region, and time period—reducing both waste and lost sales |
| Hiring | Headcount requests made based on manager intuition; hiring freezes triggered by surprise misses | Hiring plans tied to pipeline coverage ratios and projected revenue, with hiring velocity adjusted by forecast confidence |
| Marketing | Campaign spend allocated evenly across segments regardless of pipeline health | Budget shifted toward segments with pipeline gaps and away from segments already at or above target |
| Customer success | Onboarding capacity planned reactively after deals close, causing delays and churn risk | Onboarding resources staffed in advance based on projected close dates and deal sizes |
| Finance | Cash flow projections based on conservative assumptions, leading to missed investment opportunities | Working capital decisions informed by week-by-week revenue projections with variance ranges |
How accurate forecasts help set realistic sales quotas and goals
Quota-setting is where many sales organizations fail—not because leaders set the wrong number, but because they set it without data. Forecasting changes that.
Setting realistic quotas
A forecast grounded in historical performance and current pipeline gives you the baseline for achievable targets. If your average AE closes $80K per quarter with a 25% win rate, asking them to close $150K without expanding territory or pipeline is a plan for failure. Forecasting surfaces this gap before the quarter starts, not after.
Improving morale
Reps who miss quota repeatedly—not because of effort, but because of unrealistic targets—disengage. Achievable quotas built from real pipeline data keep reps in the game. A team that sees 80% of reps hitting quota is more productive than a team where only 40% ever get close.
Aligning organizational objectives
Company-level revenue targets flow down to team quotas, which roll up into the board number. If these aren't aligned, someone gets caught holding the bag. Forecasting provides the denominator: "We need $12M in Q3. Based on pipeline coverage and historical conversion, here's how that breaks down by team."
Evaluating performance
Without a forecast baseline, quota attainment is just a number. With it, you can distinguish between a rep who hit 100% on an easy territory and a rep who hit 90% against a stretch target. Forecast variance becomes a coaching input, not just a judgment.
[banner type="download" url="https://www.weflow.ai/resources/cheat-sheets/the-ultimate-sales-forecasting-guide" text="The Ultimate Sales Forecasting Guide" subtitle="Stand up a forecasting process you can defend in front of the board" button="Get the guide"]
Using sales forecasts to plan for scalable business growth
Growth requires capital, and capital requires confidence. Investors, lenders, and board members don't fund hope—they fund projections they can defend in a model. Sales forecasts provide that foundation.
Identifying new opportunities
A reliable forecast shows you where there's whitespace. If one region is overperforming relative to headcount while another is underperforming, the forecast tells you where to double down. The same logic applies to product lines, customer segments, and partner channels.
Guiding investment decisions
Should you invest in a new product line? Expand the SDR team? Open an EMEA office? Each of these decisions requires a revenue projection to justify the spend. A forecast built on pipeline data—not a spreadsheet someone back-solved—lets you make these calls with confidence.
Managing risk
Forecasts aren't just about upside. They also flag downside scenarios. If pipeline coverage drops below 3x, you know you're in trouble before the quarter ends. If average deal cycle lengthens, you adjust expectations before the board meeting. Forecasting turns surprises into known risks you can mitigate.
How sales forecasting drives team motivation and performance
Vague targets produce vague effort. "Close more deals" isn't a goal—it's a slogan. "Increase closed-won revenue by 10% this quarter" is a goal. Forecasting makes this specificity possible.
When reps understand the math behind their quota—pipeline coverage requirements, expected conversion rates, average deal size—they can reverse-engineer the activity needed to hit it. This clarity shifts the conversation from "are you going to hit your number?" to "what's blocking this deal from closing by week 6?"
Managers benefit too. A forecast-driven operating cadence surfaces at-risk deals early, creates natural coaching moments, and gives managers the data they need to intervene before it's too late. Instead of end-of-quarter surprises, you get weekly calibration against a shared target.
Key metrics used in sales forecasting
Accurate forecasts depend on accurate inputs. Here are the metrics that drive reliable sales forecasting accuracy:
- Pipeline coverage ratio: Total pipeline divided by quota. A ratio of 3x means you have $3 in pipeline for every $1 you need to close. Most teams need 3–4x coverage to hit target with normal conversion rates.
- Lead-to-opportunity conversion rate: The percentage of leads that become qualified opportunities. This tells you how much top-of-funnel activity you need to generate enough pipeline.
- Average deal size: The mean revenue per closed-won opportunity. Changes in average deal size affect how many deals you need to hit a given number.
- Sales cycle length: Days from opportunity creation to close. A lengthening sales cycle means deals won't close when expected—and your forecast will be optimistic.
- Win rate by stage: The probability of closing a deal given its current stage. A deal in Stage 4 with a 60% historical win rate contributes more to the forecast than a Stage 2 deal with a 15% win rate.
- Seasonality: Revenue patterns that repeat annually—Q4 spikes, summer slowdowns, fiscal year-end buying cycles. Ignoring seasonality makes quarterly forecasts inaccurate by design.
Sales forecasting methods: which one should you use?
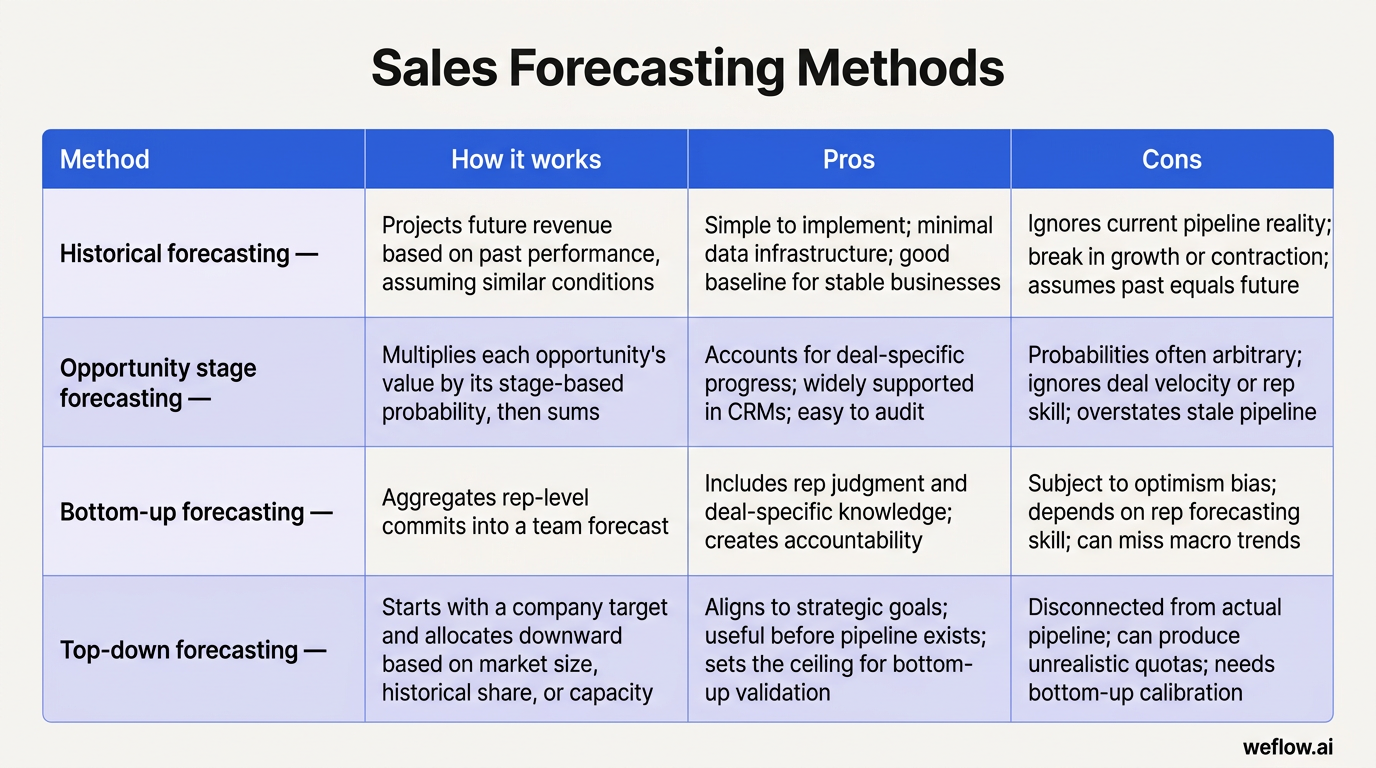
Different sales forecasting methods fit different situations. Here's a comparison of the most common approaches:
| Method | How it works | Pros | Cons |
|---|---|---|---|
| Historical forecasting | Projects future revenue based on past performance, assuming similar conditions | Simple to implement; requires minimal data infrastructure; good baseline for stable businesses | Ignores current pipeline reality; breaks down in growth or contraction scenarios; assumes past equals future |
| Opportunity stage forecasting | Multiplies each opportunity's value by its stage-based probability, then sums | Accounts for deal-specific progress; widely supported in Salesforce and other CRMs; easy to audit | Probabilities are often arbitrary; doesn't account for deal velocity or rep skill; overstates stale pipeline |
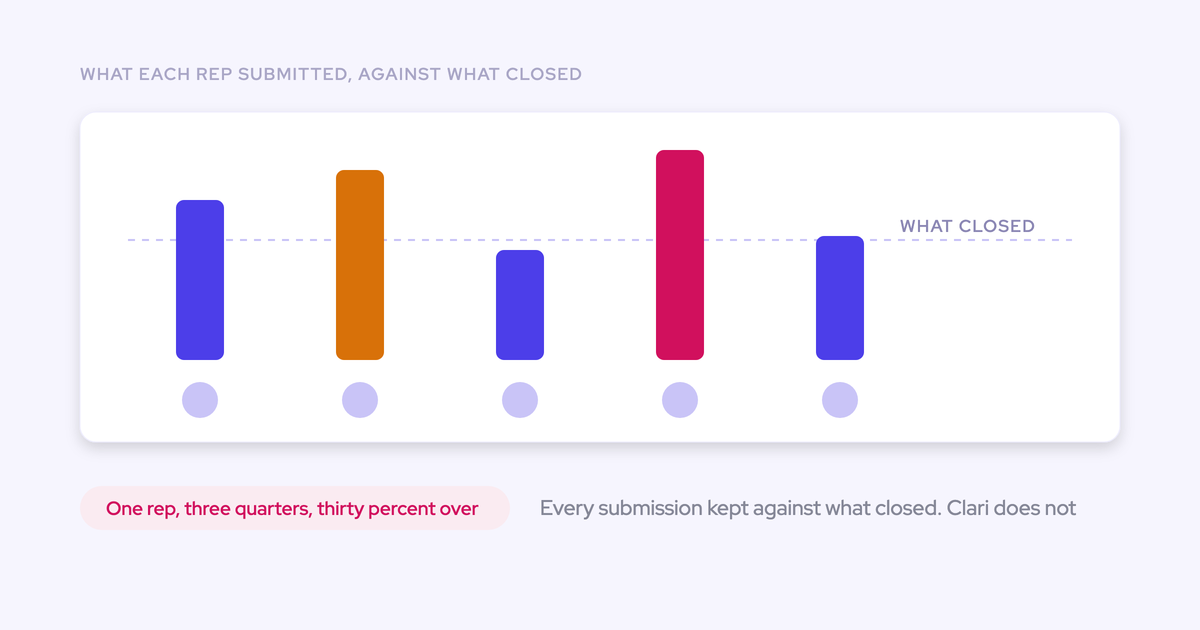
| Bottom-up forecasting | Aggregates rep-level commits into a team forecast | Incorporates rep judgment and deal-specific knowledge; creates accountability at the individual level | Subject to optimism bias; dependent on rep forecasting skill; can miss macro trends visible only at aggregate level |
| Top-down forecasting | Starts with a company target and allocates downward based on market size, historical share, or capacity | Aligns to strategic goals; useful for planning before pipeline exists; sets the ceiling for bottom-up validation | Disconnected from actual pipeline; can produce unrealistic quotas; requires bottom-up calibration to be useful |
Most mature RevOps teams combine methods—using top-down to set targets, opportunity stage to monitor progress, and bottom-up commits to calibrate confidence. The right method depends on your data maturity, pipeline volume, and tolerance for rep-level judgment.
How to create your first sales forecast: a step-by-step guide
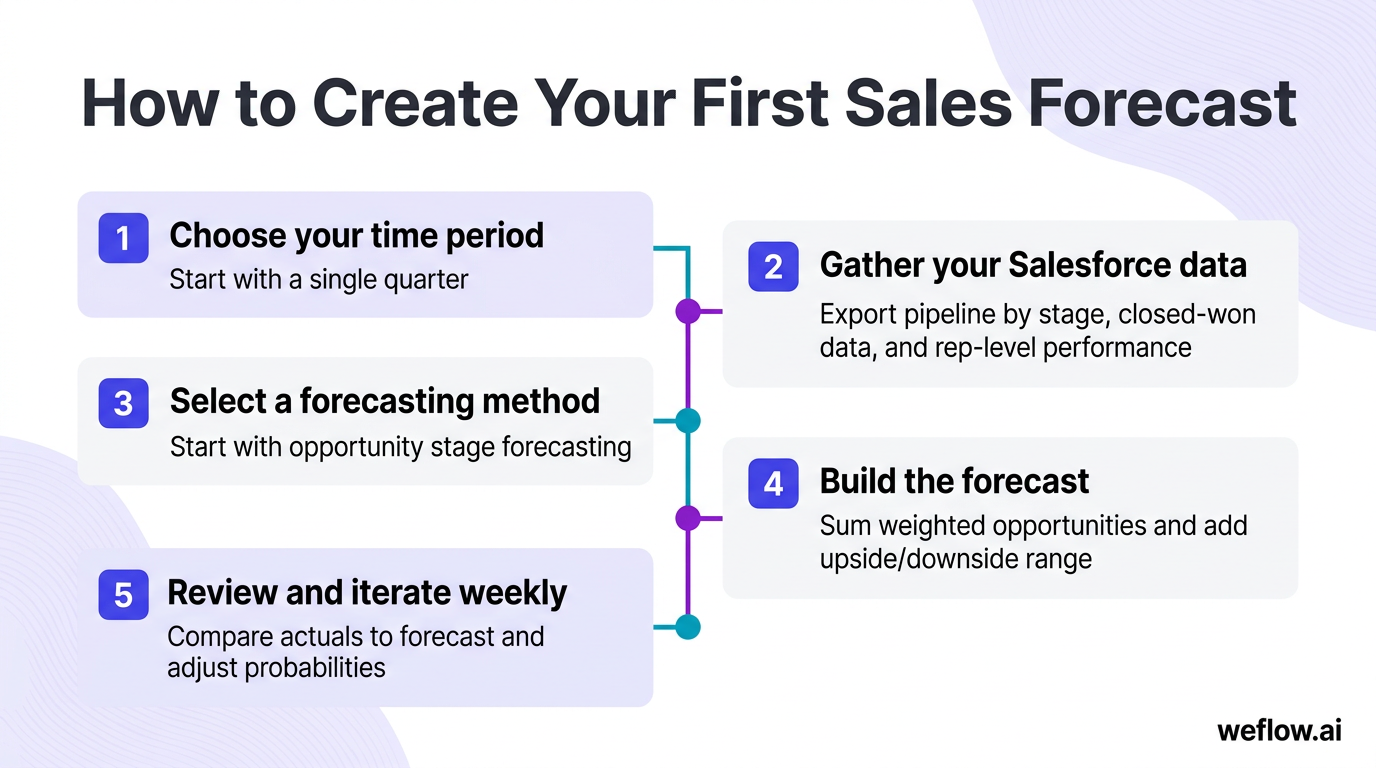
Building a forecast doesn't require a data science team. Here's how to get started:
[banner type="download" url="https://www.weflow.ai/resources/cheat-sheets/sales-forecasting-cheat-sheet" text="Sales Forecasting Cheat Sheet" subtitle="Fix the rep optimism and stale pipeline that wreck your forecast every quarter" button="Get it free"]
- Choose your time period. Start with a single quarter. This gives you enough time for deals to progress but not so much that uncertainty overwhelms the projection. Once you've run a few quarterly cycles, you can extend to annual planning.
- Gather your Salesforce data. Export current pipeline by stage, historical closed-won data, and rep-level performance. You'll need opportunity amounts, close dates, stages, and owner. If your Salesforce data is incomplete, your forecast will inherit those gaps—so data quality work happens here.
- Select a forecasting method. For your first forecast, opportunity stage forecasting is the most accessible. Assign a probability to each stage based on historical win rates, then multiply each deal's value by its probability. This gives you a weighted pipeline value.
- Build the forecast. Sum your weighted opportunities to get an expected value. Layer in rep commits if available. Adjust for deals that are stalled or have unrealistic close dates. Add a range: your base case is the weighted sum; upside includes deals that could accelerate; downside discounts deals with risk signals.
- Review and iterate weekly. A forecast isn't a one-time exercise—it's a living document. Each week, compare actuals to forecast, investigate variances, and adjust probabilities as deals progress. Over time, your stage probabilities will calibrate to reality, and your forecasts will tighten.
How AI is changing sales forecasting
AI-powered forecasting tools are shifting the work from manual pipeline inspection to automated pattern recognition. Instead of RevOps leaders spending hours reviewing each deal, AI models analyze pipeline signals—email velocity, meeting frequency, stakeholder engagement, stage duration—and flag deals that are likely to slip or close early.
This changes what forecasting feels like. Rather than trusting rep judgment alone, leaders get a model-based view of deal risk. When a rep says a $200K deal will close this quarter but the AI sees declining engagement and no executive involvement, that's a coaching conversation waiting to happen.
AI also reduces the manual input burden. Activity capture tools pull data from email, calendar, and calls—populating Salesforce without rep effort. This solves the garbage-in problem that plagues most forecasts: if your pipeline data is stale or incomplete, your forecast is fiction. AI-powered CRM tools close that gap by keeping activity data current automatically.
Common sales forecasting challenges and how to solve them
Even well-designed forecasting processes break down. Here are the most common failure modes and how to address them:
| Challenge | Solution |
|---|---|
| Forecasting is time-consuming | Automate data collection and pipeline inspection. Tools that sync activity data to Salesforce in real time eliminate the weekly scramble to update fields before forecast calls. |
| Salesforce data is inaccurate or incomplete | The root cause is usually manual entry. Use automated data capture to populate activity, contacts, and deal fields without rep effort. Weflow, a Salesforce-native revenue AI platform, addresses this directly—capturing emails, meetings, and calls and writing them to Salesforce automatically, giving you activity completeness above 95%. |
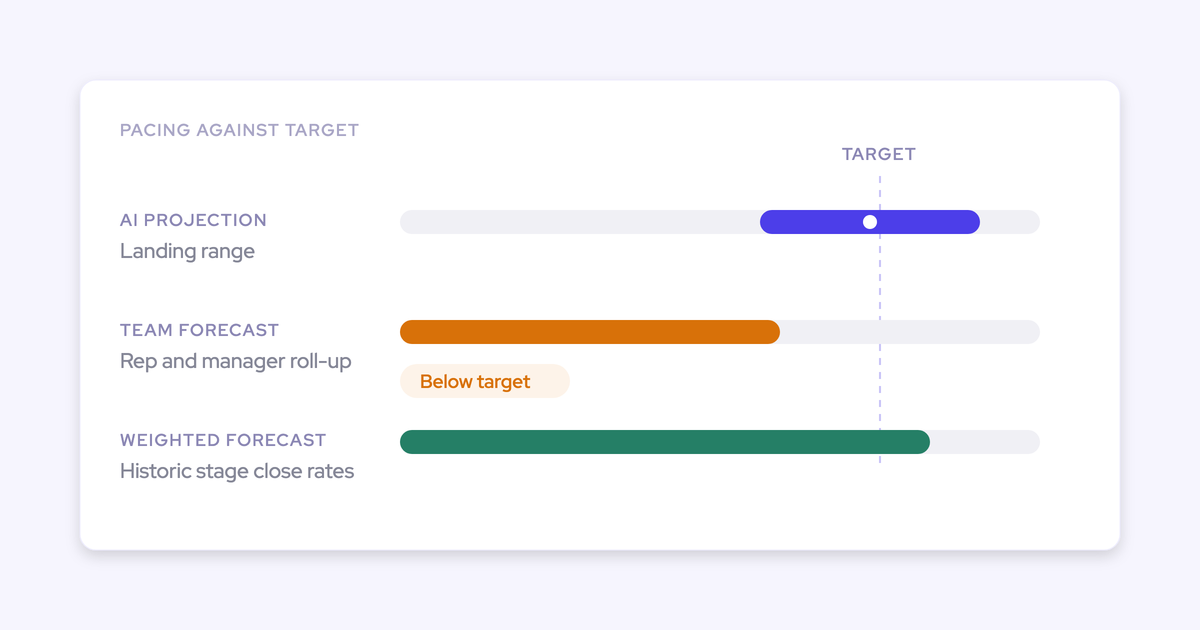
| Reps are overly optimistic | Apply historical win rates by stage instead of relying on rep judgment alone. AI-powered deal scoring can flag high-risk deals that reps have marked as likely to close. Weflow's collaborative forecasting shows managers a side-by-side view of rep commits versus model predictions, surfacing gaps before they become surprises. |
| Low adoption of forecasting tools | Make forecasting part of the weekly operating rhythm, not a separate exercise. Tools that integrate directly into Salesforce—where reps and managers already work—see higher adoption than standalone platforms. Weflow's forecast waterfalls and quarterly predictions live inside Salesforce, requiring no context-switching. |
| No visibility into deal progression | Pipeline inspection tools surface stalled deals, missing stakeholders, and stage duration anomalies. This gives managers the specifics they need for coaching conversations instead of generic "where are you at?" check-ins. |
Frequently asked questions
What is sales forecasting?
Sales forecasting is the process of estimating future revenue based on historical data, pipeline activity, and market conditions. It turns the question "how much will we close?" into a range you can plan around, rather than a guess.
Why is sales forecasting important for business growth?
Forecasts give leadership the confidence to invest—in headcount, new markets, product development, and infrastructure. Without a reliable forecast, growth initiatives stall because no one can defend the spend.
What are the most common sales forecasting methods?
The four primary methods are historical forecasting, opportunity stage forecasting, bottom-up forecasting, and top-down forecasting. Most mature teams combine multiple methods to set targets, monitor progress, and calibrate confidence.
How often should you update a sales forecast?
Update weekly during active quarters—this catches deal slippage early enough to act. During planning periods, monthly reviews are sufficient for setting and adjusting targets.
What metrics should you track for accurate sales forecasting?
Focus on pipeline coverage ratio, lead-to-opportunity conversion rate, average deal size, sales cycle length, and win rate by stage. Seasonality matters too—ignoring annual patterns produces systematic forecast errors.
How does AI improve sales forecasting accuracy?
AI analyzes patterns across deals—engagement velocity, stakeholder involvement, stage duration—and flags at-risk opportunities before they slip. It also reduces manual data entry by capturing activity automatically, which solves the garbage-in problem that undermines most forecasts.
What is the difference between sales forecasting and pipeline management?
Pipeline management is about tracking and advancing deals—keeping Salesforce current, moving opportunities through stages, and coaching reps on specific accounts. Forecasting predicts revenue outcomes from that pipeline. One is operational; the other is analytical.
How can small sales teams get started with forecasting?
Start with a spreadsheet. Export your Salesforce opportunities, assign stage-based probabilities, and calculate a weighted pipeline value. As your pipeline grows and accuracy matters more, move to a CRM-native forecasting tool that automates the math and keeps data current.