Predictive Sales Forecasting: How It Works and How to Implement It
Learn how predictive sales forecasting works and how to implement it in Salesforce.



What is predictive sales forecasting and how does it work?
Predictive sales forecasting uses statistical models and machine learning to estimate future revenue based on historical deal data, real-time pipeline signals, and rep activity patterns. Instead of asking reps to manually call their number, the model calculates a probability-weighted revenue projection automatically—and updates it continuously as new data flows into Salesforce.
The inputs fall into three categories:
- CRM deal data: Opportunity stage, deal size, close date, days in stage, forecast category, account history, and previous win/loss patterns stored in Salesforce.
- Activity signals: Email and meeting volume, call frequency, recency of last contact, number of stakeholders engaged, and whether key steps (like demos or business case reviews) have happened.
- Market and contextual data: Seasonality, industry vertical, rep tenure, segment-level close rate history, and quota attainment trends.
The outputs are concrete and deal-specific:
- Deal-level probability scores: A percentage likelihood that a given opportunity will close in the target period.
- Predicted close dates: A model-adjusted close date based on stage velocity and historical patterns—separate from whatever date a rep entered in Salesforce.
- Aggregate revenue projections: A bottom-up forecast built from probability-weighted deals, rolled up by rep, team, segment, or region.
How predictive models calculate deal probability
Most predictive forecasting models use one of two approaches: logistic regression (for binary win/loss classification) or gradient boosted decision trees (for probability scoring across many variables simultaneously). In practice, commercial platforms blend both.
Here’s how the scoring mechanics work:
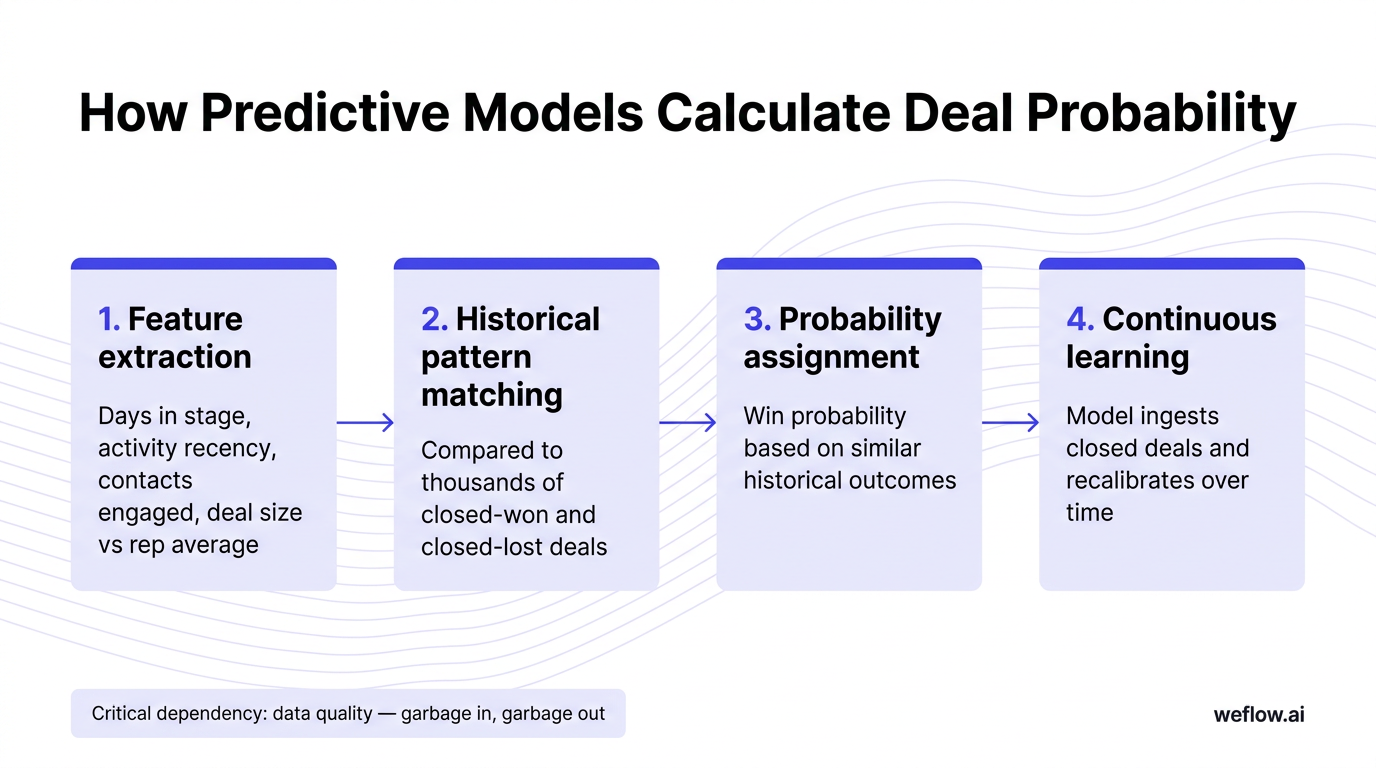
- Feature extraction: The model pulls dozens of variables from each Salesforce opportunity—days in current stage, activity recency, number of contacts on the account, deal size relative to rep average, and more.
- Historical pattern matching: The model compares the current deal’s feature set against thousands of closed-won and closed-lost deals to find the closest statistical matches.
- Probability assignment: Based on how similar deals resolved historically, the model assigns a win probability. A deal that looks like 78% of your closed-won deals gets a high score. One that mirrors your lost patterns gets flagged.
- Continuous learning: Every time a deal closes (won or lost), the model ingests the outcome and recalibrates its weights. The model gets more accurate over time—provided Salesforce data stays complete and up to date.
The critical dependency here is data quality. A model trained on incomplete Salesforce records—missing activity data, stale close dates, no contact engagement history—will produce unreliable scores. Garbage in, garbage out applies directly.
Traditional vs. predictive sales forecasting: key differences
| Dimension | Traditional forecasting | Predictive forecasting |
|---|---|---|
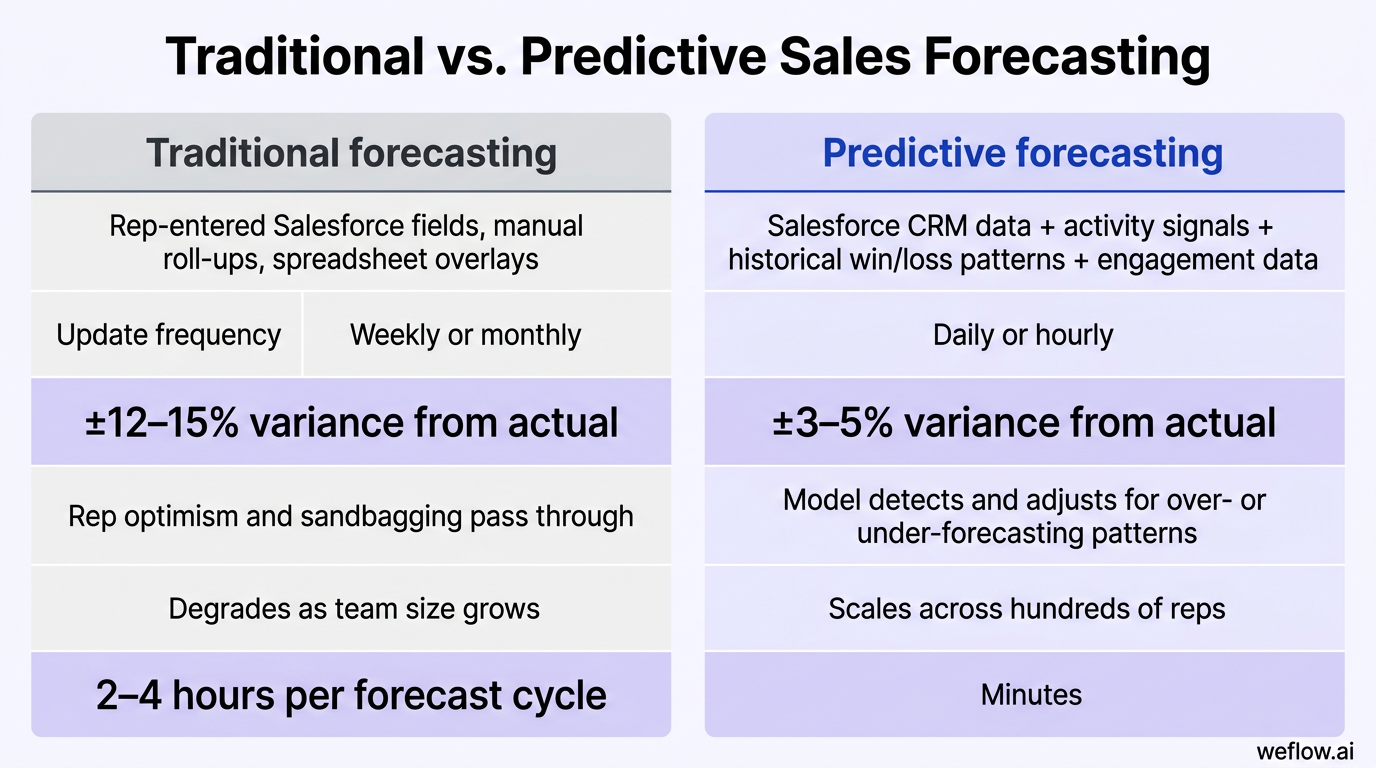
| Data sources | Rep-entered Salesforce fields, manual roll-ups, spreadsheet overlays | Salesforce CRM data + activity signals + historical win/loss patterns + engagement data |
| Update frequency | Weekly or monthly, tied to forecast review cadence | Daily or hourly, continuously recalculated as new data arrives |
| Accuracy range | ±12–15% variance from actual | ±3–5% variance from actual in mature deployments |
| Bias handling | No correction—rep optimism and sandbagging pass through to the forecast | Model detects and adjusts for systematic over- or under-forecasting patterns |
| Scalability | Degrades as team size grows; manager time per deal review doesn’t scale | Scales across hundreds of reps without additional review overhead |
| Time to generate | 2–4 hours of manager time per forecast cycle | Minutes—the model runs automatically, managers review exceptions |
The accuracy gap between these two approaches isn’t trivial. A ±15% error on a $10M quarterly forecast means you’re potentially off by $1.5M in either direction. That’s the difference between hitting plan and missing it—and between a board that trusts your numbers and one that doesn’t.
The bigger structural difference is where the error comes from. Traditional forecasts fail because they inherit rep bias—reps shade their numbers high to manage expectations, or low to sandbag. Predictive models don’t take reps at their word. They look at what’s actually happening in Salesforce: how often the champion responds, how long a deal has sat in a given stage, whether a business case has been shared. The model doesn’t care what the rep put in the forecast category.
Predictive analytics vs. AI sales forecasting: what’s the difference?
Predictive analytics is the broader discipline. It covers any method that uses historical data and statistical models to estimate future outcomes—including regression analysis, time series models, and decision trees. You’re using predictive analytics any time you project next quarter’s revenue based on pipeline trends, even in a spreadsheet.
AI sales forecasting is a subset of predictive analytics that specifically uses machine learning models—algorithms that continuously learn from new data and improve their predictions over time without being manually retrained. The difference that matters in practice: a static regression model built in Q1 uses Q1’s patterns to predict Q4. An ML model ingests every deal that closes through Q3 and adjusts its weights accordingly.
For RevOps leaders, the distinction matters when evaluating tools. Some vendors market “AI forecasting” but are running fixed statistical models that were trained once and don’t adapt. True ML-based forecasting recalibrates as your business changes—new reps ramp, product mix shifts, market conditions evolve. Ask vendors specifically: how often does the model retrain, and on what data?
5 benefits of predictive sales forecasting for B2B teams
1. Higher forecast accuracy
Predictive models consistently achieve ±3–5% variance from actual revenue in mature deployments, compared to ±12–15% for rep-submitted, manager-reviewed traditional forecasts. That accuracy improvement comes from two sources: the model uses more signals than any rep or manager can manually review, and it removes the systematic bias that flows through manual submissions.
For a $50M ARR business forecasting a $12M quarter, closing the accuracy gap from ±15% to ±5% means the difference between $10.2M–$13.8M uncertainty range and $11.4M–$12.6M. Finance can plan headcount and spend with the tighter range. They can’t with the wider one.
2. Faster automated insights
Traditional forecast cycles produce a number once a week or once a month, after a manager has manually reviewed each rep’s pipeline. Predictive models run continuously—updating deal scores daily or hourly as new activity flows into Salesforce.
That matters most mid-quarter. When a deal that looked like a strong commit stalls—no emails in two weeks, champion goes dark, no meeting booked—a predictive model flags it before the weekly call. Managers don’t have to catch it during deal review. The system catches it first.
3. Better risk management
Predictive models excel at early detection of deals that are drifting toward loss. A deal sitting in Proposal for 45+ days with no recent activity and only one stakeholder engaged looks statistically distinct from one that closed at similar stage velocity. The model scores it lower, surfaces it to the manager, and gives RevOps leaders an accurate view of at-risk commits before the quarter-end scramble.
This also helps with forecast category discipline. When the model flags a deal as 30% likely to close despite the rep submitting it as Commit, managers have a data point to push back on—not just a gut feeling.
4. Improved coaching and performance
Deal-level probability scores tell managers exactly where to spend their coaching time. Instead of reviewing every rep’s pipeline equally, a manager can sort by deals where the model score and rep-submitted forecast category diverge most—those are the conversations worth having.
Over time, deal probability data also shows which rep behaviors correlate with higher win rates. Reps who engage three or more stakeholders by Stage 3 close at 2x the rate of reps who don’t. That’s not an anecdote—it’s a pattern the model surfaces, and it’s the kind of coaching signal that changes rep behavior.
5. Smarter resource allocation
When finance and HR trust the revenue projection, they can plan against it. Predictive forecasting closes the gap between RevOps and the rest of the business. Finance can model hiring scenarios against a probability-weighted pipeline instead of waiting for Q-end actuals. Sales leadership can identify coverage gaps—territory segments where pipeline-to-quota coverage is below 3x—before they become misses.
[banner type="download" url="https://www.weflow.ai/resources/cheat-sheets/the-ultimate-sales-forecasting-guide" text="Sales Forecasting Implementation Guide" subtitle="Stand up a forecasting process your reps actually follow and your CFO trusts" button="Get the guide"]
CROs who walk into board meetings with probability-weighted revenue projections, not rep-submitted guesses, have a different kind of credibility. The model’s track record becomes part of how the company plans.
Key metrics to track in predictive sales forecasting
| Metric | Formula / definition | Benchmark |
|---|---|---|
| Forecast accuracy (%) | (1 − |Forecasted revenue − Actual revenue| / Actual revenue) × 100 | ≥95% in mature predictive deployments; below 88% signals data quality issues |
| Win rate (%) | Closed-won opportunities / Total closed opportunities × 100 | 20–30% for mid-market B2B; varies by segment and deal type |
| Average deal age | Average days from opportunity created to closed (won or lost) | Benchmark against your own historical average; spikes indicate pipeline stall |
| Pipeline coverage ratio | Total pipeline value / Quota target | 3x quota minimum; below 2.5x is a red flag for the current quarter |
| Slipped deals (%) | Deals that moved close date to future period / Total forecast deals × 100 | Below 10% per quarter; above 20% indicates systematic close date inflation |
| Model confidence score | Average probability score across Commit-category deals | Commit deals should score ≥70%; below 60% signals over-forecasting |
Track these metrics at the rep, team, and segment level—not just in aggregate. A 90% overall forecast accuracy can mask a rep segment that’s consistently off by 25%. The model should surface those outliers, not average them away.
Common challenges in predictive sales forecasting (and how to solve them)
1. Data quality and completeness
This is the most common failure mode. Predictive models need complete, accurate Salesforce data to produce reliable scores. When activity data is missing—no logged emails, no meeting records, contacts not associated with opportunities—model accuracy drops 10–15 percentage points. A model scoring deals based on stage and close date alone is not much better than a weighted pipeline calculation.
Mitigation: Automate activity capture before deploying predictive forecasting. If reps are manually logging calls and emails (or not logging them at all), fix that first. Tools that automatically sync emails, meetings, and calls to Salesforce opportunity records—without rep action—give the model the signal it needs.
2. Change management and team trust
Reps and managers who’ve submitted forecasts manually for years don’t immediately trust a model that disagrees with their read. When the model scores a rep’s Commit deal at 40%, that rep will push back. When the model turns out to be right, trust builds—but the first few cycles are friction-heavy.
Mitigation: Run the model in parallel with traditional forecasting for the first quarter. Show the comparison at every forecast review. When the model’s call is right and the rep’s call is wrong, document it. Patterns accumulate fast, and most managers come around within two quarters when they see the data.
3. Limited historical data for newer orgs
ML models need a sufficient volume of historical closed deals to train accurately. Organizations with fewer than 200–300 closed opportunities in Salesforce—new businesses, teams that recently migrated to Salesforce, or companies that didn’t track deals consistently—may not have enough history for the model to find reliable patterns.
Mitigation: Start with rule-based scoring (stage-weighted probability, activity thresholds) while building historical volume. Most ML-based platforms need 12–18 months of clean deal history before the model outperforms simpler approaches. Plan accordingly and don’t oversell the AI angle until the data foundation is there.
4. CRM integration complexity
Many forecasting tools sit outside Salesforce and pull data via API, which introduces sync delays, field mapping gaps, and a secondary system that reps and managers have to log into. When the forecasting tool doesn’t read the same Salesforce fields your reporting runs on, you end up with two numbers that don’t match—and no one trusts either.
Mitigation: Prioritize tools built natively on Salesforce rather than ones that integrate with it. Native Salesforce tools read your actual opportunity records in real time, use your existing fields and picklist values, and produce numbers that match what the rest of the business sees in Salesforce reports. The integration complexity problem disappears when there’s no integration.
How to implement predictive sales forecasting: a step-by-step roadmap
Step 1: Audit and clean your Salesforce data
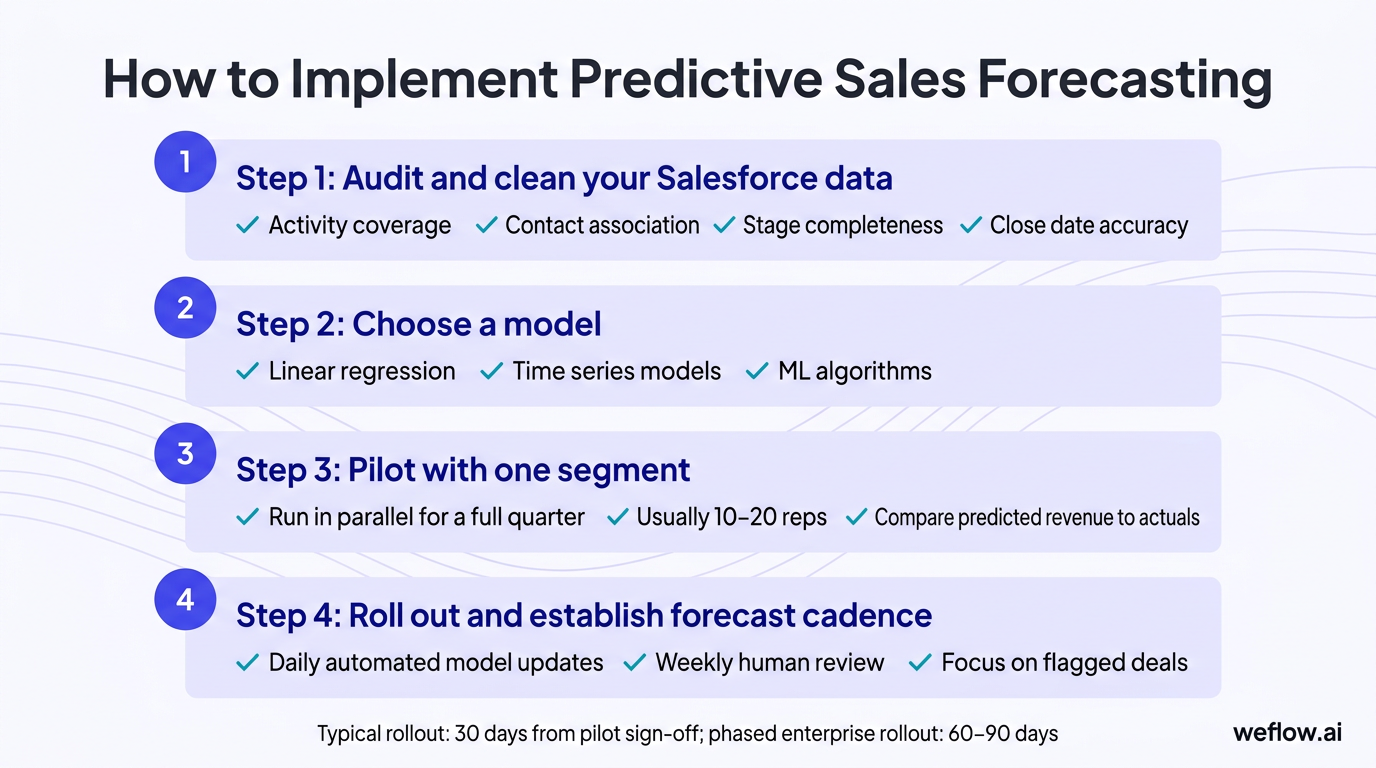
Before touching a forecasting tool, audit your Salesforce data quality. Check four things: activity coverage (what percentage of opportunities have at least one logged activity in the last 30 days), contact association (what percentage of opportunities have a primary contact), stage completeness (are stage exit criteria being followed, or are deals jumping stages), and close date accuracy (what percentage of deals have close dates that haven’t slipped more than once).
Most orgs find 30–50% of opportunities have significant data gaps. Address those gaps first. A predictive model built on top of broken data produces broken predictions, and the team will lose confidence quickly.
Step 2: Choose a model
The right modeling approach depends on your data volume, team size, and how much you need the model to adapt over time.
| Method | Best for | Limitations |
|---|---|---|
| Linear regression | Small teams (fewer than 50 reps), limited historical data, simple deal structures | Assumes linear relationships; doesn’t capture complex interactions between variables |
| Time series models (ARIMA, exponential smoothing) | Businesses with strong seasonal patterns, subscription revenue, predictable renewal cycles | Focuses on revenue trends, not deal-level probability; doesn’t use pipeline signals |
| ML algorithms (gradient boosting, random forests) | Mid-market and enterprise teams with 300+ closed deals, complex sales motions, multiple segments | Requires more historical data; model needs maintenance and periodic retraining |
For most mid-market and enterprise B2B teams using Salesforce, ML-based approaches outperform simpler models once sufficient deal history exists. Commercial platforms handle model selection and retraining automatically—you don’t need a data science team to run them.
Step 3: Pilot with one segment
Don’t roll out predictive forecasting across the entire sales org at once. Pick one segment—one region, one product line, or one rep team—and run the model in parallel with your existing process for a full quarter. Compare model-predicted revenue to actual results at quarter-end. If the model outperforms traditional forecasting by a meaningful margin, you have internal proof to support broader rollout.
Keep the pilot group small enough to learn fast and large enough to generate statistically meaningful results. Ten to 20 reps with a mix of deal types is usually enough.
Step 4: Roll out and establish forecast cadence
Once the pilot validates the model, roll out to the full org and establish a formal cadence. The most effective cadences pair automated model updates (daily) with structured human review (weekly). Managers review model-flagged deals—those where the score has dropped more than 20 points since last week, or where the model score and forecast category diverge by more than 30 points—rather than reviewing every deal equally.
Most orgs complete a full rollout in 30 days from pilot sign-off: two weeks for Salesforce configuration and data cleanup, one week for manager training, one week for rep onboarding. A phased rollout by segment can stretch this to 60–90 days for large enterprise orgs.
[banner type="download" url="https://www.weflow.ai/resources/cheat-sheets/strategic-revenue-planning-cheat-sheet" text="Revenue Planning Cheat Sheet" subtitle="Give finance a pipeline number they can plan headcount and spend against" button="Get it free"]
Real-world predictive forecasting examples
Detecting stalled deals
A mid-market SaaS company’s predictive model flags all opportunities that have been in the Proposal stage for 45+ days with no email or meeting activity in the last 14 days. Of the 12 deals flagged in a given week, nine were submitted as Best Case or Commit by reps. The model scores them at 20–35%.
The sales manager reviews the nine flagged deals in the weekly pipeline call instead of reviewing all 40 open opportunities. Three deals get re-engaged with executive outreach. Two move forward. Four slip to next quarter. One closes won. Without the model, the manager would have called three of those nine deals as likely to close. Only one did.
Correcting overestimated forecasts
An enterprise software team notices that rep-submitted forecasts for their enterprise segment have consistently come in 20% above actual results for three consecutive quarters. The ML model identifies the pattern: enterprise deals submitted as Commit in the last two weeks of a quarter close at 45%, not the 90% implied by the Commit category.
The model applies a segment-specific and timing-specific adjustment, reducing the enterprise Commit contribution in the aggregate forecast by 20%. The revised forecast for Q3 comes in at $8.2M. Actual result: $8.4M. Previous method would have called $10.1M.
Applying probability thresholds
A RevOps leader at a B2B professional services firm sets a policy: only deals scoring ≥40% by the predictive model are included in the official forecast. Deals below that threshold are tracked but excluded from the committed number.
In the first quarter under this policy, the excluded deals total $3.1M in pipeline value. $600K of that closes—representing a 19% win rate. Including them in the forecast at face value would have inflated the projected number by $2.5M. The threshold policy produces a forecast the CFO can plan against. Sub-threshold deals go into an upside list, not the committed number.
How Weflow improves sales forecasting accuracy
Weflow, a Salesforce-native revenue AI platform, addresses the root cause of most forecasting failures: incomplete Salesforce data.
Predictive models are only as good as the data they run on. If Salesforce records are missing activity history—emails not logged, meetings not captured, contacts not associated—the model is flying blind. Weflow fixes that at the foundation. It automatically captures every email, meeting, and call and writes structured activity data directly to Salesforce opportunity records, without reps manually logging anything. The result is the complete activity signal that predictive models need to produce accurate scores.
On top of that data foundation, Weflow gives RevOps leaders and sales managers purpose-built forecasting tools:
- Collaborative forecasting with waterfalls and quarterly predictions: Managers and reps work in a shared forecasting view that shows pipeline movements, deal-level changes, and quarter-to-date progress. Waterfall charts show exactly where the gap between previous forecast and current forecast came from—which deals moved in, which slipped out, and why.
- Forecast submission and tracking in a few clicks: Reps submit their forecast numbers directly in Weflow, which writes the submission back to Salesforce. Managers see all submissions in one view, with model scores alongside rep-submitted numbers—no spreadsheet, no separate tool, no manual consolidation.
- Real-time pipeline health: Because Weflow reads live Salesforce data, pipeline views and forecast projections update continuously. Managers don’t wait for a weekly data pull. They see deal movements as they happen.
For RevOps leaders evaluating forecasting improvements, the starting point is always data quality. Weflow builds that foundation automatically, so the forecasting layer—whether built on Weflow’s tools or another platform—has the signal it needs to work.
Get a demo to see how Weflow’s activity capture and forecasting tools work together inside Salesforce.
Frequently asked questions
What is predictive sales forecasting?
Predictive sales forecasting uses machine learning models and historical deal data to calculate a probability-weighted revenue projection, automatically updated as new pipeline data flows in. It replaces the manual process of asking reps to submit forecast numbers and managers to roll them up. The model scores each deal based on activity signals, stage velocity, and historical win patterns—then produces a bottom-up aggregate forecast.
How accurate is predictive sales forecasting compared to traditional methods?
Mature predictive models achieve ±3–5% variance from actual revenue, compared to ±12–15% for traditional rep-submitted forecasts. The accuracy gap comes from two places: predictive models use more signals (activity data, engagement patterns, historical comparables), and they remove the systematic bias that flows through manual submissions. Accuracy improves over time as the model ingests more closed deal history.
What data do you need for predictive sales forecasting?
You need three categories of data: CRM deal data from Salesforce (stage, deal size, close date, forecast category, historical close rates), activity signals (email volume and recency, meeting frequency, stakeholder engagement), and historical win/loss outcomes. The activity signals are often the missing piece—they require automated capture rather than manual logging to be complete enough for the model to use reliably.
What’s the difference between predictive analytics and AI sales forecasting?
Predictive analytics is the broader discipline—any statistical method that uses historical data to project future outcomes. AI sales forecasting is a specific application that uses machine learning models, which continuously retrain on new closed-deal data and improve over time. The practical difference: a static predictive model uses fixed weights; an ML-based model adapts as your team, market, and deal patterns change.
How long does it take to implement predictive sales forecasting?
A focused implementation takes 30 days from start to first forecast cycle: roughly two weeks for data audit and Salesforce cleanup, one week for tool configuration and manager training, one week for rep onboarding. Larger enterprise orgs with multiple segments or Salesforce orgs should plan 60–90 days for a phased rollout. The data quality work typically takes longer than the tool configuration.
What are the key metrics to track?
The six metrics that matter most: forecast accuracy percentage, win rate by segment, average deal age versus historical baseline, pipeline coverage ratio (target: 3x quota), slipped deals percentage (target: below 10%), and model confidence score on Commit-category deals (target: above 70%). Track all six at the rep and team level, not just in aggregate.
Can small sales teams benefit from predictive forecasting?
Yes, but the approach should match the data available. Teams with fewer than 200–300 closed deals in Salesforce don’t have enough history for ML models to outperform simpler rule-based scoring. Smaller teams are better served by stage-weighted probability scoring with activity thresholds—a simpler form of predictive analytics that doesn’t require ML. Plan to move to ML-based forecasting once 12–18 months of clean deal history has accumulated.
Does predictive sales forecasting replace human judgment?
No—and it shouldn’t. Predictive models are good at pattern matching across large datasets and at flagging anomalies that humans miss in manual reviews. They’re not good at knowing that a key executive just left the prospect’s company, or that a competitor just dropped their price. The most effective forecasting processes use model scores to direct manager attention—which deals to dig into, which to feel good about—while keeping humans in the decision loop for deals where context matters.