

Bottom-Up Sales Forecasting: Formula, Examples, and Process
What Is Bottom-Up Forecasting in B2B Sales?
Bottom-up forecasting is a sales forecasting method where individual contributors (AEs, SDRs) submit deal-level predictions that roll up into a company-wide revenue forecast. Unlike top-down forecasting, it starts with pipeline reality — not market assumptions.
The process works by aggregating data from every active opportunity in your CRM. Each rep reviews their deals, applies historical win rates and deal-specific factors, then submits a forecast. Managers validate and roll up these numbers across teams, regions, and product lines. The result is a forecast grounded in actual pipeline activity rather than TAM calculations or historical growth extrapolations.
Bottom-up forecasting is the default method for mature B2B sales organizations because it reflects what's actually happening in the field. When done correctly, it gives RevOps and finance teams a defensible number they can present to the board.
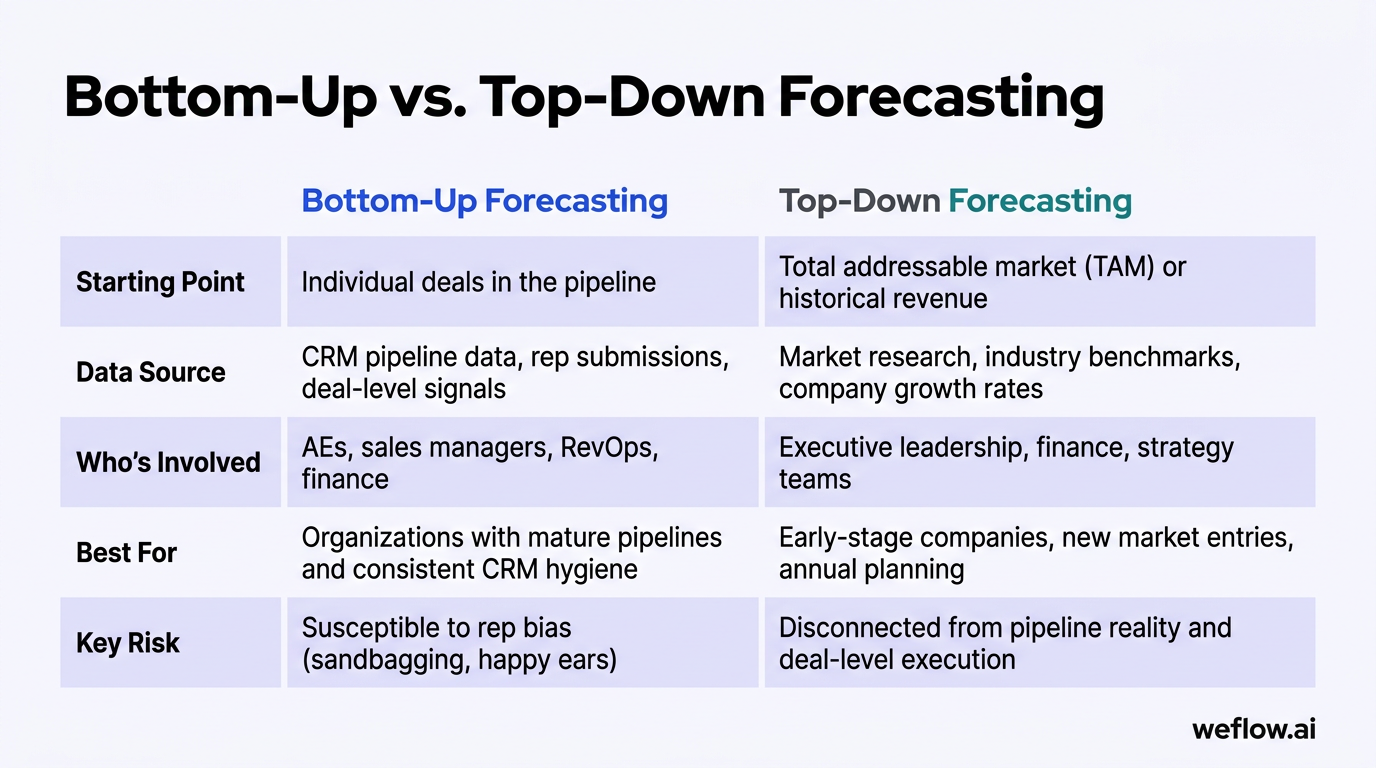
Bottom-Up vs. Top-Down Forecasting: Key Differences
Dimension | Bottom-Up Forecasting | Top-Down Forecasting |
|---|---|---|
Starting Point | Individual deals in the pipeline | Total addressable market (TAM) or historical revenue |
Data Source | CRM pipeline data, rep submissions, deal-level signals | Market research, industry benchmarks, company growth rates |
Who's Involved | AEs, sales managers, RevOps, finance | Executive leadership, finance, strategy teams |
Best For | Organizations with mature pipelines and consistent CRM hygiene | Early-stage companies, new market entries, annual planning |
Key Risk | Susceptible to rep bias (sandbagging, happy ears) | Disconnected from pipeline reality and deal-level execution |
Bottom-up forecasting reflects what your sales team believes they can close based on active opportunities. Top-down forecasting reflects what leadership expects based on market size and company targets. Both have a role — the question is which one anchors your operating forecast.
For weekly and monthly forecasting, bottom-up is the standard because it surfaces deal-level risk early. For annual planning and capacity modeling, top-down provides the strategic frame.
When Should You Use Top-Down vs. Bottom-Up Forecasting?
Top-down forecasting still makes sense for early-stage companies without enough pipeline data to forecast bottom-up. Most mature organizations use a hybrid model.
Use top-down forecasting when:
You're entering a new market with no historical pipeline data
Your pipeline is too small or volatile to produce reliable patterns
You're doing annual or multi-year capacity planning
You need to set targets before building pipeline (common in Q4 planning for the following year)
Use bottom-up forecasting when:
You have 2+ quarters of pipeline data and established win rates
Your CRM hygiene is consistent enough to trust deal-level signals
You need weekly or monthly operating forecasts
You're running forecast reviews with frontline managers
The hybrid approach — start with a top-down target, then validate against bottom-up pipeline — is how most Series B+ companies operate. The bottom-up number tells you whether the top-down target is achievable; the gap between them drives pipeline generation priorities.
Advantages of Bottom-Up Forecasting for Revenue Teams
Advantages
Grounded in actual deal data: Every number traces back to a specific opportunity in Salesforce, not a market assumption.
Factors in historical and present sales through the rep lens: Reps know their deals better than any model. Their input captures context that CRM fields alone miss.
Enables segmented forecasting: Roll up by geography, product line, industry vertical, or account size. This granularity is impossible with top-down methods.
More timely since it runs on weekly cadences: Problems surface within days, not quarters. You can reforecast mid-month and adjust coverage targets in real time.
Requirements
Rep forecast submissions must be vetted by managers: Reps are biased — some sandbag, some are optimistic. Manager review catches obvious errors before they roll up.
Entire sales team needs clear understanding of deal KPIs: If reps don't know what qualifies as "commit" vs. "best case," forecast categories are meaningless.
Accuracy depends on data timeliness and quality: Stale pipeline data produces stale forecasts. Activity capture and deal stage updates need to happen continuously, not the night before the forecast call.
Bottom-Up Forecasting Formula: How to Calculate Revenue from Pipeline Data
The core formula for bottom-up revenue forecasting is:
Forecasted Revenue = Number of Deals in Pipeline × Win Rate × Average Deal Size
Each variable matters:
Number of Deals in Pipeline: Count of qualified opportunities. "Qualified" is critical — include only deals that have passed your stage 1 or 2 threshold, not early-stage leads.
Win Rate: Historical percentage of deals that close. Segment by rep, deal type, or source for accuracy. A blended org-wide win rate works for high-level planning; segment-specific rates work for precision.
Average Deal Size: Mean or median contract value. Use median if your deal size distribution is skewed by a few large enterprise contracts.
This formula gives you a probability-weighted estimate of what your current pipeline is worth. It doesn't tell you what you'll close this quarter — it tells you the expected value of what's in the funnel.
Stage-weighted probability refines this further. Instead of applying one win rate to all deals, you assign different probabilities by stage. A deal in Discovery might have a 10% close probability; a deal in Negotiation might have a 70% probability. Multiply each deal's value by its stage probability, then sum the results.
Bottom-Up Forecasting Example: SaaS Pipeline Calculation
Here's a worked example for a mid-market SaaS sales team:
Basic Calculation
Variable | Value |
|---|---|
Number of AEs | 5 |
Qualified deals per AE | 20 |
Total deals in pipeline | 100 |
Average deal size (ACV) | $15,000 |
Historical win rate | 30% |
Calculation: 100 deals × 30% win rate × $15,000 = $450,000 forecasted revenue
[banner type="download" url="https://www.weflow.ai/content/bottom-up-sales-forecasting" text="Bottom-Up Forecasting Guide" subtitle="Run weekly forecast calls that catch slippage before quarter close" button="Get the guide"]
Stage-Weighted Calculation
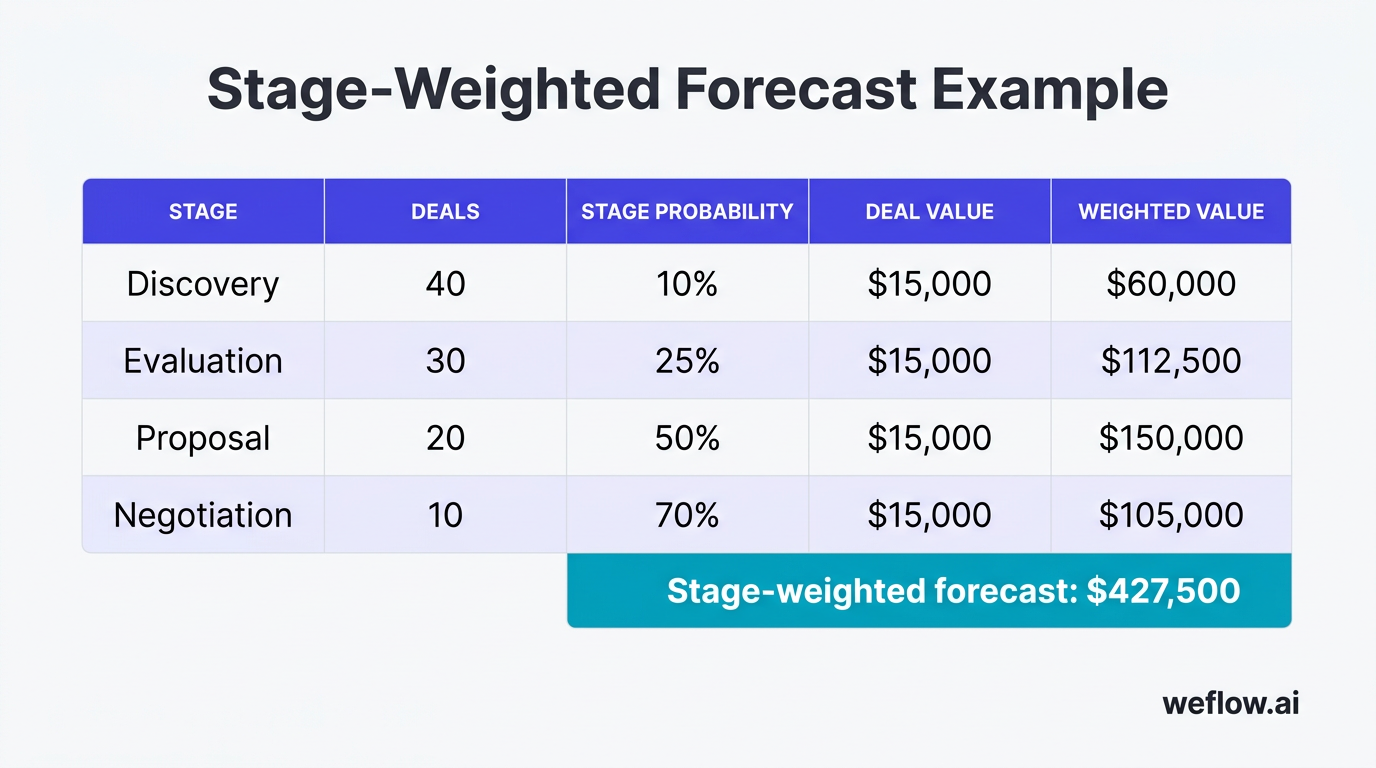
The same pipeline with stage-specific probabilities:
Stage | Deals | Stage Probability | Deal Value | Weighted Value |
|---|---|---|---|---|
Discovery | 40 | 10% | $15,000 | $60,000 |
Evaluation | 30 | 25% | $15,000 | $112,500 |
Proposal | 20 | 50% | $15,000 | $150,000 |
Negotiation | 10 | 70% | $15,000 | $105,000 |
Stage-weighted forecast: $60,000 + $112,500 + $150,000 + $105,000 = $427,500
The stage-weighted number is slightly lower because it accounts for the fact that early-stage deals are less likely to close. Both methods are valid — choose based on how mature your stage definitions and historical data are.
Why Forecast Accuracy Matters for Sales Leaders
Inaccurate forecasts directly cause misallocated headcount budgets, over- or under-investment in marketing, and missed board commitments. Forecast accuracy is the single metric that determines a sales leader's credibility.
When you miss your number, the consequences cascade. Finance adjusts cash flow projections. The board loses confidence in your ability to predict revenue. Hiring plans get frozen or reversed. Marketing budget gets cut mid-quarter. None of these decisions can be undone quickly — and all of them trace back to a forecast that didn't reflect reality.
How to Implement Bottom-Up Forecasting: A 4-Step Framework
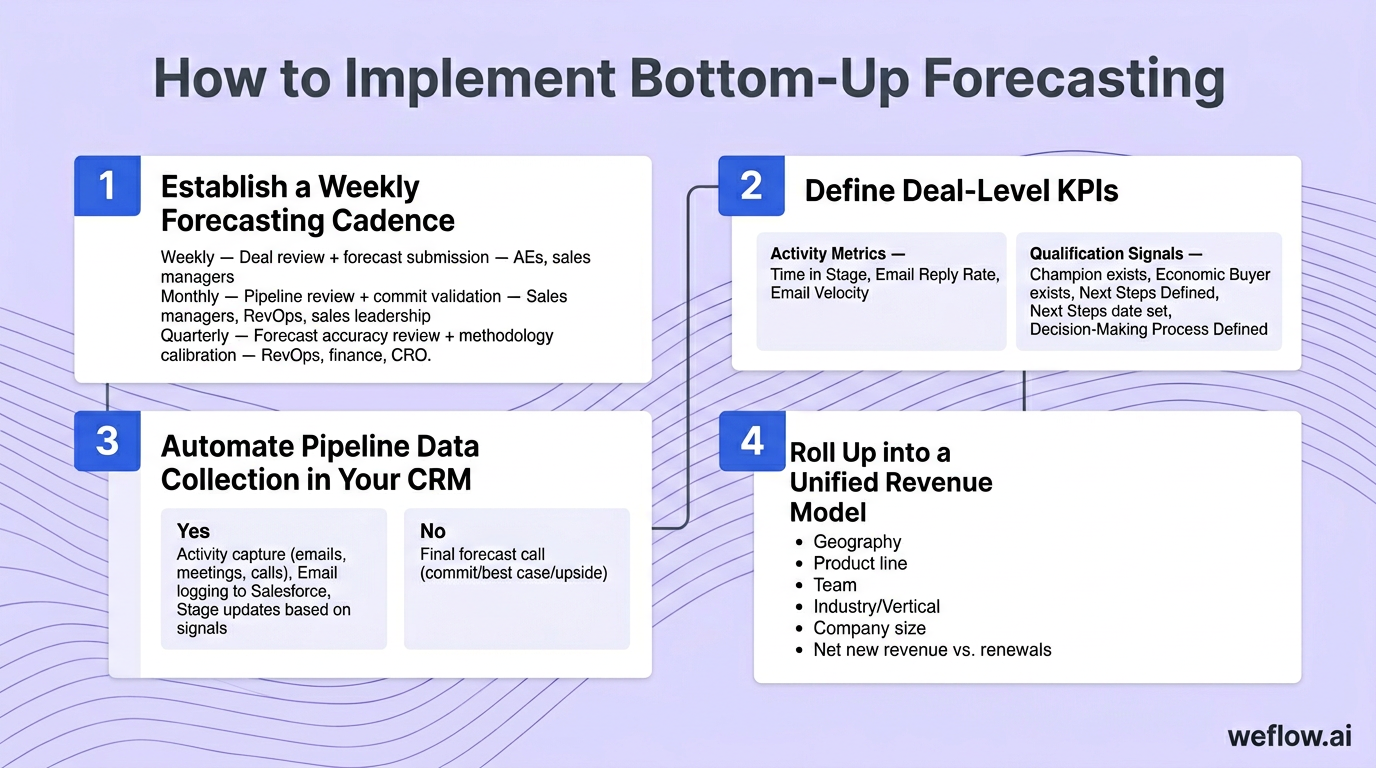
Step 1: Establish a Weekly Forecasting Cadence
Cadence | Meeting Type | Participants |
|---|---|---|
Weekly | Deal review + forecast submission | AEs, sales managers |
Monthly | Pipeline review + commit validation | Sales managers, RevOps, sales leadership |
Quarterly | Forecast accuracy review + methodology calibration | RevOps, finance, CRO |
Weekly cadence is non-negotiable. Pipeline changes too quickly for monthly-only reviews. The weekly meeting forces reps to update their deals, managers to validate, and leadership to spot risk early.
Step 2: Define Deal-Level KPIs Using MEDDIC or Your Sales Methodology
KPI Type | Metrics |
|---|---|
Activity Metrics | Time in Stage, Email Reply Rate, Email Velocity |
Qualification Signals | Champion exists, Economic Buyer exists, Next Steps Defined, Next Steps date set, Decision-Making Process Defined |
These KPIs vary by role — a field rep's signals differ from an Enterprise AE's. Each team should calibrate to their sales motion. What matters is consistency: every rep should assess the same signals when categorizing a deal as commit, best case, or pipeline.
Step 3: Automate Pipeline Data Collection in Your CRM
Automate data collection wherever possible. Manual entry creates lag and inconsistency.
Activity | Automate? | Why |
|---|---|---|
Activity capture (emails, meetings, calls) | Yes | Eliminates rep burden; ensures complete activity history |
Email logging to Salesforce | Yes | Activity data flows in real time without rep action |
Stage updates based on signals | Yes [banner type="download" url="https://www.weflow.ai/content/sales-forecasting-cheat-sheet" text="Sales Forecasting Cheat Sheet" subtitle="Standardize commit criteria so rep submissions actually roll up cleanly" button="Get it free"] | Keeps pipeline current; surfaces stale deals automatically |
Final forecast call (commit/best case/upside) | No | Reps overlay judgment on deal-level signals |
Automation handles the data; reps handle the judgment. The goal is to free reps from logging so they can focus on the forecast calls that actually matter.
Step 4: Roll Up Individual Forecasts into a Unified Revenue Model
Once reps submit and managers validate, aggregate the data across multiple dimensions:
Geography (region, country)
Product line
Team (by manager, by segment)
Industry/Vertical
Company size (SMB, mid-market, enterprise)
Net new revenue vs. renewals
Share the rolled-up forecast with your CFO and executive team for external-factor review. Finance may adjust based on macro conditions, churn assumptions, or seasonality that the bottom-up model doesn't capture.
What Tools Do You Need for Bottom-Up Sales Forecasting?
Before evaluating vendors, define what your forecasting process requires:
What to Look for in a Forecasting Tool
Automated submission calls: Prompts reps to submit forecasts on a defined cadence without manual reminders
Forecast snapshots: Historical record of what was forecasted vs. what closed — essential for accuracy tracking
Category breakdowns: Commit, best case, pipeline, and custom categories your org uses
CRM integration: Reads and writes directly to Salesforce; doesn't create a parallel data silo
Historical accuracy tracking: Shows rep-level and team-level accuracy over time to identify patterns
Weflow provides these capabilities natively within Salesforce. It automates activity capture, runs forecasting workflows directly in your CRM, and tracks accuracy over time without requiring a separate tool. For teams that want forecasting without adding another tab to their stack, it's worth evaluating.
5 Ways Sales Managers Can Improve Forecast Accuracy
1. Define and Share Common Success Metrics
Document what qualifies a deal for each forecast category. Reference your sales methodology — MEDDIC qualification criteria, required CRM fields at each stage change, and the specific signals that move a deal from "pipeline" to "commit."
If reps have different definitions of "commit," your roll-up is noise. Standardize first.
2. Make Reps Accountable for Pipeline Hygiene
Reps own their pipeline. Close dates should be realistic, not optimistic. Deal amounts should reflect the actual scope discussed, not placeholders. Stages should match the buyer's position, not the rep's hope.
Pipeline hygiene isn't micromanagement — it's the foundation of a forecast you can trust. Build it into 1:1s and deal reviews until it becomes habit.
3. Make Reports Accessible and KPIs Tangible
Start by sharing team-level dashboards in Slack or your CRM before expecting individual-level transparency. When reps see how pipeline health connects to quota attainment — theirs and their team's — they're more likely to keep data current.
Abstract KPIs don't change behavior. Show reps how their pipeline coverage translates to their paycheck.
4. Challenge Deals with the Right Questions
In forecast reviews, probe for specifics: Who's the economic buyer? What's the compelling event? What happens if they don't buy this quarter? Deals without clear answers to these questions don't belong in commit.
Red flag: If deals regularly appear in the last week of the quarter, your forecasting process has a sandbagging problem. Address it by requiring all commit-stage deals to be logged 2+ weeks before quarter close.
5. Never Skip Forecasting Meetings
If leadership skips forecast calls, reps will deprioritize pipeline hygiene. The meeting itself is the forcing function. Cancel it consistently and watch data quality erode.
This applies to managers too. When a manager doesn't review their team's pipeline weekly, their number becomes less reliable. Consistency compounds.
Disadvantages and Limitations of Bottom-Up Forecasting
Limitation | Mitigation |
|---|---|
Requires high-quality CRM data | Automate activity capture to reduce manual entry burden |
Time-consuming to establish | Establish a cadence — the process accelerates after 2-3 cycles |
Susceptible to rep bias (sandbagging or happy ears) | Manager vetting + historical accuracy tracking per rep |
Doesn't account for macro market shifts | Combine with a top-down overlay (hybrid model) |
Make data-driven decisions the norm and make forecasting a regular, repeatable process. The disadvantages of bottom-up forecasting are process problems, not methodology problems. Every limitation above can be addressed with the right tooling and cadence.
Bottom-Up Forecasting vs. Other Sales Forecasting Methods
Bottom-up isn't the only approach. Here's how it compares to other methods:
Pipeline-weighted forecasting: Applies stage-specific probabilities to each deal. A refinement of bottom-up, not a replacement. Use when you have reliable historical close rates by stage.
AI/ML-based forecasting: Uses machine learning to predict outcomes based on deal signals, rep behavior, and historical patterns. Works best with large datasets (1,000+ closed deals). Augments rep judgment rather than replacing it.
Time-series forecasting: Projects future revenue based on historical patterns and seasonality. Useful for recurring revenue businesses with predictable trends. Doesn't account for pipeline-level changes.
Scenario planning: Models multiple outcomes (conservative, expected, optimistic) based on different assumptions. Use for annual planning and board presentations, not weekly forecasts.
Most mature organizations combine methods: bottom-up for the weekly operating forecast, ML for deal-level risk scoring, and scenario planning for quarterly board updates.
Frequently Asked Questions
What is the difference between bottom-up and top-down forecasting?
Bottom-up forecasting starts with individual deals in your pipeline and aggregates them into a revenue forecast. Top-down forecasting starts with market size or company targets and allocates downward. Bottom-up reflects what reps believe they can close; top-down reflects what leadership expects to achieve. Most B2B organizations use both — bottom-up for operating forecasts, top-down for annual planning.
What is the bottom-up forecasting formula?
Forecasted Revenue = Number of Deals in Pipeline × Win Rate × Average Deal Size. For more precision, use stage-weighted probability: multiply each deal by its stage-specific close probability, then sum the results. The formula only works if your pipeline data and historical win rates are accurate.
When should a B2B company use bottom-up forecasting?
Use bottom-up forecasting when you have at least 2 quarters of pipeline data, established win rates by stage or segment, and consistent CRM hygiene. It's the default for weekly and monthly operating forecasts. If your pipeline is too small or volatile, start with top-down and transition to bottom-up as your data matures.
How accurate is bottom-up forecasting compared to other methods?
Accuracy depends on data quality and rep honesty, not the method itself. Bottom-up forecasting typically produces forecast error rates between 5-15% when implemented correctly. AI/ML methods can improve accuracy by 10-20% in organizations with large historical datasets, but they augment bottom-up rather than replace it.
What tools do you need for bottom-up sales forecasting?
At minimum: a CRM with pipeline management (Salesforce), a way to capture forecasts by category (commit/best case/pipeline), and historical accuracy tracking. Dedicated forecasting tools add automation, snapshots, and manager rollups. Activity capture tools ensure the underlying pipeline data is complete.
How often should sales teams submit bottom-up forecasts?
Weekly. Pipeline changes too quickly for monthly-only reviews. Weekly submissions surface deal slippage early, give managers time to course-correct, and create a forcing function for reps to update their CRM. Many teams also do a formal monthly commit review and quarterly calibration.
What are the biggest mistakes in bottom-up forecasting?
Inconsistent forecast category definitions across reps, stale pipeline data, no manager vetting, and skipping the weekly cadence. The most common failure is trusting rep submissions without challenging the underlying deal signals. If a rep says "commit" but can't name the economic buyer, the deal doesn't belong in commit.
Can you combine bottom-up and top-down forecasting?
Yes, and most mature organizations do. Set annual or quarterly targets using top-down methods (market sizing, historical growth, board expectations). Validate those targets against bottom-up pipeline data. The gap between your top-down target and bottom-up forecast tells you how much pipeline you need to generate — and where.
Key Takeaways: Building Accurate Bottom-Up Forecasts
Bottom-up forecasting gives B2B sales organizations a grounded, pipeline-driven alternative to top-down guesswork. When paired with clear KPIs, regular forecasting cadences, and the right tooling, it delivers the accuracy that boards and CFOs demand.
Start with pipeline reality: Every forecast number should trace back to a deal in your CRM. Abstract projections don't survive contact with actual pipeline.
Standardize forecast categories: If reps have different definitions of "commit," your roll-up is unreliable. Document the criteria and enforce them.
Establish a weekly cadence: Pipeline changes too quickly for monthly forecasts. Weekly submission + manager review catches problems early.
Automate data capture: Manual CRM updates create lag and inconsistency. Automate activity logging so reps can focus on the judgment calls that matter.
Track accuracy over time: Measure forecast error by rep and team. Patterns emerge that help you calibrate submissions and identify coaching opportunities.
Combine with top-down for planning: Use bottom-up for the weekly operating forecast, top-down for annual targets and capacity modeling. The gap between them drives pipeline priorities.


.png)


