Is 3x Pipeline Coverage Enough? How to Audit What Your Coverage Ratio Contains
Learn whether 3x pipeline coverage is enough and how to audit what's in your ratio using Salesforce.



A coverage ratio is one number standing in for four. Deal count, workability, cycle length and win rate all get collapsed into a single figure, which is why a pipeline nobody can work and a pipeline that closes can both read 3x.
So the useful question isn't whether the ratio lies. It's what number you should be managing to, and what's actually inside the one you're reporting. Both are answerable from your own Salesforce data this week.
The alternative is what most teams do now: open deals one at a time the afternoon before the forecast call and hope you catch the rot. That's a fine way to run deal reviews for five deals. It doesn't survive a hundred and fifty.
What is a pipeline coverage ratio?
Pipeline coverage ratio is open pipeline divided by the gap to goal, meaning the target for the period minus what has already closed.
The gap to goal denominator matters more than people think. Divide by the full target and the ratio pretends closed business still needs covering, so it never decays properly as bookings land.
The numerator is where the ratio stops being a fact and becomes a decision:
- All open pipeline. The biggest number and the least meaningful, because it counts deals that will never be relevant to this period.
- Qualified pipeline from a chosen stage onward. The only version you can tie to a win rate, because a win rate is always measured from a stage.
- In-period close dates only. Tighter, and hostage to how honestly reps set close dates.
- Nominal or weighted. Weighting by stage probability produces a smaller number that's only as good as probabilities somebody set once and never revisited.
Four legitimate choices, four different ratios off the same pipeline. A coverage ratio without its definition attached is uninterpretable, which is why comparing your 3x to somebody else's 3x tells you nothing.
Why the 3x pipeline coverage benchmark misleads
3x isn't a benchmark. It's an implied win rate, and it says you convert roughly a third of the deals you're counting from the stage you're counting them from.
"Now 3x tells you a couple of things. Your win rate should be like one third. That's kind of like the quick heuristic thinking. Okay. You're already panicking because maybe you're not winning at 33%. I win at 33% starting at stage three. So let me take it. Let me look at my pipeline coverage ratio of stage three pipeline divided by gap to goal."
Run the arithmetic against your own numbers and the rule falls apart quickly. Say you have $4M of gap to goal. At a 33% win rate from stage three, $12M of stage-three pipeline covers it. At 20%, you need $20M, which is 5x. At 50%, 2x is plenty and chasing 3x means your team is opening deals nobody needs to open.
Businesses genuinely sit across that whole range. Some hit their annual number consistently on coverage below 1x, and a 3x rule would have them declaring a crisis every quarter for a decade.
"Don't follow these generic benchmarks that some companies like to communicate. Like, you need to have coverage of 2x or 3x and so on. I think this is a dangerous mistake to fall into."
The heuristic survived because it's memorable, not because it was derived. And there's a real complication underneath it: deals sitting in stage one today may well be in stage three by the time they matter to this target, so where you draw the numerator boundary is a judgment about the period rather than a rule you can look up.
Managing to a borrowed 3x is a bet that your business converts like whichever business the number came from. Nobody in your leadership team has ever checked whether that's true.
What a healthy coverage ratio hides
Coverage collapses four things into one figure. Here are the three collapses that actually cost teams the quarter.
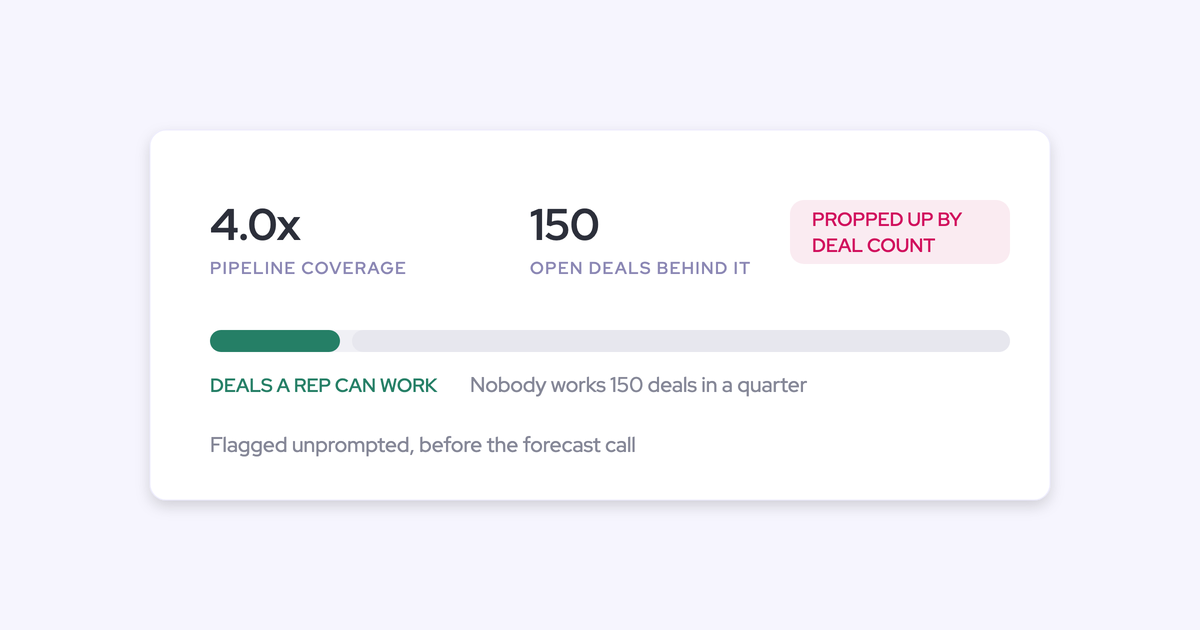
4x coverage built from 150 deals nobody can work
Coverage propped up by deal count isn't coverage, it's a queue. No rep processes 150 open deals in a quarter, so both the ratio and the forecast resting on it are fiction.
The cause is the incentive working exactly as designed. A thin pipe gets a rep a difficult conversation with their manager and a fat one doesn't, so deals that don't meet the criteria get opened anyway. Newly hired AEs do it most.
Then it compounds. Those deals dilute the historical close rate two quarters later, and the close rate is what your forecast and your coverage target are both derived from. So the model starts lying in the direction of optimism.
Two readings fix it. Put deal count per rep next to pipeline value, and check it against average cycle length: if your cycle is 60 days, a rep holding 150 deals in a 13-week quarter is holding inventory, not pipeline. Some teams also have RevOps audit new opportunities against the qualification criteria independently of the manager, because the manager carries the same pipeline target the rep does.
One blended company number masking a 1.4x segment
A company-level coverage ratio averages away the segment that's actually short.
We see the same shape repeatedly: a healthy enterprise team pulls the blended number to something respectable while a smaller regional team sits at 1.4x. Nobody notices until the miss lands, which is the quarter you need to close that pipeline and far too late to create any.
It's usually a cadence problem as much as a math problem. Coverage gets assembled by hand in a spreadsheet at QBR time, as one number for the whole business, because building it per segment by hand every week is nobody's job.
Coverage only means something read at the level pipeline is generated and closed: segment, territory, rep. One number for a company running four motions is four wrong answers averaged together.
Deal rot that surfaces as week-six evaporation
Coverage that evaporates mid-quarter was never coverage. The rot was in the deals from the start and nothing surfaced it.
"We've all lived through this reality where your pipeline coverage looks pretty good, and then in week five, six, seven, it starts to slip and stall. And suddenly, your pipeline coverage evaporates, And this very often is a reality of poor deal reviews and deal insights. And so the question is really like, how do you understand whether a particular deal is healthy to either execute against that deal at best quality or to have a conversation around risk and mitigation of risk. So I think that's really where we're coming from. And yeah, only 47% of forecasted deals close on time according to a study from CSO Insights."
The cause is almost never that too little pipeline was created. It's that nobody inspected the deals inside it. The ratio measures value, and value is the one property of a deal that tells you nothing about whether it will close.
What would have told you earlier:
- No next step, or a next step field that hasn't moved in weeks
- A single contact on a deal that needs a buying committee
- A close date already pushed twice
- Reply rate and engagement dropping while the stage stays put
- Days in stage past your own average for deals that eventually closed won
That last one only works if you've built the internal benchmark first. Without knowing your own average time in stage, "60 days in negotiation" is a number, not a warning.
How to calculate the pipeline coverage you actually need
Required coverage is the inverse of your win rate from the stage you measure from, applied to gap to goal, derived per segment. That's the whole formula. The work is in the definitions.
- Fix the definition and write it down. Which stage counts, whether close date has to fall in the period, nominal or weighted. Every later comparison depends on this being stable.
- Pull your win rate from that stage. Use as much closed history as you have, four quarters if possible, and use won versus total closed from that stage rather than won versus everything ever created.
- Invert it. 1 divided by your win rate is the multiple you need on gap to goal. A 25% stage-three win rate means 4x of stage-three pipeline, not 3x.
- Sanity-check against creation cohorts. Filter by creation date rather than close date and see how much of each quarterly cohort you actually closed.
- Re-derive per segment, territory and rep, then do it for the next two quarters. If enterprise wins 40% and SMB wins 15%, a single blended multiple is wrong for both teams in opposite directions.
"Not filtering by close dates in Salesforce terms, but filtering by creation date and see how much of that pipeline did we close."
Cohorts are also the honesty check on the multiple. If you normally close 20% of a quarter's created pipeline and one cohort is limping at under 10%, you either have deals stuck or you got sloppy in how you created pipeline that quarter. Both change what your coverage is worth.
One judgment call you can't dodge: cycle length sets the boundary. If your average cycle is 90 days and there are 40 days left in the quarter, early-stage pipeline is not coverage for this quarter. It's coverage for the next one, and counting it is how a 3x report becomes a miss.
How pipeline coverage should decay through the quarter
Coverage is not one number per quarter. It converges from around 3x at the start toward 1x at the end as deals close and slip, so the same ratio means different things in week two and week ten.
The expected week-by-week shape, from 3x toward 1x
The shape is predictable enough to plan against, which is what makes an abnormal read visible while you can still act on it.
- Weeks 1 to 2: unreliable. The number is distorted by deals snowplowed over from last quarter.
- Weeks 2 to 3: cleanup. Close dates get reset and the carry-in pipeline gets sorted out.
- Week 4: the first honest read on what you're actually working with.
- Weeks 5 to 9: optimism builds. Commit grows faster than evidence does.
- Week 10 onward: push-outs start. Deals move into next quarter.
"It converges from three and it shrinks down to one. Hopefully, you're not under one because then you're in a bad spot."
Drifting below 1x late in the period means the gap can no longer be covered by anything in the pipeline. That's arithmetic, not pessimism.
And the thing to be clear with your CRO about: a thin week six was baked in weeks earlier.
"Your pipeline coverage is kind of like light from a star. By the time you see the light, it had already traveled a great distance. Same thing with your pipeline. Your pipeline was generated cohorts ago, right? Whether it's a weekly cohort, monthly cohort, quarterly cohort."
So the response to thin coverage in week six is next quarter's creation plan, not a heroic push on deals that were never real.
Why Salesforce alone can't show you coverage decay
Salesforce stores current state, so last month's pipeline can't be reconstructed from the org.
An opportunity holds the amount, stage and close date it has right now. Field history tracking is the only native record of change, and it comes with two conditions most teams discover too late:
- It has to be enabled on each field in advance. Switch it on late and your analysis silently runs on the subset of opportunities that happen to have history, reporting averages that look plausible and are wrong.
- Calculated and roll-up fields can't be history-tracked at all. That's frequently the custom amount field a team forecasts on.
Which is why native Salesforce forecasting gives you no waterfall and no way to ask how this quarter compares to the same day last quarter. Reading coverage decay needs a system taking opportunity-level snapshots on a schedule, and building that yourself means owning a data model, a snapshot job and a hierarchy roll-up while also producing this week's number.
How to audit what your pipeline coverage contains
A coverage audit decomposes the ratio into the components it collapses, and attaches a trigger reading to each one so the review starts from the deals where being wrong is expensive.
| Component | Question it answers | What a bad reading looks like |
| Definition | What's in the numerator, and from which stage? | Nobody can state it, or it changed since last quarter |
| Required multiple | What does our own win rate demand? | The target is a round number somebody inherited |
| Deal count per rep | Can one human work this many deals in a period? | Count far above what your cycle length allows |
| Cycle length vs. days remaining | Can this pipeline close inside the period at all? | Coverage carried by deals younger than your cycle |
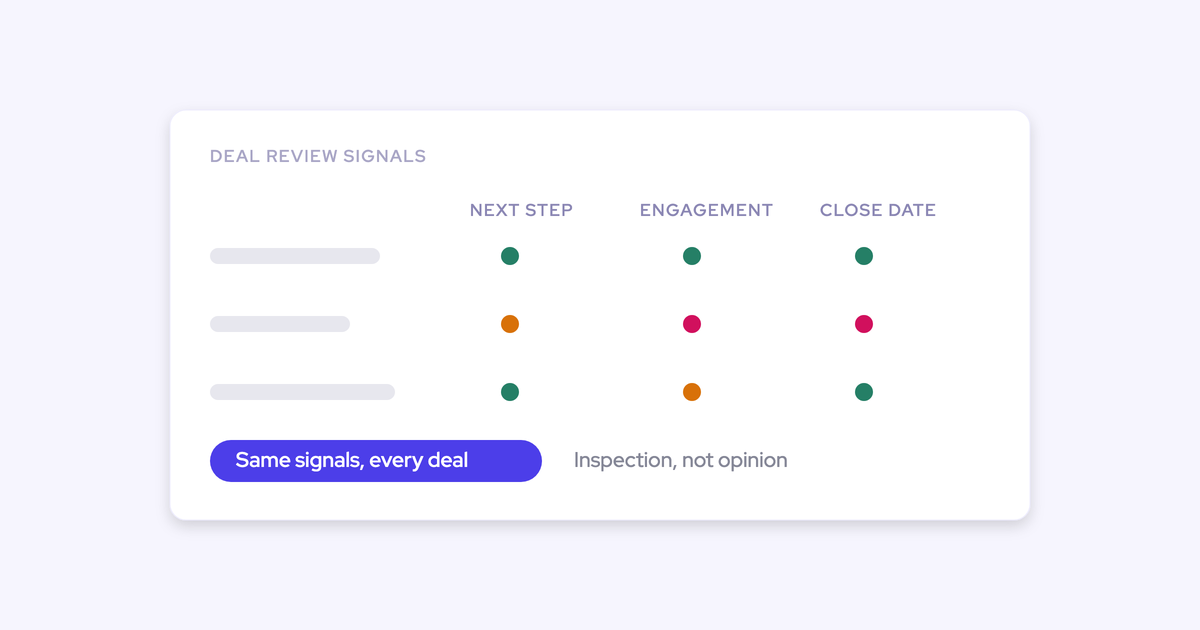
| In-deal health | Are these deals actually alive? | No next step, one contact, close date pushed twice, engagement falling |
| Segment, territory, rep | Who is short, not whether we are short? | A healthy blended number with a sub-2x team inside it |
| Position on the decay curve | Is this ratio normal for this week? | Week-ten coverage that only looks fine against a static 3x |
| Out-quarter coverage | Is next quarter already short? | Nobody has looked past the current period |
Here's the problem with the audit. Run by hand, it is exactly the per-deal dig that doesn't scale: a pipeline export, a spreadsheet, and an afternoon before every forecast call. It's the first thing that gets dropped in a busy week, and busy weeks are when coverage rots.
How Weflow makes the coverage audit continuous
Weflow computes coverage next to the components it collapses, and snapshots pipeline every few hours so the decay curve is recorded history rather than a reconstruction. Weflow is the Revenue AI Orchestration platform for sales, customer success, and RevOps teams.
Mapping the audit onto what the platform keeps current:
- The required multiple. Weflow computes win rate, average deal size and average sales cycle length alongside coverage ratio and gap to forecast, so the number you derive by hand above sits next to the number you're actually running.
- The decomposition. Weighted and unweighted pipeline, deal count, and the opportunity IDs behind every aggregate, so a ratio can be opened rather than just read.
- Deal count and workability. The reporting flags the rep who is grossly over or under, and coverage propped up by deal count rather than deals anyone can work.
- Granularity. Coverage readable per segment, territory and rep instead of one blended company figure, across 30+ pre-built pipeline metrics including coverage, team benchmarks and opportunity snapshots.
- The time dimension. Snapshots every few hours give Weflow its own history to difference, which is what makes the waterfall, the pacing view and same-day-last-quarter comparisons possible against a CRM that stores current state.
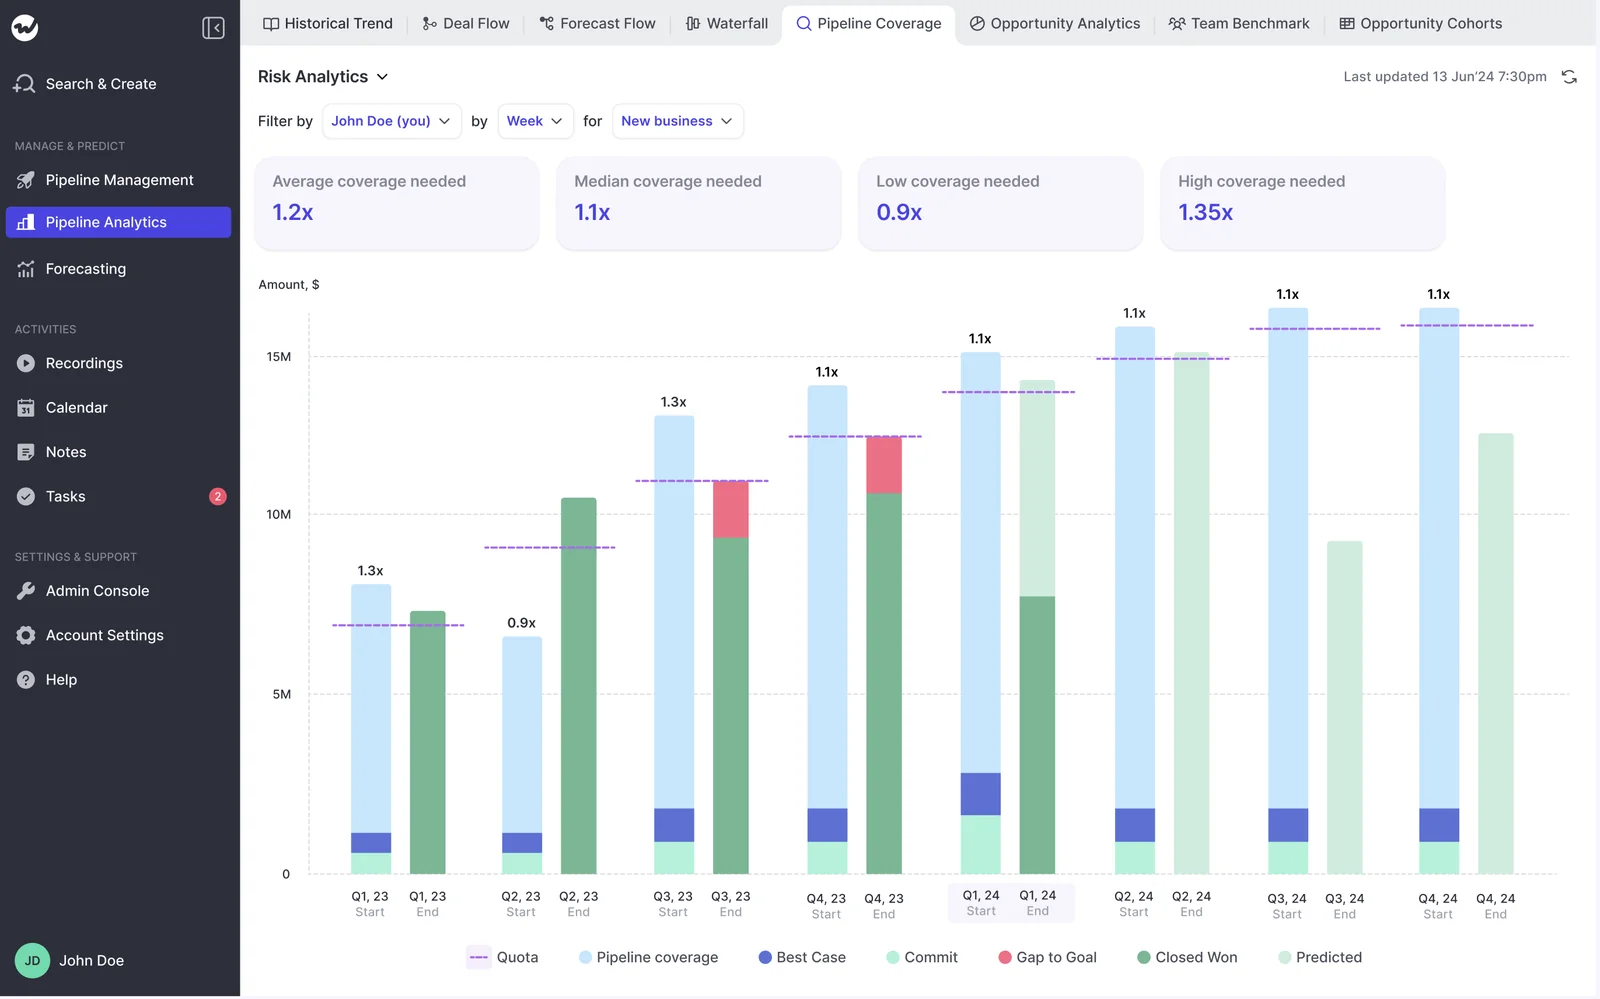
Out-quarter coverage gets the same treatment as the current one, which is where a creation shortfall becomes actionable instead of retrospective.
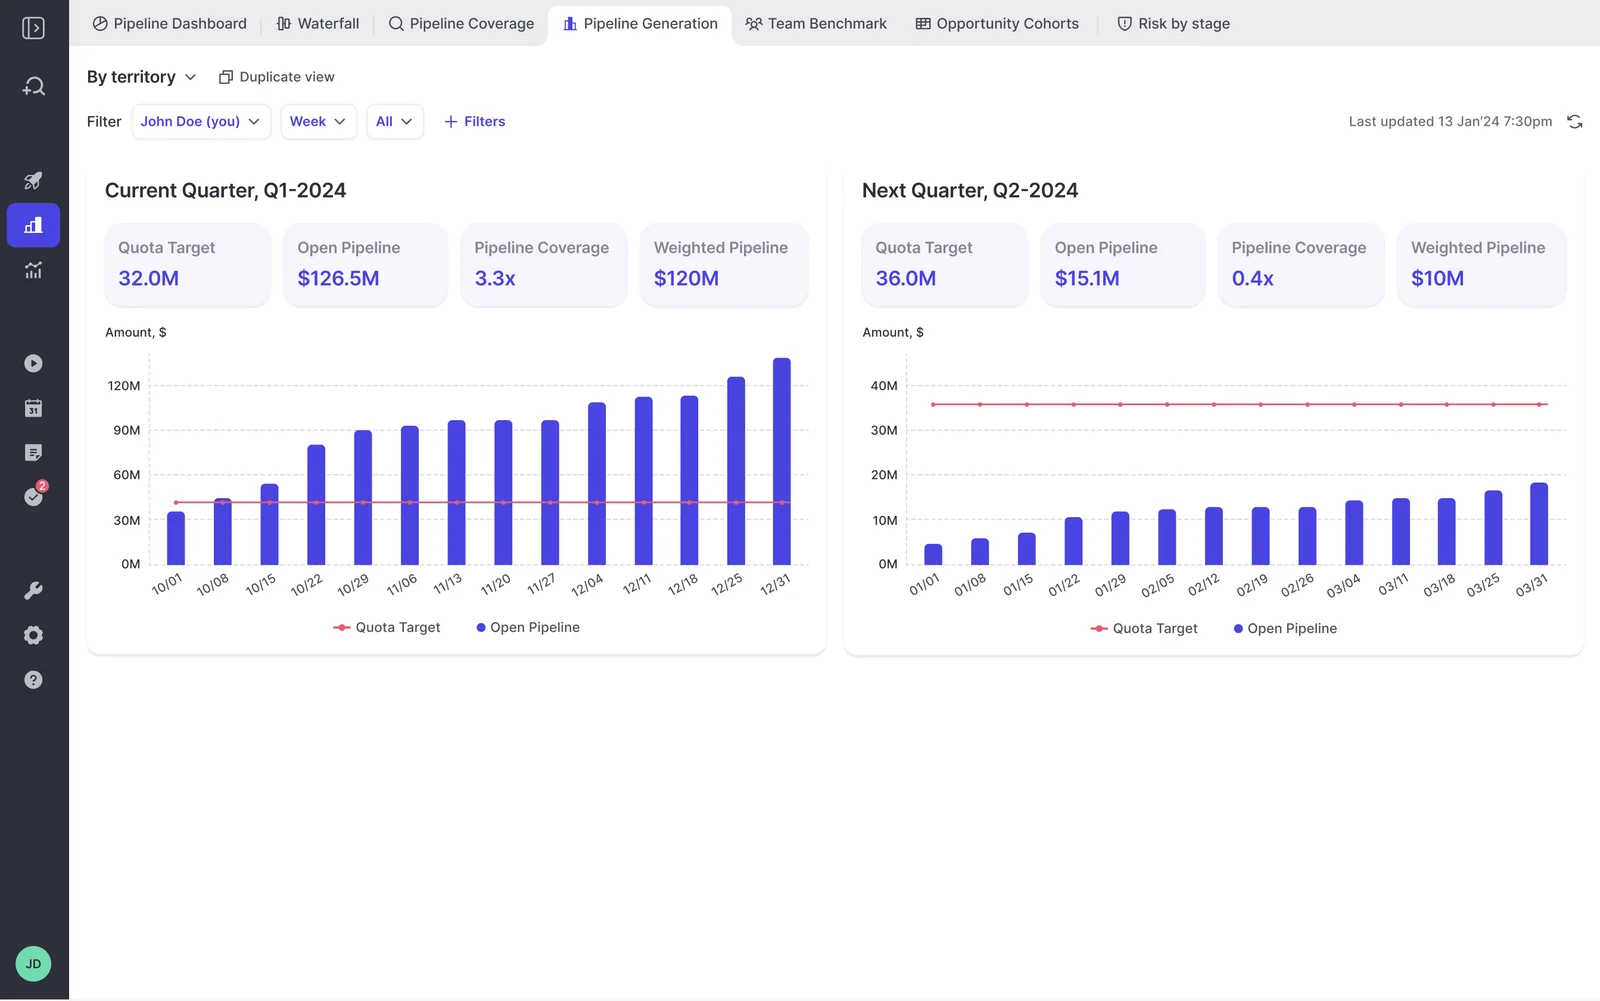
Three honest limits, because you'll hit them anyway:
- Weflow does not ship a correct coverage benchmark. The right multiple still comes from your own win rate and cycle, derived exactly as above. No vendor can hand you that number.
- Weflow computes against its own forecast configuration, not your org's native Salesforce forecast setup. If those two need to agree, that's a configuration decision to make before rollout, not after.
- Pipeline Analytics, where coverage reporting lives, is part of the Forecasting package: Deal Intelligence & Forecasting at $39 per user per month, billed annually. It is not part of the standalone Pipeline Management product. The two names sound alike and this catches people out.
One more thing worth saying plainly: none of these reports is a silver bullet, and none of them work at all if the activity, conversation and qualification data underneath is missing. Coverage is a data quality problem before it's a ratio.
Free guide: Deal Insights & Pipeline Management Best Practices
Pipeline coverage FAQs
Is 3x pipeline coverage enough?
Only if you win roughly a third of deals from the stage you measure coverage from. 3x is an implied win rate, so the honest answer comes from inverting your own conversion rate: a 20% win rate needs 5x, a 50% win rate needs 2x, and some businesses hit their annual number below 1x.
Should coverage use weighted or unweighted pipeline?
Both are legitimate numerators and they produce different ratios, so what matters is fixing the definition before comparing to a benchmark or to another team. Unweighted is easier to explain and easier to game with junk deals. Weighted is only as honest as stage probabilities somebody maintains. Weflow computes both, which lets you see how far apart they are.
How often should pipeline coverage be reviewed?
Weekly, against the expected decay curve rather than a fixed multiple. The same ratio means something different in week two than in week ten, and a QBR-cadence read surfaces a gap in the quarter you needed to close it, with no time left to create pipeline.
Can pipeline coverage be tracked for future quarters?
Yes, and it should be. Track the current quarter plus the next one and the one after, because pipeline was generated cohorts ago and a creation shortfall is only fixable while there's still runway. Coverage read only on the current period is a post-mortem with a dashboard on it.
Which Weflow package includes pipeline coverage reporting?
Coverage reporting sits in Pipeline Analytics, which is part of Weflow Deal Intelligence & Forecasting at $39 per user per month billed annually, or inside Revenue AI Enterprise at $79 per user per month. It is not included in the standalone Pipeline Management product, so a team holding Pipeline Management, Activity Capture and Conversation Intelligence has no analytics or forecasting tab.