AI Pipeline Visibility Workflows That Flag Risks and Automate Reporting [Framework]
Learn how to build AI pipeline visibility workflows that flag deal risk and automate Salesforce reporting.


.webp)

Most pipeline reviews still start with cleanup. Reps update close dates during the meeting, managers ask who actually attended the last call, and RevOps spends Friday pulling reports nobody trusts by Monday.
AI can fix that, but only if it starts with Salesforce data capture. This framework shows how to build the capture layer, flag deal risk before the forecast call, and replace spreadsheet reporting with workflows your team can deploy in weeks, not quarters.
[banner type="download" url="https://www.weflow.ai/cheat-sheets/ai-pipeline-visibility-cheat-sheet" text="AI Pipeline Visibility & Reporting Cheat Sheet" subtitle="Get AI data-capture workflows, hygiene checklists, and reporting frameworks." button="Download now"]AI data capture: build the foundation for accurate forecasts
Pipeline visibility breaks long before the forecast call. It breaks when emails never make it into Salesforce, when qualification fields go stale, and when managers review a pipeline that looks active on paper but has no real buyer engagement behind it.
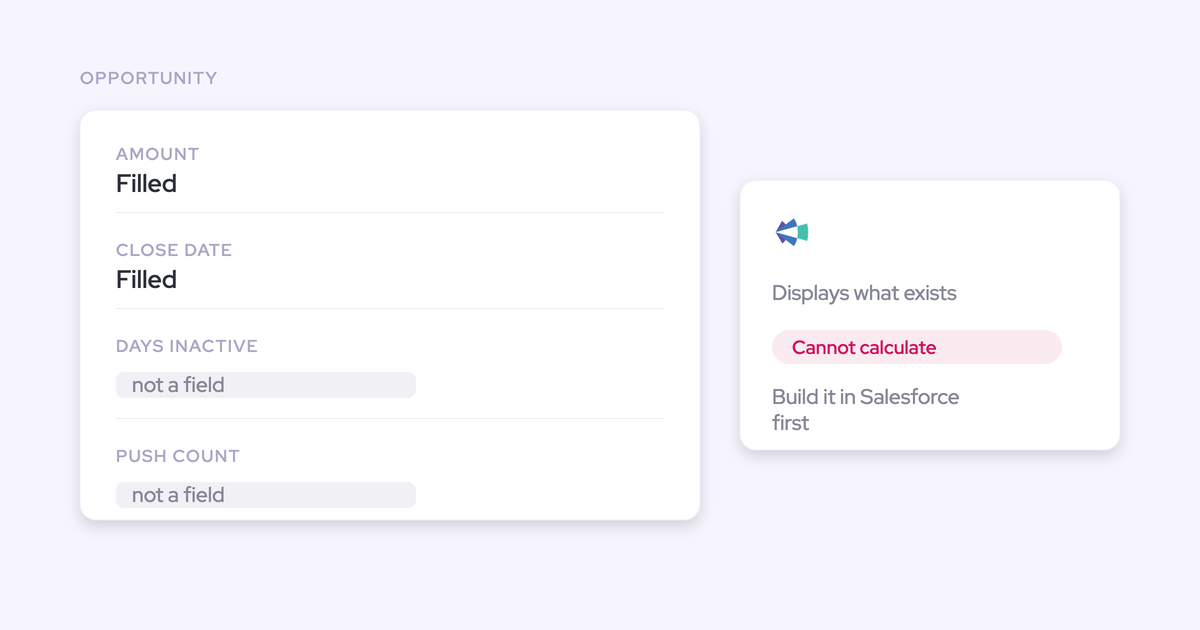
Manual data entry is the root problem. If reps are responsible for logging emails, summarizing calls, updating MEDDIC fields, and fixing stage hygiene, you’ll get partial data, delayed updates, and forecast bias. The goal of AI data capture isn’t to add another layer of reporting. It’s to give Salesforce a real-time, usable record of what’s happening in each deal so managers can make decisions on current data.
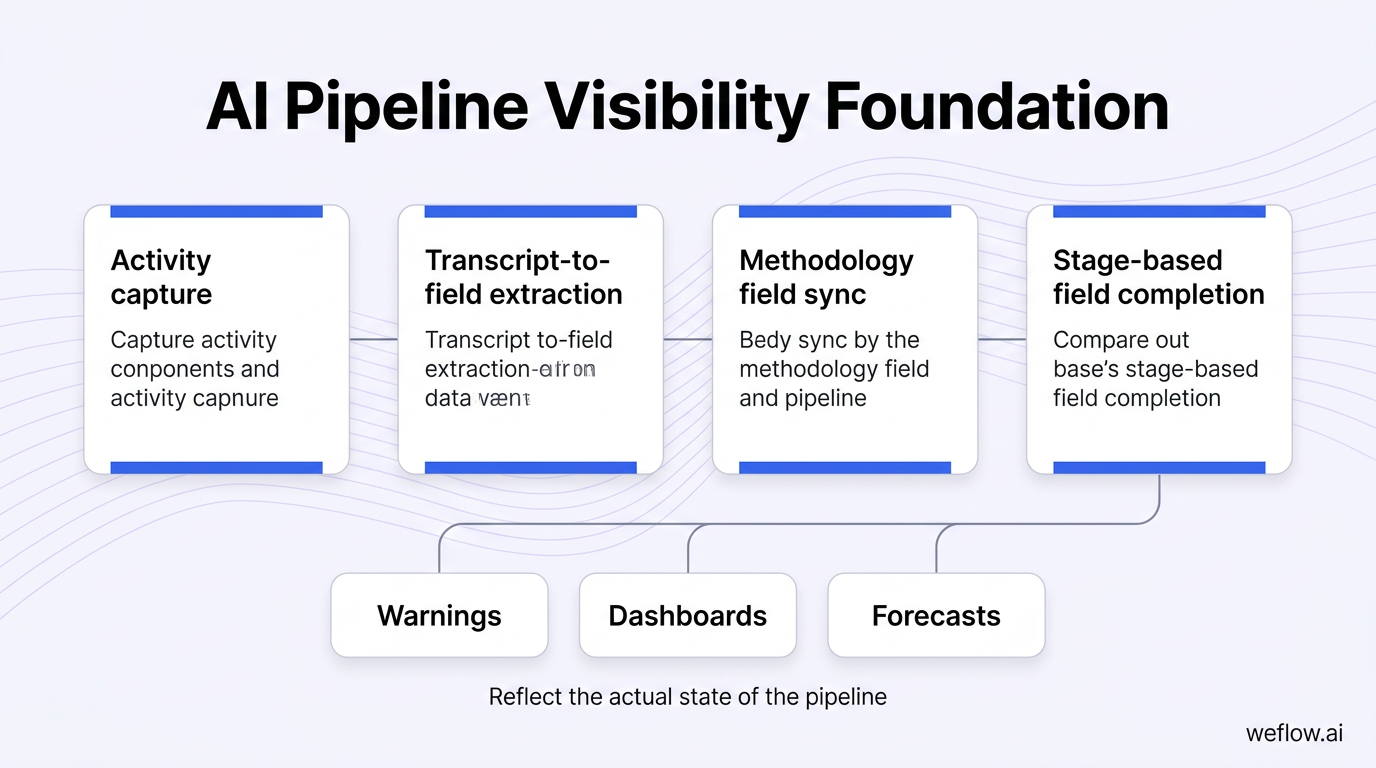
The foundation usually comes down to four pillars: activity capture, transcript-to-field extraction, methodology field sync, and stage-based field completion. Once those are in place, warnings, dashboards, and forecasts start to reflect the actual state of the pipeline—not the version reps had time to enter.
Important: AI warnings and forecast models only work when the underlying Salesforce data is current and complete. If activity sync is inconsistent or field mapping is shallow, the output looks precise but still points to the wrong deals.
Capture activity data to track deal velocity
If your team relies on reps to manually log emails and meetings, the pipeline will almost always look healthier than it is. Deals appear active because the opportunity record exists, but the actual engagement history is incomplete—so stalled deals, missing stakeholders, and long gaps between touches never show up in reporting.
Activity capture should give you a 95%+ activity capture rate across email and meetings, with clean Salesforce write-back to the right records. That’s what lets RevOps measure deal velocity, multi-threading, and inactivity without another weekly cleanup cycle.
- Connect Google Workspace or Microsoft 365 to a Salesforce-native activity capture layer so emails, meetings, attendees, and timestamps sync automatically.
- Map captured activity to Opportunity, Account, and Contact records using attendee matching, account domain logic, and rep ownership rules.
- Define fallback logic for edge cases—shared inboxes, forwarded invites, channel partners, or multiple open opportunities under one account.
- Let reps review and correct AI-attributed activities from Gmail or Outlook so the system improves without creating a second admin workflow.
- Track core hygiene thresholds in Salesforce: no activity in the last 14 days, no customer-facing meeting scheduled, or only one engaged contact on an open deal.
- Report on activity completeness by rep, segment, and region so you can see whether the problem is behavior, field mapping, or sync coverage.
For teams moving off Gong, this is often one of the first gaps they try to fix. Gong is strong on call recording and coaching, but many RevOps teams still end up using manual workarounds for deeper Salesforce activity mapping, custom object support, or opportunity-level write-back.
Extract CRM fields from call transcripts
Sales calls contain the deal data managers keep asking for: pain points, blockers, competitors, procurement timing, next steps, and who actually has decision authority. If that information stays inside call summaries or lives only in the rep’s notes, it never improves forecast quality.
The practical goal is simple: turn unstructured conversation data into structured Salesforce data. That means AI shouldn’t just summarize the meeting—it should write back the right details to the right fields on the opportunity.
- Record and transcribe every customer meeting. Cover discovery, technical validation, pricing reviews, legal calls, and executive meetings—not just rep demos.
- Create a structured summary template. Capture pain points, objections, next steps, competitors mentioned, implementation blockers, and risk indicators in a consistent format.
- Map transcript outputs to Salesforce fields. Sync summary data to opportunity fields such as next step, competitor, key use case, decision process, and forecast notes. If needed, map data to custom objects as well.
- Control write-back rules. Decide which fields AI can overwrite automatically, which fields need rep confirmation, and which should only append notes for manager review.
- Audit sync accuracy weekly. Review extracted fields against a sample of meetings so you catch bad mappings early, especially in multi-product or multi-threaded deals.
The difference between tools matters here. Many conversation intelligence tools keep summaries and insights in their own UI. That helps coaching, but it does less for Salesforce reporting. Weflow, a Salesforce-native revenue AI platform, focuses on getting that data back into Salesforce so forecast categories, methodology fields, and pipeline views reflect what buyers actually said.
For teams migrating from Gong: the transition is usually lower effort than expected because the inputs already exist—calendar, conferencing, and Salesforce. The project is mostly about reworking field mapping and write-back rules so conversation data improves your CRM instead of sitting next to it.
Sync methodology fields to enforce qualification
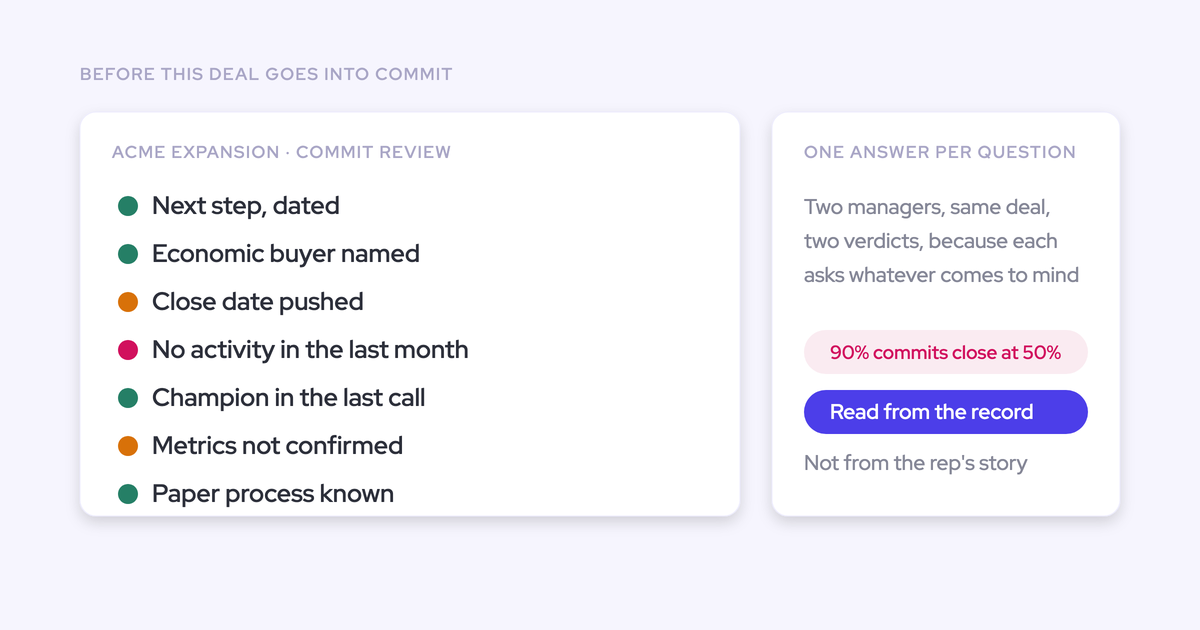
Qualification frameworks break when they depend on memory. A rep may identify the Economic Buyer on a call and still forget to update the field. Two weeks later, the opportunity sits in Commit with a blank buyer field and the forecast looks stronger than it should.
AI helps only if methodology capture is tied to your actual sales process. The right setup extracts MEDDIC, SPICED, or your internal qualification fields from transcript data, syncs them to Salesforce, and ties stage movement to completion rules.
- Define the exact fields your methodology requires in Salesforce—such as pain, metrics, champion, Economic Buyer, decision criteria, next step, and mutual action plan.
- Create AI templates that detect those concepts from call transcripts and meeting summaries.
- Map each extracted concept to the correct Salesforce field, including any custom fields your team uses for MEDDIC or SPICED.
- Set overwrite rules so AI updates blank fields automatically and flags conflicts when the existing value and transcript evidence don’t match.
- Use Salesforce validation rules or Flow to block stage advancement when required qualification fields are missing.
- Review methodology completion rates every week by rep and manager, not just at quarter end.
Example: if a deal reaches proposal stage with no Economic Buyer identified, the forecast may still treat it as viable. In practice, that missing field often means the deal is single-threaded, procurement timing is unclear, and commit confidence is overstated.
Drive CRM field completion based on stage exits
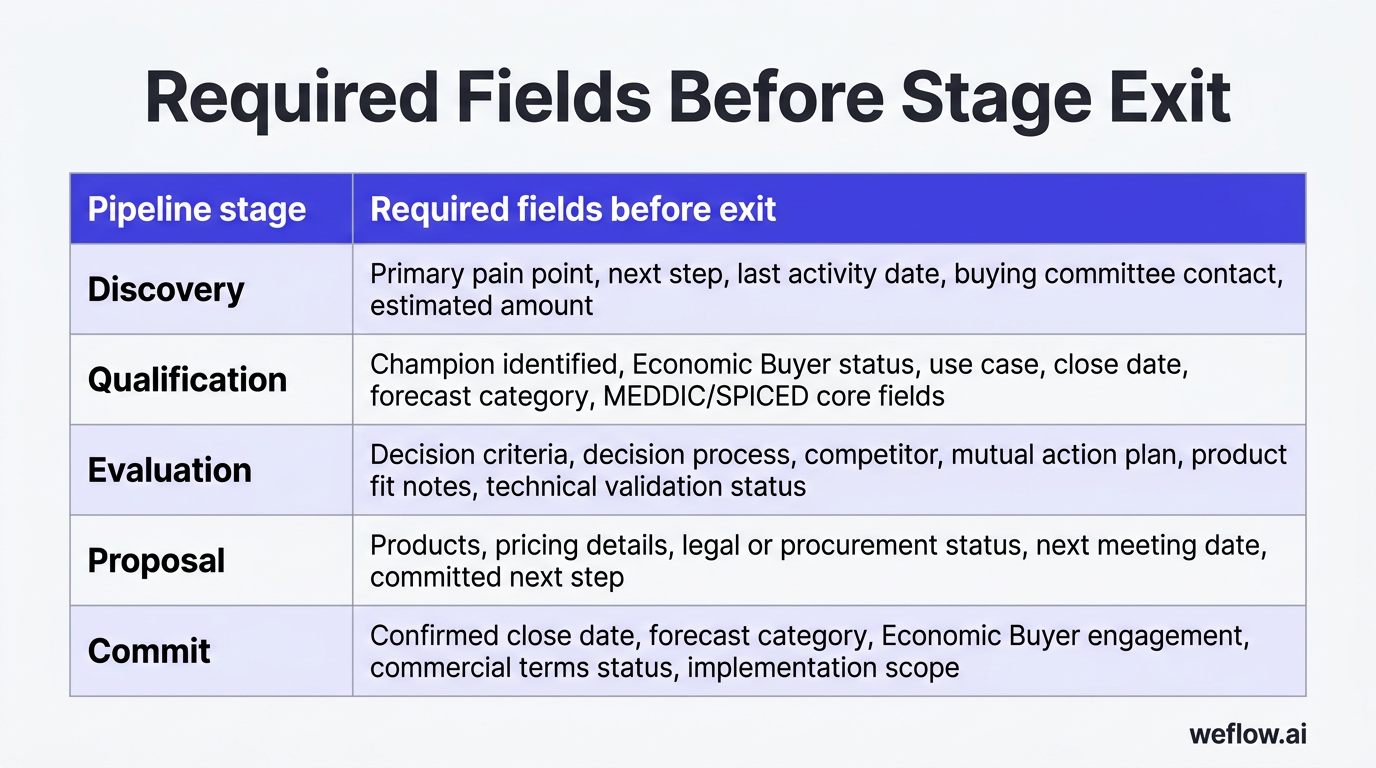
Field completion should not depend on manager reminders. The cleaner approach is to define required fields by stage exit, then use AI to surface missing data before the deal moves forward. Salesforce validation rules enforce the process, while AI speeds up field completion by proposing updates from activity and transcript data.
Baseline target: 90%+ required-field completion across open opportunities should be normal, not aspirational. If your team is far below that threshold, reporting accuracy is already compromised.
| Pipeline stage | Required fields before exit |
|---|---|
| Discovery | Primary pain point, next step, last activity date, buying committee contact, estimated amount |
| Qualification | Champion identified, Economic Buyer status, use case, close date, forecast category, MEDDIC/SPICED core fields |
| Evaluation | Decision criteria, decision process, competitor, mutual action plan, product fit notes, technical validation status |
| Proposal | Products, pricing details, legal or procurement status, next meeting date, committed next step |
| Commit | Confirmed close date, forecast category, Economic Buyer engagement, commercial terms status, implementation scope |
Once stage-based completion is in place, build a hygiene dashboard that shows completion rate by rep, manager, and region. That gives RevOps a clear view of where the process is breaking—rep behavior, Salesforce validation logic, or weak AI write-back.
Pipeline visibility signals: spot deal risks before they slip
Traditional pipeline management is still built around interrogation. On Friday, managers ask reps whether a deal is real, why the close date moved, and whether the buyer has gone quiet. AI changes that rhythm by surfacing warnings, signals, and focused views before the meeting starts.
Use the framework this way: warnings tell you which deals need attention now, signals explain why, and views organize the work by use case and owner. If no one owns the review cadence, even the best signals will sit unused.
Configure AI warnings for at-risk opportunities
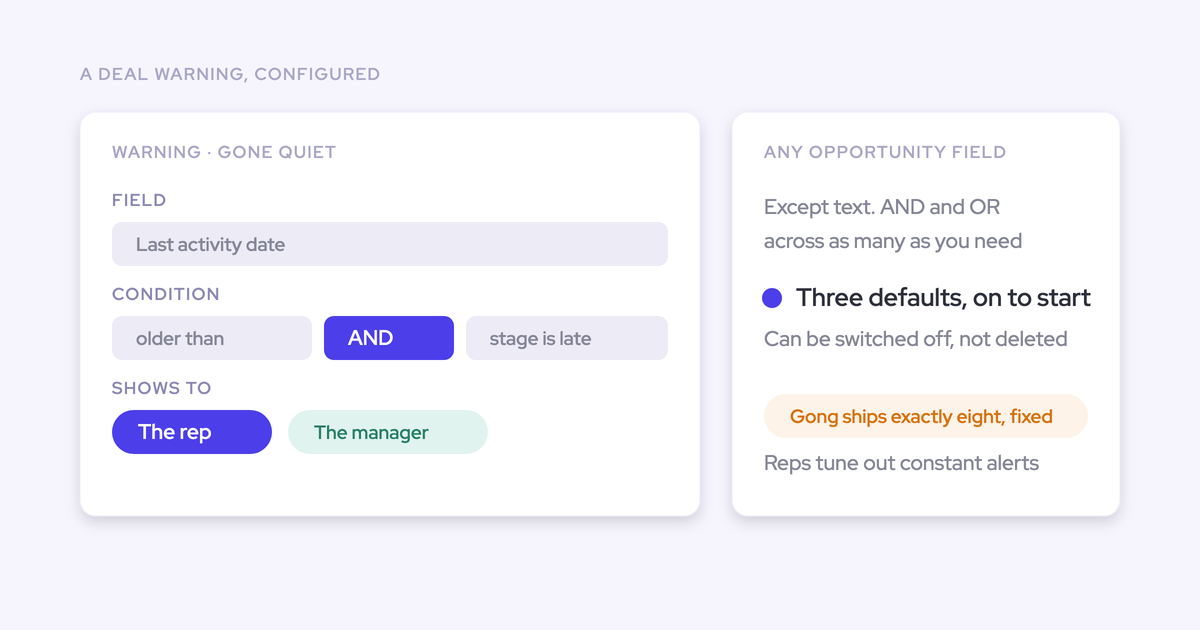
Warnings are the first layer of intervention. They should trigger automatically, route to the right manager, and get reviewed on a standing Monday cadence before the broader pipeline call.
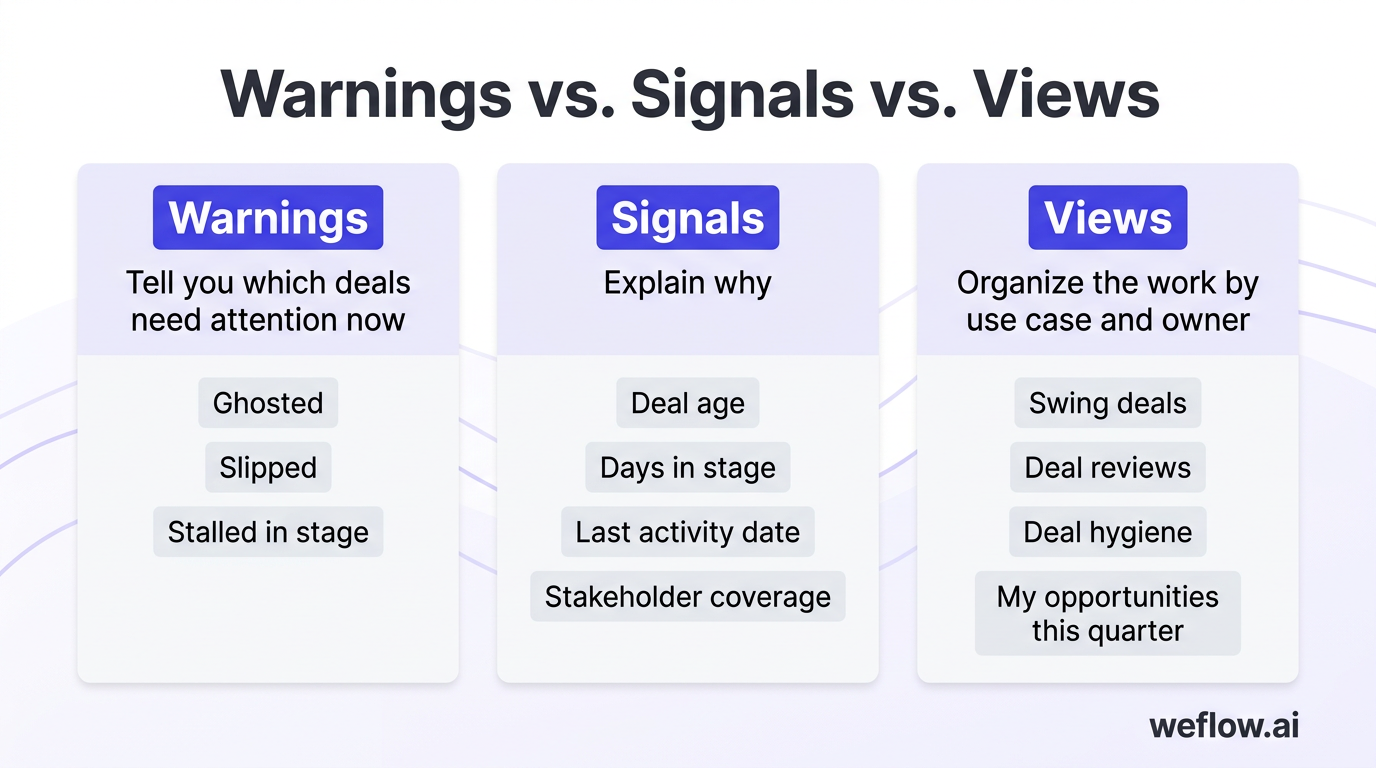
- Ghosted: no prospect response or no customer activity for 14+ days.
- Slipped: close date pushed more than twice or pushed inside the same quarter.
- Stalled in stage: days in stage exceed the normal range for that segment or motion.
- Single-threaded: only one engaged contact across the opportunity.
- No access to power: no Economic Buyer identified or no senior stakeholder in recent meeting activity.
- Cycle overdue: opportunity age exceeds average sales cycle for similar deals.
- No next meeting: no confirmed customer meeting scheduled for an active late-stage deal.
- Activity gap: no email or meeting activity logged in the last defined window.
For enterprise deals, single-threaded and no access to power are usually the most important warnings to review first. Large deals rarely fail because of one missing follow-up email. They fail because the team never built enough stakeholder coverage or never reached the person who can approve the spend.
Track deal signals to prioritize weekly reviews
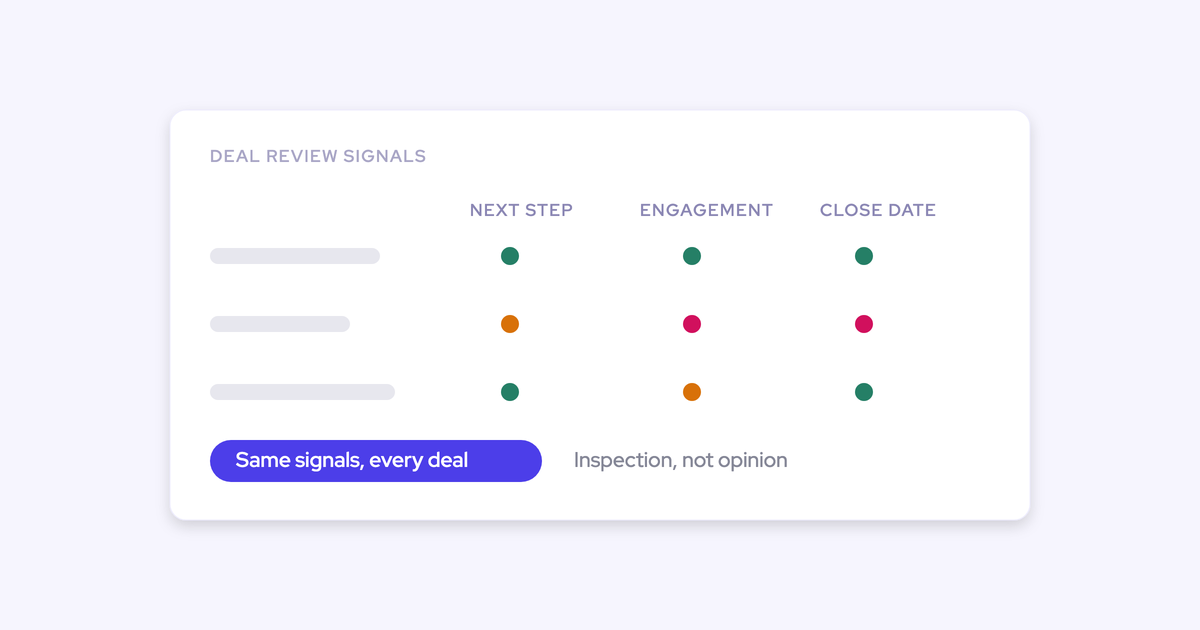
Signals are the ongoing indicators behind the warnings. Add them as columns in Salesforce pipeline views so reps and managers see them during daily work, not only in a separate dashboard. That’s what makes them useful in 1:1s and weekly forecast reviews.
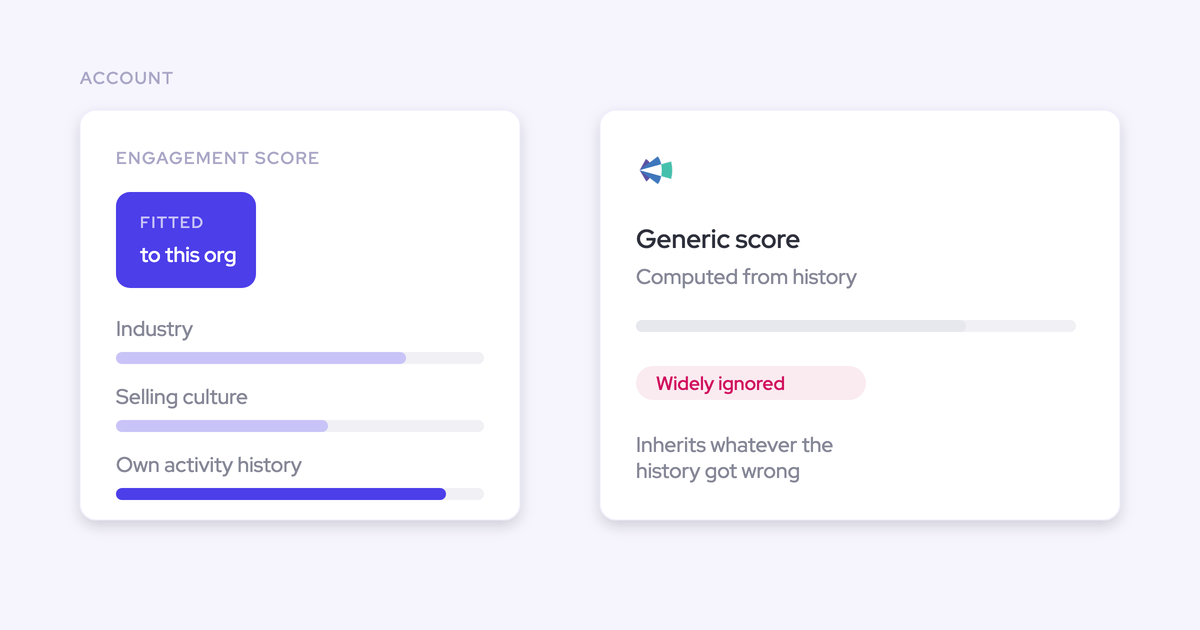
An inactivity score is especially useful because it gives you an objective read on deal health. A rep’s gut feel may still be positive after a “good conversation,” but if there’s been no buyer reply, no meeting booked, and no new stakeholders added, the score should reflect that reality.
Essential signals to track in every pipeline view
- Deal age: total days since opportunity creation.
- Days in stage: time spent in the current stage against benchmark.
- Last activity date: most recent customer-facing interaction written back to Salesforce.
- Inactivity score: weighted score based on gaps in response, meetings, and new engagement.
- Engagement score: depth and frequency of activity across contacts and meetings.
- Next meeting date: whether the deal has forward momentum on the calendar.
- Close date pushed: count of close date changes over the deal lifetime.
- Stakeholder coverage: number of engaged buyer-side contacts and role mix.
Train reps to check these signals before outreach. That shifts pipeline management from “Which deals feel close?” to “Which deals show enough buyer behavior to justify time and forecast weight?”
Build pipeline views for specific sales use cases
One giant dashboard usually turns into noise. A better operating model is one view per use case, with clear ownership and a review cadence that matches the job to be done.
Separating swing deals from the general pipeline matters because it isolates forecast volatility. If that view sits next to early-stage pipeline creation, late-quarter surprises are easier to miss.
| View name | Owner | Review cadence |
|---|---|---|
| Swing deals | Sales manager | Every Monday and before forecast calls |
| Deal reviews | Sales manager and AE | Weekly 1:1s |
| Deal hygiene | Rep, with RevOps oversight | Every Friday before weekly reviews |
| Renewal pipeline | CS leader or renewals manager | Monthly |
| Expansion pipeline | Account manager or sales manager | Monthly |
| Next quarter pipeline | RevOps and managers | Biweekly |
| My opportunities this quarter | AE | Daily |
Pipeline dashboards: track metrics that drive sales decisions
Most sales orgs don’t have too little reporting. They have too much reporting with too little operational value. The right dashboards tell the team what changed, where risk is building, and what needs a manager decision this week. They also depend on the capture layer from section one—if Salesforce write-back is weak, dashboard polish won’t fix it.
Monitor pipeline health to identify forecast gaps
These are the daily and weekly metrics that let RevOps and sales leadership explain pipeline movement without another spreadsheet pull.
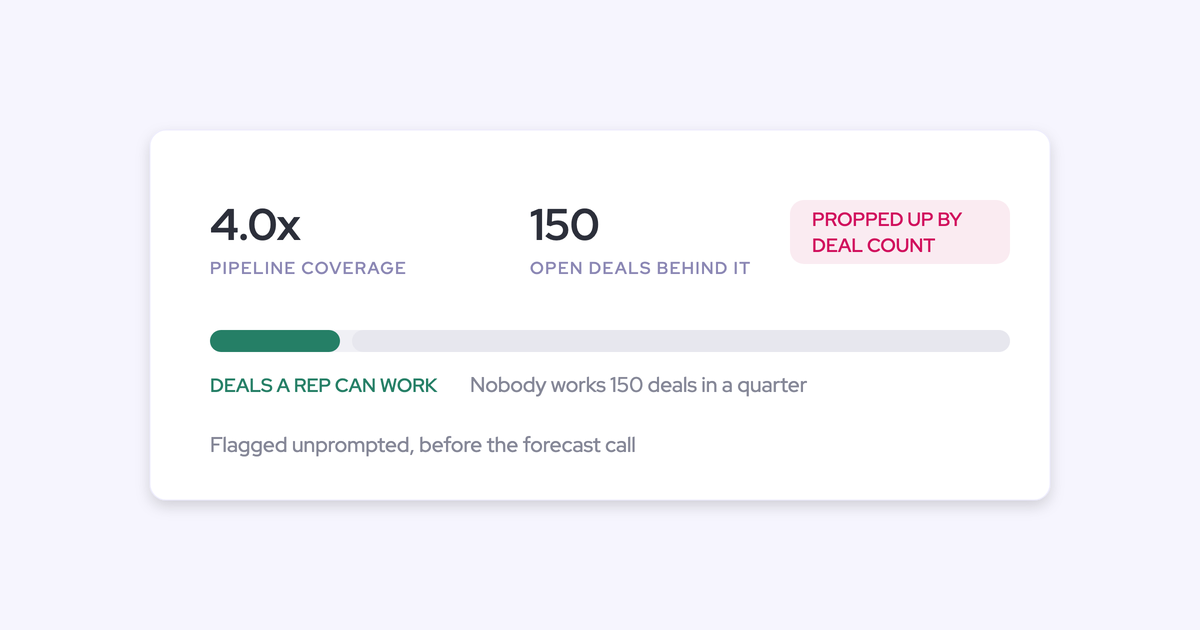
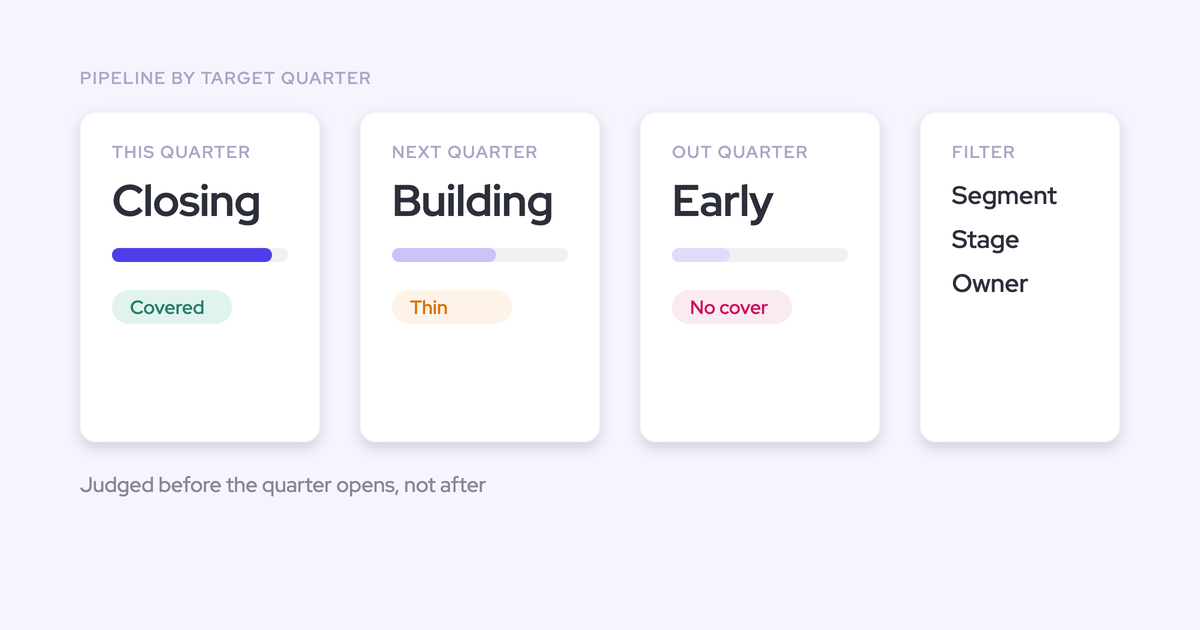
- Pipeline coverage ratio: review weekly by segment and territory. Typical target is 3-4x for enterprise and 5-6x for mid-market.
- Pipeline value and pacing: compare current open pipeline against in-quarter target and pace needed to hit the number. Flag any team consistently below target coverage for 2+ weeks.
- Pipeline waterfall: track week-over-week movement across new pipeline, slipped deals, closed won, and closed lost. If leadership asks why the forecast changed, this is the clearest chart to answer with evidence.
- Stage conversion rate: measure how deals move from stage to stage by segment, region, and manager. Sudden drops usually point to qualification issues or stage definition drift.
- Win rate: use a baseline of 20-30% for overall B2B SaaS and 15-25% for enterprise motions, then track deviation by team.
- Sales cycle length: review by segment to catch lengthening cycles early. Mid-market often falls in the 3-6 month range; enterprise often runs 6-12+ months.
The pipeline waterfall matters because it explains forecast movement in operational terms. Instead of saying “the number got softer,” you can show that one region added $400k in new pipeline, another slipped $600k from late stage, and commit stayed flat because stakeholder coverage weakened on three large deals.
Assess team performance to find coaching moments
Manager dashboards should help with rep coaching, not just rep inspection. The useful question isn’t whether a rep is behind. It’s where the execution gap shows up in the data.
| Metric | Coaching application |
|---|---|
| Win rate | Shows whether a rep needs help with qualification, deal control, or competitive positioning when compared with team and segment averages. |
| At-risk opportunity recovery rate | Shows whether the rep can act on warnings early enough to recover deals before they slip. |
| Forecast vs. actuals | Shows whether the rep consistently over-commits, under-calls, or misreads late-stage buyer behavior. |
| Average time in stage | Shows which sales skill needs work. Long discovery may signal weak questioning, while long proposal cycles may point to poor mutual action planning or weak access to power. |
| Activity completeness | Shows whether missing data is masking the true state of the rep’s pipeline. |
Average time in stage is one of the most useful manager metrics because it points to a specific coaching problem. If one rep’s deals sit twice as long in qualification, the issue is rarely “work harder.” It’s usually weak discovery, poor stakeholder mapping, or inconsistent stage exit discipline.
Review strategic metrics for board-level reporting
Board and QBR reporting should explain how the revenue engine is performing, where leakage exists, and which risks are building across new business and retention.
- Pipeline flow report: use a Sankey-style view to show how opportunities move through each stage, where volume drops off, and where conversion improves or weakens quarter over quarter.
- Competitor report: track competitor mentions from call transcripts alongside win rates, loss rates, and segment mix so enablement teams update battlecards from buyer language, not rep memory.
- Deal momentum report: measure the share of active opportunities with confirmed next steps, recent engagement, and multi-threaded buyer activity versus those that are drifting.
- Retention and churn risk report: combine CS health scores, renewal timing, support burden, product usage, and open expansion pipeline to give leadership a single view of net revenue retention risk.
That last report matters more than most teams realize. When you combine CS health and open pipeline data in Salesforce, leadership gets a clearer view of NRR—not just renewal exposure, but whether healthy accounts also show real expansion potential.
Automated reporting workflows: replace manual pipeline tasks
Once data capture, warnings, and dashboards are in place, the next step is automation. Each workflow should have a clear trigger, defined inputs, one AI task, and a specific output the team can use immediately. Implement them one at a time so adoption stays high and the ops team can validate the output before adding the next layer.
Run pipeline hygiene checks before weekly reviews
This workflow replaces manual CRM cleanup before Monday pipeline meetings. It should run early enough on Friday for reps to fix records before the weekend and for managers to start Monday with a clean view.
| Trigger | Input | AI action | Output |
|---|---|---|---|
| Every Friday morning | All open opportunities with stage, last activity date, close date history, forecast category, amount, and required fields | Flags no activity in 14+ days, past close dates, repeated close date pushes, and missing required fields by stage | Rep-specific hygiene report grouped by issue type, sent before end of day Friday |
This workflow usually removes the first 15 minutes of wasted time from the standard pipeline meeting. Instead of asking reps to fix records live, managers start with cleaned data and move straight to deal strategy.
Assess deal risk to replace subjective scoring
Most deal scoring is still sentiment dressed up as process. A rep says a deal feels strong, a manager disagrees, and nobody has evidence beyond scattered notes. AI risk scoring works better when it pulls from activity history, stage movement, and call transcripts together.
| Trigger | Input | AI action | Output |
|---|---|---|---|
| Every Monday before pipeline review, plus any stage regression or inactivity event | Opportunity fields, stage history, last 2-3 call transcripts, recent email and meeting activity, next step data | Scores deal health from 1-10, identifies top risks, and recommends the next action for the rep | Flagged deal list for managers with evidence-based risk notes |
Reps trust this more when the system cites transcript evidence directly. “Economic Buyer still not confirmed after pricing review” is more credible than a vague low score with no explanation.
Analyze pipeline coverage to direct SDR activity
Coverage analysis should not live in a spreadsheet that gets updated after the meeting. If AI can calculate current coverage and compare it with segment-level benchmarks each week, SDR sourcing and outbound focus can adjust faster.
| Trigger | Input | AI action | Output |
|---|---|---|---|
| Weekly during pipeline review and monthly planning | Open pipeline by stage, team, territory, quota target, and historical win rates | Calculates coverage ratio, flags gaps against benchmark, and recommends which teams or territories need more sourced pipeline | Coverage report by team and territory with gap flags and sourcing direction |
This workflow also helps with next-quarter planning. If the same territory shows a coverage gap for 3 straight weeks, that belongs in headcount, territory design, and pipeline generation planning—not just in the SDR standup.
Predict forecast outcomes using historical data
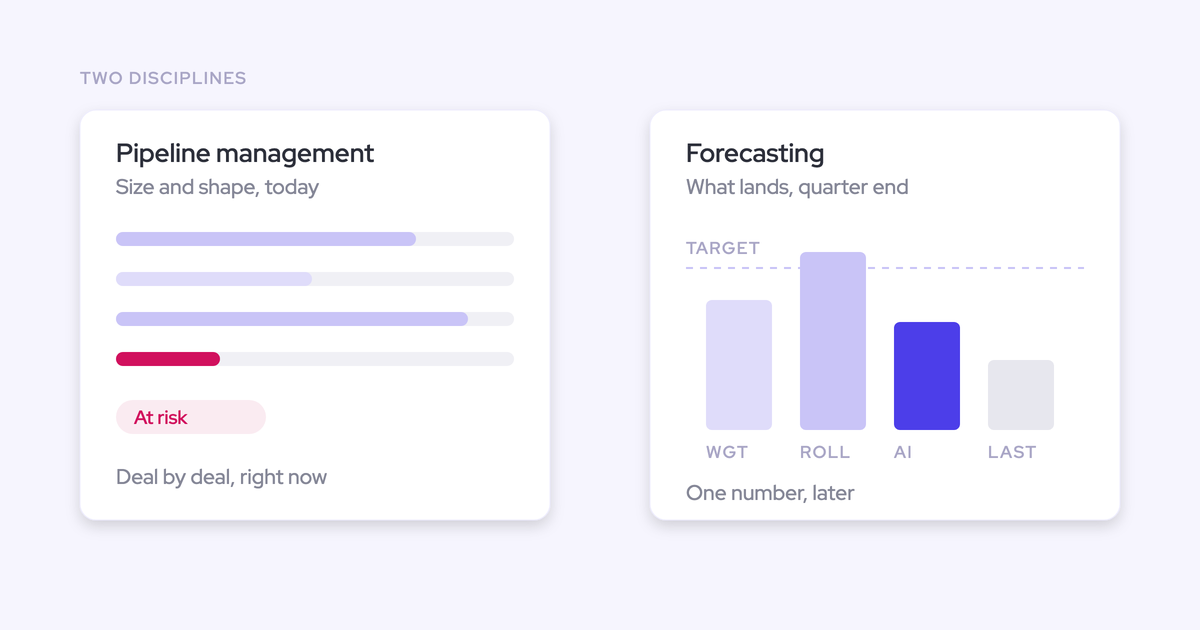
Weekly forecasting improves when managers can compare rep commits with an AI base case built from historical conversion data and current pipeline conditions. The point is not to replace manager judgment. It’s to expose where judgment and data disagree.
| Trigger | Input | AI action | Output |
|---|---|---|---|
| Every Friday before the forecast call and at the start of each month | Current quarter pipeline, stage mix, forecast category, historical win rates by stage and segment, and major known variables | Builds a base-case forecast, identifies deals carrying the most upside or risk, and compares predicted outcomes with rep-submitted commits | Forecast report by rep and segment with variance analysis |
The gap between the AI prediction and the rep commit is often the most useful conversation in the forecast review. If the rep is calling $800k and the model says $520k, the manager can focus on the specific deals causing the gap instead of debating general optimism.
Extract win/loss patterns from closed deal data
Win/loss analysis usually fails because the data source is weak. A generic closed-lost reason picklist tells you almost nothing about why the buyer actually walked away. Transcript analysis adds the missing detail.
| Trigger | Input | AI action | Output |
|---|---|---|---|
| Monthly or quarterly after a meaningful batch of deals closes | Closed-won and closed-lost opportunity data, closed-lost reasons, transcript summaries, and sales notes from the prior 30-90 days | Identifies top loss reasons, winning patterns, segment differences, and competitor-specific trends using transcript evidence | Structured win/loss report for sales leadership, enablement, and RevOps |
This is a better operating model than asking reps to choose from a closed-lost dropdown after the deal is gone. Transcript evidence captures what buyers actually said about budget, timing, product fit, procurement friction, and competitive pressure.
FAQ
What is AI pipeline visibility?
AI pipeline visibility is the use of artificial intelligence to keep Salesforce current without relying on manual CRM entry for every update. In practice, that means capturing emails and meetings, extracting deal context from call transcripts, flagging risk signals, and showing managers a live view of deal health before the forecast call.
How does AI improve forecast accuracy?
AI improves forecast accuracy by reducing the gap between what buyers are doing and what Salesforce says is happening. Instead of relying only on rep judgment, it uses historical conversion rates, stage behavior, activity completeness, stakeholder coverage, and transcript evidence to build a more objective base case.
Which CRM fields should AI update automatically?
The highest-value fields are activity logs, last activity date, next meeting date, next step, methodology fields such as MEDDIC or SPICED, competitor, and stage-exit fields tied to forecast quality. The best rule is to let AI auto-fill blank fields with clear transcript or activity evidence, then use Salesforce validation rules to stop stage movement when required data is still missing.
How do AI deal signals differ from standard data?
Standard pipeline data is usually static and manually maintained—stage, amount, close date, and forecast category. AI deal signals are calculated continuously from new buyer behavior, so they can show weakening engagement, rising inactivity, shallow stakeholder coverage, or late-stage slippage even before a rep changes the opportunity record.