How to Measure Sales Pipeline Health: KPIs and Weekly Review Process
Learn which sales pipeline health KPIs to track and how to run a weekly review process.





What Is Sales Pipeline Health and Why Does It Matter?
Sales pipeline health measures whether your pipeline will reliably convert into revenue at the rate and speed you need to hit quota. A healthy pipeline has the right mix of deal stages, moves at a predictable velocity, and contains deals that are actually progressing toward close. An unhealthy pipeline creates forecast surprises, wasted rep time on dead deals, and end-of-quarter scrambles.
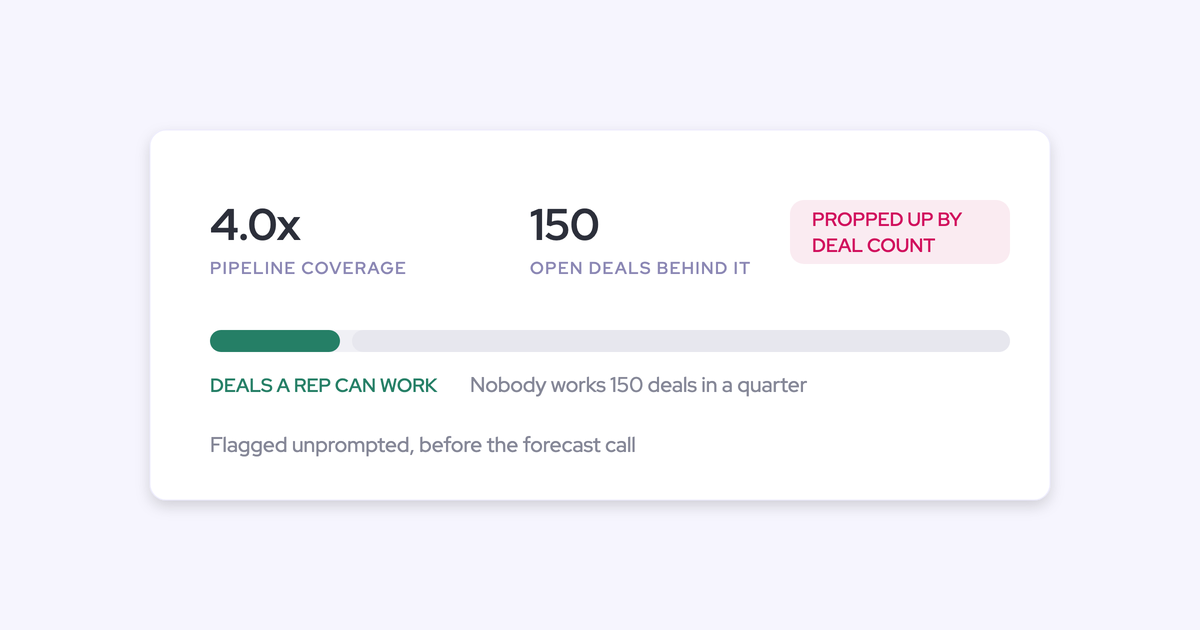
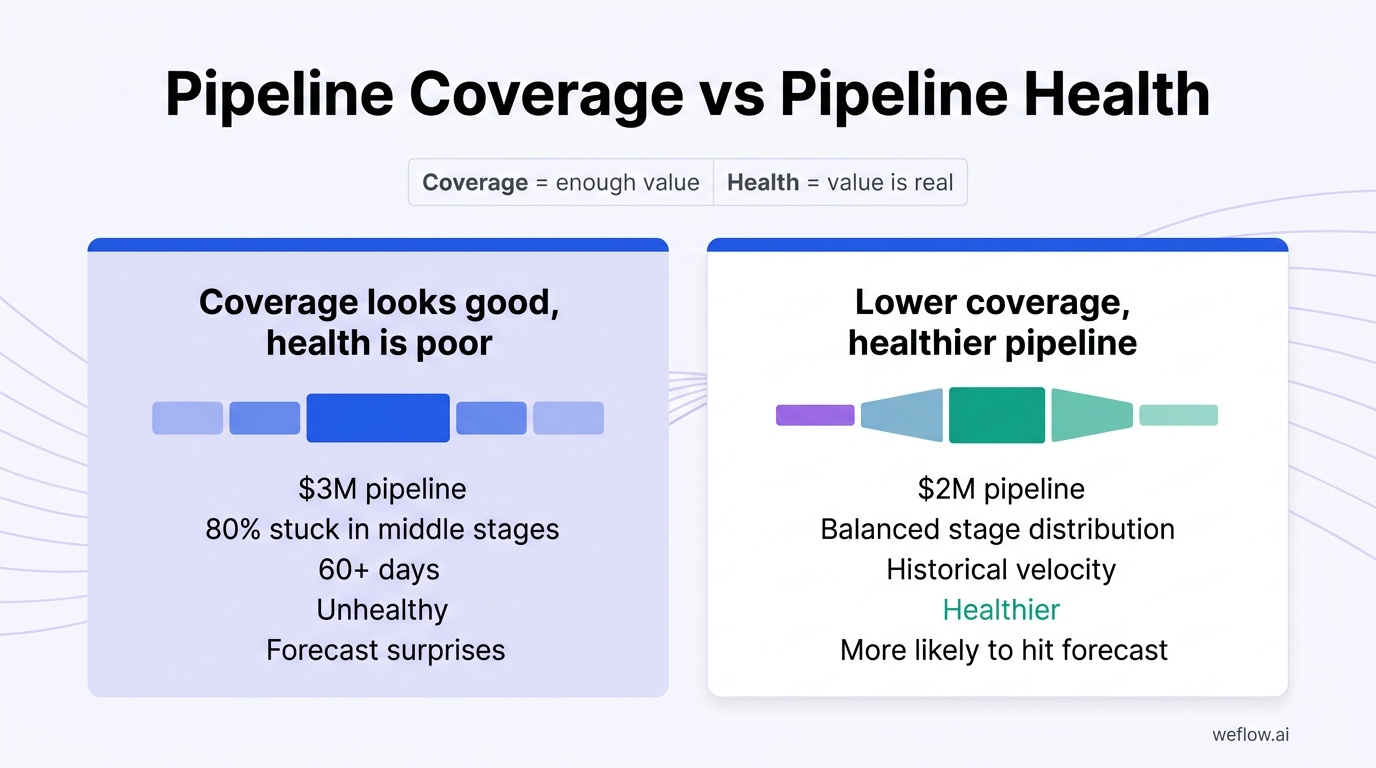
Pipeline health is not the same as pipeline coverage. Coverage tells you if you have enough total value in the pipe. Health tells you if that value is real. A $3M pipeline with 80% of deals stuck in middle stages for 60+ days is unhealthy regardless of coverage ratio. A $2M pipeline with balanced stage distribution and deals moving at historical velocity is far more likely to hit forecast.
RevOps leaders and sales managers who track pipeline health catch problems early: deals that have stalled, stages where conversion drops, reps who are padding their pipeline with low-probability opportunities. Without regular health checks, you discover pipeline problems at the worst possible time—during the forecast call when it's too late to recover.
5 Common Sales Pipeline Health Problems (and How to Spot Them)
| Problem | Symptom | Risk |
|---|---|---|
| Stale deals | Deals sitting in the same stage for 1.5x or longer than the average duration for that stage, with no logged activity in 14+ days | Inflated pipeline coverage that collapses at quarter-end; forecast misses |
| Stage bottleneck | Disproportionate deal volume in one or two middle stages (the “bloated middle” shape); conversion rate drops sharply at a specific stage | Predictable stall pattern that tanks velocity; deals age out before reaching decision |
| Insufficient top-of-funnel | Pipeline generation rate declining quarter-over-quarter; new opportunity count below the level needed to sustain coverage | Coverage gaps emerge 1-2 quarters out; quota misses become structural |
| Ghost pipeline | High percentage of deals with no recent activity (emails, calls, meetings) despite “active” stage status | Forecasted deals that have actually gone dark; reps clinging to dead opportunities |
| Unqualified pipeline | High volume of early-stage deals that never advance past discovery; low Stage 1 to Stage 2 conversion rate | Wasted rep time on non-buyers; misleading coverage metrics |
3 KPIs to Measure Sales Pipeline Health
Pipeline Coverage Ratio: Formula, Example, and Limitations
Pipeline coverage ratio compares your total pipeline value to your sales quota or target. It answers: do you have enough opportunities in the pipe to hit your number, assuming historical win rates hold?
Pipeline Coverage Ratio = Total Pipeline Value / Sales Target
Worked example: Your quarterly quota is $500,000. Your total pipeline value across all open opportunities is $1,750,000.
Pipeline Coverage Ratio = $1,750,000 / $500,000 = 3.5x
The standard benchmark is 3x to 4x coverage for a quarterly target. At 3.5x, this pipeline appears healthy by the coverage metric.
Limitations: Raw pipeline coverage treats a $100k deal in discovery the same as a $100k deal in negotiation. It ignores stage, deal age, and activity signals. A 4x pipeline full of early-stage or stalled deals will not convert at the rate the ratio implies. Use coverage as a directional indicator, not a forecast.
Adjusted Pipeline Coverage Ratio: How to Weight Deals by Close Probability
Adjusted pipeline coverage weights each deal by its probability of closing. This gives you a more accurate picture of likely revenue than raw coverage.
Adjusted Pipeline Coverage Ratio = Total Weighted Pipeline Value / Sales Target
Worked example: Same $500,000 quarterly quota. Your pipeline contains four deals:
| Deal | Value | Stage | Close Probability | Weighted Value |
|---|---|---|---|---|
| Acme Corp | $400,000 | Discovery | 10% | $40,000 |
| Beta Industries | $250,000 | Evaluation | 30% | $75,000 |
| Gamma Tech | $600,000 | Proposal | 50% | $300,000 |
| Delta Co | $500,000 | Negotiation | 75% | $375,000 |
Total weighted pipeline value calculation:
- $400,000 x 0.10 = $40,000
- $250,000 x 0.30 = $75,000
- $600,000 x 0.50 = $300,000
- $500,000 x 0.75 = $375,000
- Total = $790,000
Adjusted Pipeline Coverage Ratio = $790,000 / $500,000 = 1.58x
The raw coverage for this pipeline is 3.5x ($1,750,000 / $500,000). The adjusted coverage is 1.58x. This pipeline is undercovered when you account for actual close probability—the $400k discovery deal and $250k evaluation deal are unlikely to close this quarter.
Set your probability weights based on historical stage-to-close conversion data from your own Salesforce records, not industry benchmarks. Your sales cycle and qualification criteria are unique.
Pipeline Hygiene Score: How to Calculate and Benchmark Data Quality
Pipeline hygiene score measures the data quality and maintenance of your pipeline. Poor hygiene—missing fields, outdated close dates, no recent activity—undermines every other metric you track.
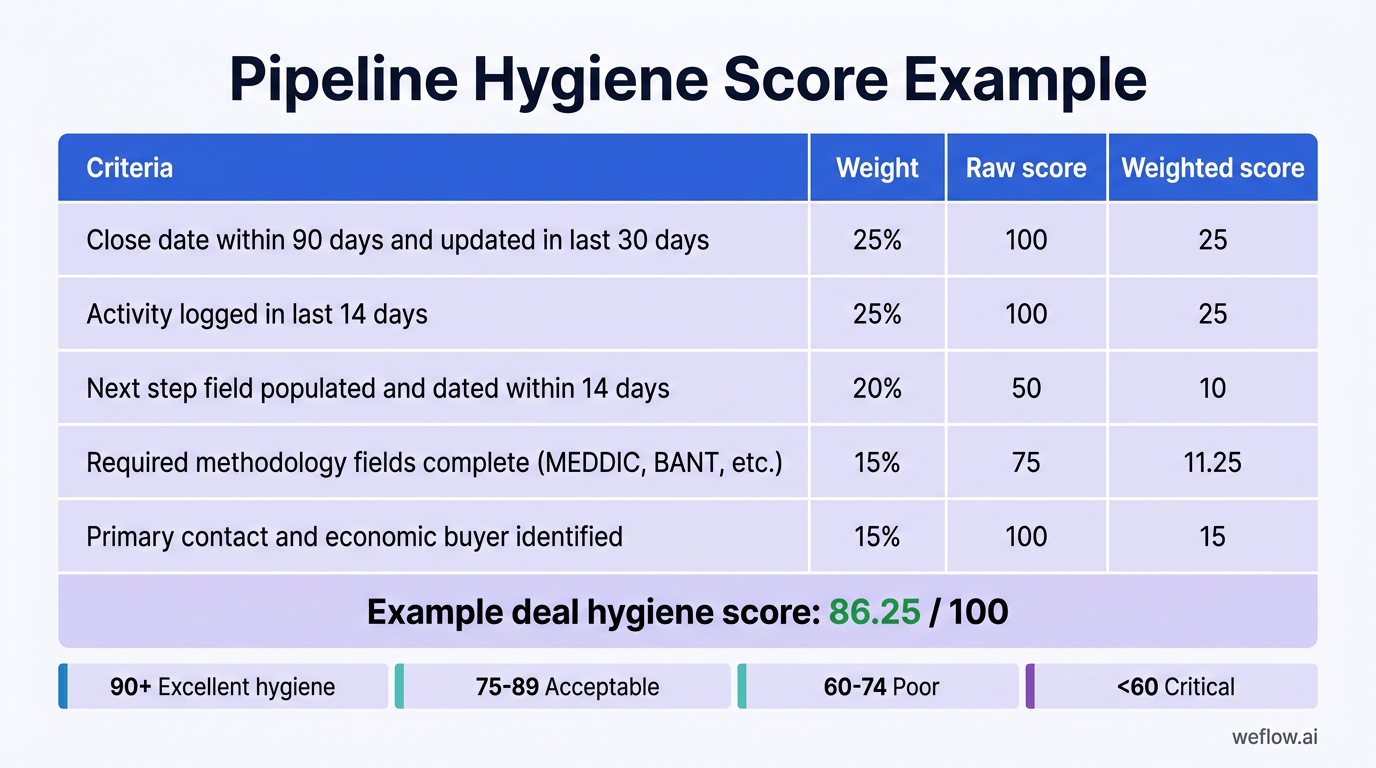
Sample scoring methodology: Score each deal on multiple criteria, weight by importance, and calculate a composite score per deal. Average across the pipeline for an overall hygiene score.
| Criteria | Weight | Scoring Rule | Example Raw Score | Weighted Score |
|---|---|---|---|---|
| Close date within 90 days and updated in last 30 days | 25% | Yes = 100, No = 0 | 100 | 25 |
| Activity logged in last 14 days | 25% | Yes = 100, No = 0 | 100 | 25 |
| Next step field populated and dated within 14 days | 20% | Yes = 100, Partial = 50, No = 0 | 50 | 10 |
| Required methodology fields complete (MEDDIC, BANT, etc.) | 15% | 100% = 100, 75% = 75, <75% = 25 | 75 | 11.25 |
| Primary contact and economic buyer identified | 15% | Both = 100, One = 50, Neither = 0 | 100 | 15 |
Example deal hygiene score: 86.25 / 100
Benchmarks:
- 90+ = Excellent hygiene; data is trustworthy for forecasting
- 75-89 = Acceptable; some deals need attention
- 60-74 = Poor; forecast accuracy is compromised
- <60 = Critical; pipeline data cannot support accurate forecasting
Run this score weekly and track trends. A declining hygiene score usually precedes a quarter of forecast surprises.
Stage-by-Stage Conversion Rates: The Metric Every Sales Leader Needs
Stage-by-stage conversion rate measures the percentage of deals that advance from one stage to the next. This is the metric that reveals exactly where your pipeline leaks.
Stage Conversion Rate = (Deals that advanced to next stage / Deals that entered current stage) x 100
How to calculate:
- Pick a cohort time period (e.g., all deals that entered Stage 2 in Q1)
- Count how many of those deals advanced to Stage 3 (regardless of when)
- Divide to get the conversion rate
Worked example:
| Stage Transition | Deals Entered | Deals Advanced | Conversion Rate |
|---|---|---|---|
| Discovery to Qualification | 100 | 65 | 65% |
| Qualification to Evaluation | 65 | 45 | 69% |
| Evaluation to Proposal | 45 | 28 | 62% |
| Proposal to Negotiation | 28 | 22 | 79% |
| Negotiation to Closed Won | 22 | 18 | 82% |
Overall funnel conversion: 18% (18 closed won / 100 entered discovery)
What healthy rates look like: Conversion rates vary by deal size, sales motion, and industry. B2B enterprise deals typically show 60-75% conversion in early stages (where unqualified deals get filtered) and 75-90% in late stages (where only real deals remain). The pattern should narrow as deals progress—if late-stage conversion drops below 70%, your qualification criteria or proposal process has problems.
[banner type="download" url="https://www.weflow.ai/resources/cheat-sheets/pipeline-visibility-cheat-sheet" text="Pipeline Visibility Cheat Sheet" subtitle="Spot stalled deals and ghost pipeline before they wreck your forecast" button="Get the cheat sheet"]
Finding pipeline leaks:
- Compare each stage’s conversion rate to your historical baseline
- A stage where conversion drops 10+ percentage points below historical average is a leak
- Investigate by looking at deal attributes that predict failure at that stage (deal size, competitor presence, missing stakeholder access)
- Look for rep-level variance—one rep with 40% conversion at Stage 3 while the team averages 65% signals a coaching opportunity
Track conversion rates monthly. Sudden drops signal process problems, competitive shifts, or market changes that require immediate attention.
3 Diagnostic Questions to Assess Your Pipeline’s Health
What Shape Is Your Sales Pipeline—Funnel, Champagne Glass, or Bloated Middle?
Pipeline shape reveals structural health at a glance. Pull a report showing deal count by stage and map the distribution.
Healthy funnel shape: More deals in early stages, progressively fewer deals in each subsequent stage. This shape indicates steady qualification—unfit deals exit early, leaving qualified opportunities to progress. Example: 100 in Discovery, 65 in Qualification, 40 in Evaluation, 25 in Proposal, 15 in Negotiation.
Champagne glass shape: Wide at the top (many early-stage deals), narrow in the middle (aggressive qualification), then widening slightly in late stages (deals accumulate near close). This shape is common in high-velocity sales motions with strict qualification and longer negotiation cycles. It’s healthy if the late-stage deals are actually progressing.
Bloated middle shape: Few early-stage deals, a large concentration in mid-stages, then fewer in late stages. This is a warning sign. Deals are entering but stalling before reaching decision. Common causes: unclear qualification criteria, deals advancing without genuine buyer commitment, reps avoiding the hard work of disqualifying or advancing stuck deals.
What to do:
- If you see a bloated middle, audit the deals in your largest stage. How many have activity in the last 14 days? How many have exceeded average stage duration?
- If late stages are thin, check whether your pipeline generation rate is declining or if deals are stalling earlier in the process
- Weflow’s pipeline views let you visualize deal distribution by stage and flag deals exceeding stage duration thresholds
Is Your Pipeline Generation Rate Keeping Pace with Quota?
Pipeline coverage ratio is a snapshot. Pipeline generation rate is a trend. A 4x coverage ratio means nothing if you’re adding pipeline at half the rate you’re closing and losing deals.
Pipeline Generation Rate = New Pipeline Value Created / Time Period
The key insight: You don’t need 3-4x coverage year-round if your pipeline generation rate consistently exceeds your close rate. A team closing $400k/month while generating $500k/month in new pipeline can operate at lower coverage ratios because new opportunities continuously replenish the funnel.
Benchmarks for B2B SaaS (mid-market):
- Healthy: Monthly pipeline generation is 1.2-1.5x monthly bookings target
- Warning: Pipeline generation equals or falls below monthly bookings target
- Critical: Pipeline generation is less than 0.8x monthly bookings target for two consecutive months
What to track:
- Weekly new opportunity count and value (not just monthly totals)
- Source distribution—if 80% of new pipeline comes from one source (outbound, inbound, partner), you’re exposed to channel risk
- Trend over rolling 8-12 weeks—single-week spikes or dips are noise; sustained trends are signal
When pipeline generation declines for 6+ weeks, you’ll feel it in 60-90 days when coverage gaps emerge and forecast pressure mounts.
How to Measure Sales Velocity and Identify Slow-Moving Deals
Sales velocity measures the dollar value of pipeline that moves through your funnel per day. It combines four factors: number of opportunities, average deal value, win rate, and sales cycle length.
Sales Velocity = (Number of Opportunities x Average Deal Value x Win Rate) / Average Sales Cycle Length
Worked example:
- 50 opportunities in pipeline
- $20,000 average deal value
- 25% win rate
- 60-day average sales cycle
Sales Velocity = (50 x $20,000 x 0.25) / 60 = $4,167 per day
This team produces $4,167 in closed-won revenue daily, or approximately $125,000 per month and $375,000 per quarter.
Using velocity to find slow-moving deals:
- Calculate your average sales cycle length overall and by stage
- Flag any deal exceeding 1.5x the average cycle length for its current stage
- Flagged deals require immediate review: Are they progressing? Is there a specific blocker? Should they be disqualified?
Example stage duration analysis:
| Stage | Average Duration | 1.5x Threshold | Action |
|---|---|---|---|
| Discovery | 12 days | 18 days | Review deals >18 days |
| Qualification | 15 days | 23 days | Review deals >23 days |
| Evaluation | 22 days | 33 days | Review deals >33 days |
| Proposal | 14 days | 21 days | Review deals >21 days |
| Negotiation | 18 days | 27 days | Review deals >27 days |
Velocity improvements come from four levers: more opportunities, larger deal sizes, higher win rates, or shorter cycles. Calculate velocity monthly to identify which lever is moving and whether the direction is positive.
What Pipeline Activity Signals Should You Monitor Weekly?
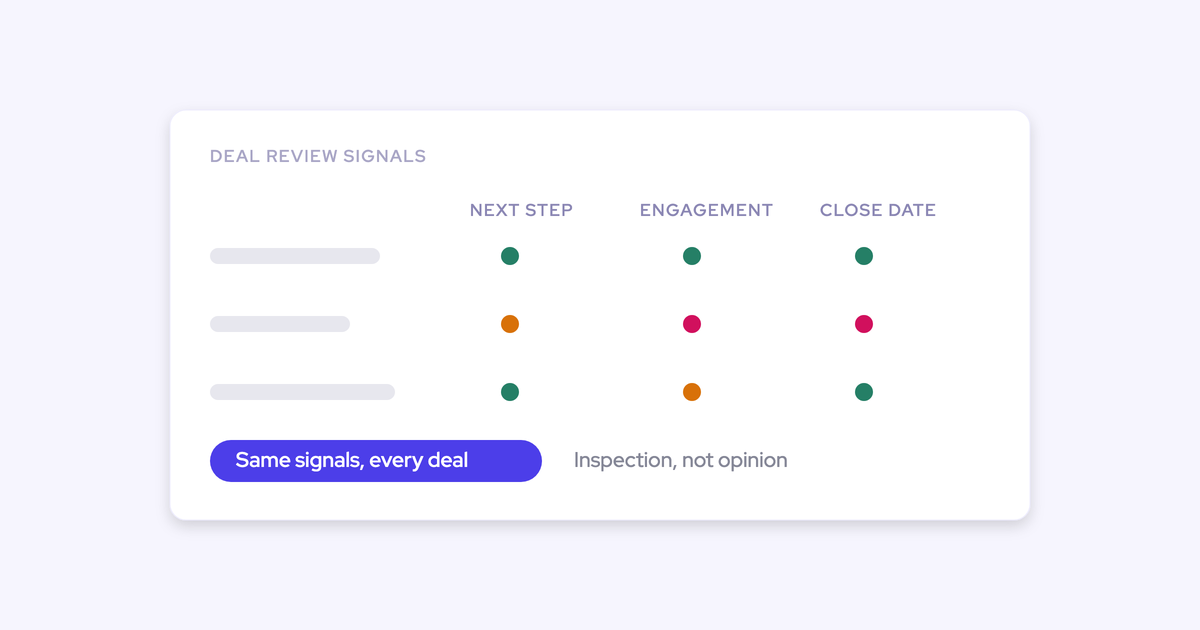
Activity signals tell you whether deals are alive or just occupying space in your pipeline. Monitor these three metrics weekly.
1. Percentage of deals with recent activity
Calculate the percentage of open opportunities that have at least one logged activity (email, call, meeting) in the last 14 days. A healthy pipeline should show 70%+ of deals with recent activity. Below 60% indicates widespread stagnation—deals are sitting without engagement.
2. Next-step coverage
[banner type="download" url="https://www.weflow.ai/resources/cheat-sheets/pipeline-management-guide" text="Pipeline Management Guide" subtitle="Run a weekly review that catches risk early instead of at quarter close" button="Get the guide"]
Percentage of deals with a populated next-step field and a next-step date within 14 days. Deals without a defined next step are not being actively worked. Target: 80%+ of pipeline value should have a next step scheduled.
3. Engagement signal distribution
Break down activity by type to identify engagement patterns:
- Email-only engagement (no calls or meetings) often signals deals where the prospect is politely responding but not seriously evaluating
- Meeting-heavy engagement correlates with deal progression
- Multi-threaded engagement (activities with multiple stakeholders) indicates deals with stronger buyer commitment
Weekly review checklist for activity signals:
- Which deals in my commit category have zero activity in the last 7 days?
- Which deals have had three+ emails with no meeting scheduled?
- Which late-stage deals have only single-threaded engagement?
Activity signals are leading indicators. Pipeline value is a lagging indicator. By the time coverage drops, the activity problem has already been in place for weeks.
How to Identify and Remove Stale Deals from Your Pipeline
Stale deals distort coverage ratios, waste forecast accuracy, and mislead sales leadership about true pipeline health. Removing them is uncomfortable but necessary.
Definition of a stale deal:
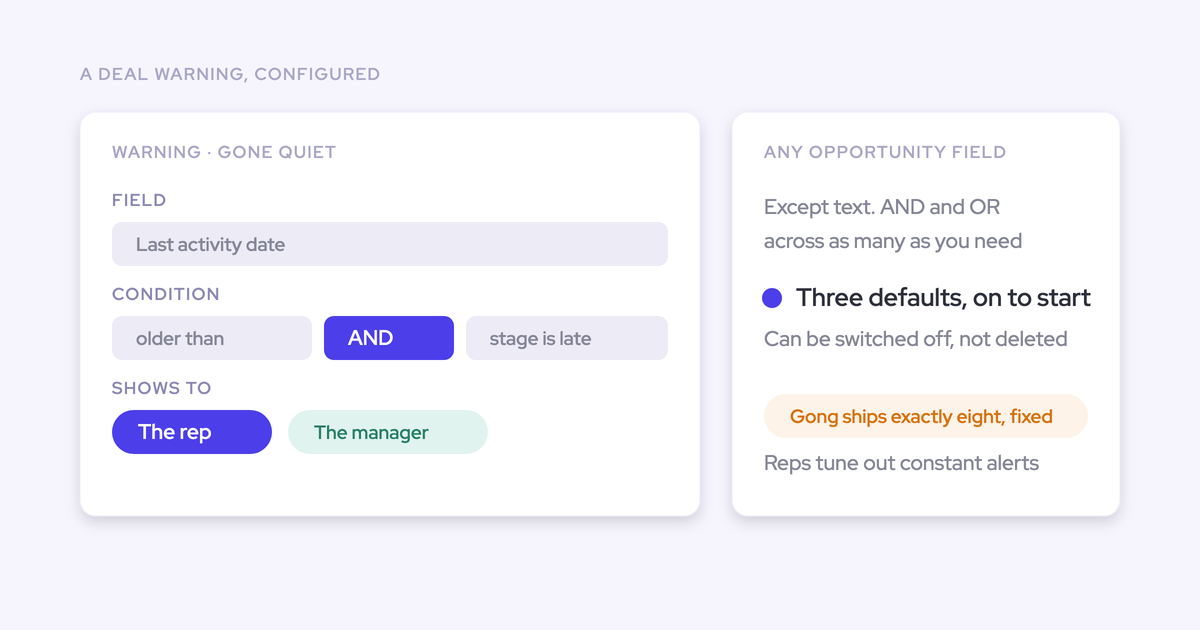
- In current stage longer than 1.5x the average duration for that stage, AND
- No logged activity (email, call, meeting) in the past 14-21 days
Both conditions should be met. A deal can be in a stage for an extended period if there’s active engagement (complex procurement processes, legal review). A deal with recent activity that’s only slightly over the stage duration may be progressing slowly but still alive.
Stale deal review process:
- Run a weekly report filtering for deals meeting both stale criteria
- For each stale deal, the deal owner must take one of three actions within 48 hours:
- Re-engage: Document specific outreach attempted and reschedule follow-up
- Update stage: Move to a more accurate stage if the deal has actually regressed
- Close as lost: Remove from pipeline with a loss reason
- Deals with no action taken after 48 hours should be escalated to the manager
Typical stale deal thresholds by stage:
| Stage | Average Duration | Stale After (1.5x) | Activity Window |
|---|---|---|---|
| Discovery | 10 days | 15 days | 14 days no activity |
| Qualification | 14 days | 21 days | 14 days no activity |
| Evaluation | 21 days | 32 days | 21 days no activity |
| Proposal | 14 days | 21 days | 14 days no activity |
| Negotiation | 18 days | 27 days | 21 days no activity |
Cleaning stale deals feels counterproductive in the short term—it reduces your coverage ratio. But accurate coverage based on real deals produces accurate forecasts. The CRO would rather know the true number than be surprised.
Next Steps: Build a Weekly Pipeline Health Review Routine
Pipeline health degrades gradually. Problems accumulate over weeks before they become visible in missed forecasts. A structured weekly review catches issues early when they’re still fixable.
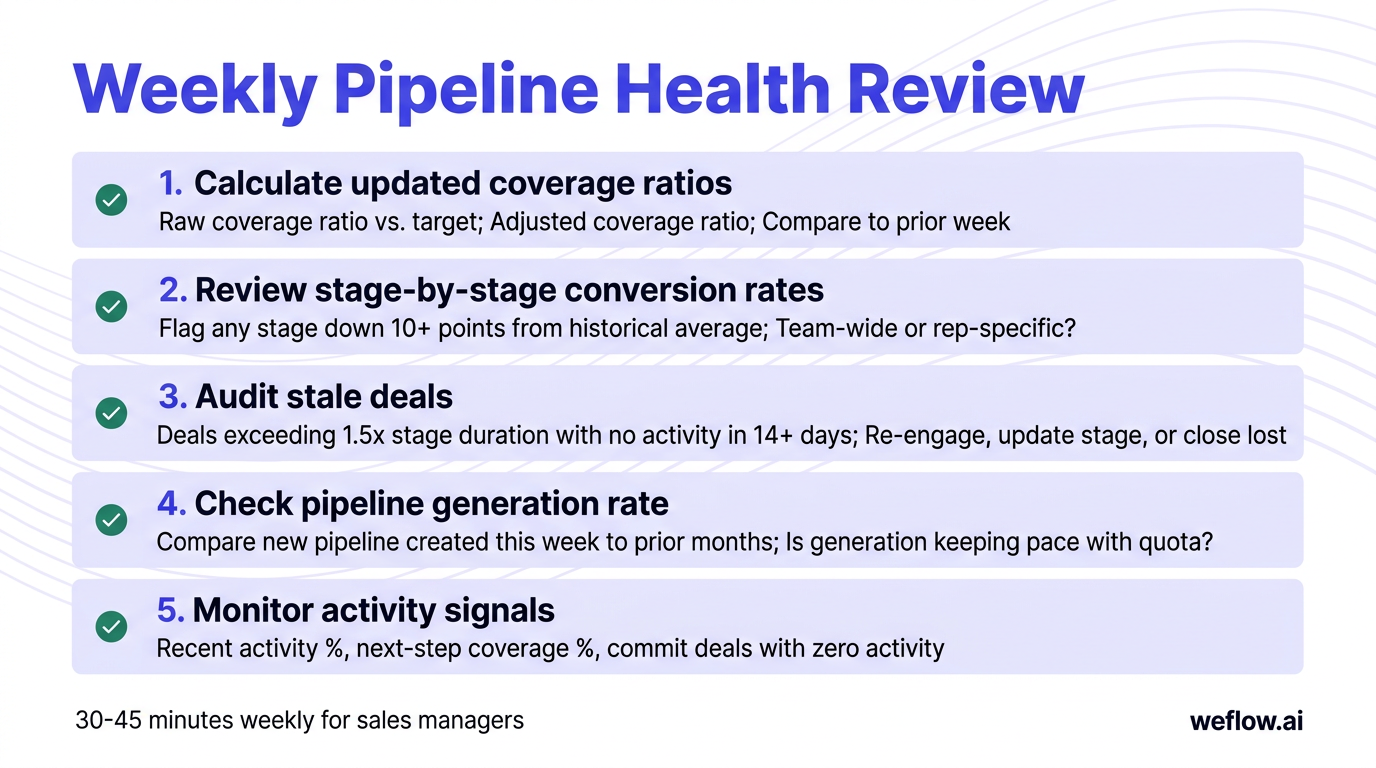
5-point weekly pipeline health checklist:
- Calculate updated coverage ratios
- Raw coverage ratio vs. target
- Adjusted (weighted) coverage ratio
- Compare both to prior week and identify direction of change
- Review stage-by-stage conversion rates
- Flag any stage where conversion dropped 10+ points from historical average
- Identify if the drop is team-wide or concentrated in specific reps
- Audit stale deals
- Pull list of deals exceeding 1.5x stage duration with no activity in 14+ days
- Require deal owners to take action (re-engage, update stage, or close lost)
- Check pipeline generation rate
- Compare new pipeline created this week to same week in prior months
- Is generation keeping pace with quota requirements?
- Monitor activity signals
- Percentage of deals with activity in last 14 days
- Next-step coverage percentage
- Any commit-category deals with zero recent activity
Time investment: 30-45 minutes weekly for a sales manager with 5-10 direct reports. 60-90 minutes for a RevOps leader reviewing team-level metrics across multiple segments.
Output: A brief written summary (3-5 bullets) covering: coverage status, any stages with conversion problems, count of stale deals requiring action, and pipeline generation trend. Share with your CRO or VP Sales as a standard operating cadence.
Consistent weekly reviews compound. After eight weeks of disciplined pipeline hygiene, you’ll notice forecast accuracy improving, fewer end-of-quarter surprises, and reps who proactively manage their deals because they know the review is coming.
Frequently Asked Questions
What is a healthy pipeline coverage ratio?
A healthy pipeline coverage ratio is typically 3x to 4x your sales quota. This means if your quarterly target is $500,000, you need $1.5M-$2M in total pipeline value. However, raw coverage can be misleading—use an adjusted ratio weighted by deal close probability for a more accurate picture.
How often should you review sales pipeline health?
Review pipeline health weekly at a minimum. A structured weekly review should cover new deals added, deals that advanced or stalled, and any deals exceeding 1.5x the average cycle length for their stage. Monthly, conduct a deeper analysis of stage-by-stage conversion rates and pipeline generation trends.
What are the signs of an unhealthy sales pipeline?
Key warning signs include: deals stuck in middle stages with no recent activity, pipeline coverage below 3x quota, a pipeline shape that bulges in the middle rather than narrowing like a funnel, declining stage-to-stage conversion rates, and a high percentage of deals with no logged activity in the past 30 days.
How do you calculate sales velocity?
Sales velocity = (Number of opportunities x Average deal value x Win rate) / Average sales cycle length. For example, 50 opportunities x $20,000 x 25% win rate / 60-day average cycle = $4,167 per day in pipeline velocity. Track this monthly to spot trends.
What is the difference between pipeline coverage and adjusted pipeline coverage?
Pipeline coverage divides total pipeline value by your sales target—a simple directional metric. Adjusted pipeline coverage weights each deal by its probability of closing based on stage, historical win rates, and deal characteristics. The adjusted version is more accurate because it accounts for the fact that early-stage deals are far less likely to close than late-stage ones.
How do you identify stale deals in your pipeline?
Flag any deal that has been in its current stage longer than 1.5x the average duration for that stage. Also flag deals with no logged activity (emails, calls, meetings) in the past 14-21 days. Stale deals inflate your coverage ratio and distort forecasts—remove or re-qualify them during your weekly review.
What pipeline metrics should sales managers track weekly?
At minimum, track these five metrics weekly: pipeline coverage ratio, stage-by-stage conversion rates, average deal age by stage, number of new opportunities added, and percentage of deals with recent activity. Together, these give you a leading-indicator view of whether your team will hit quota.