Sales Activity Tracking: KPIs, Setup, and Best Practices
Learn which sales activity tracking KPIs matter, how to set it up in Salesforce, and best practices.




Sales activity tracking is the practice of recording and analyzing every sales touchpoint—emails, calls, meetings, tasks, and notes—to understand how your team spends time and which activities drive revenue. This guide covers what sales activity tracking is, why it matters for pipeline accuracy, the KPIs you should measure, and how to set up a tracking system that works in Salesforce.
What is sales activity tracking?
Sales activity tracking means capturing every rep interaction with prospects and customers—emails sent, calls made, meetings held, tasks completed, and notes logged—then connecting that data to opportunities in your CRM. The goal is visibility: knowing what’s happening in your pipeline without asking reps to manually report it. When activity data flows into Salesforce automatically, managers can see deal health, forecast with confidence, and coach based on real patterns instead of guesswork.
Why sales activity tracking matters for pipeline accuracy
How does activity tracking reveal where reps spend their time?
Most sales reps spend the majority of their working hours on non-selling activities: updating CRM fields, writing follow-up emails, searching for contact information, attending internal meetings, and preparing reports. Activity tracking makes this visible. When you can see that a rep logged 12 calls but only two meetings last week, you’ve got data to coach on. When you notice a top performer averages 15 meaningful touches per deal while others average eight, you’ve found a pattern worth replicating.
Without activity data, managers rely on self-reported pipeline updates—which are often incomplete, delayed, or optimistic. Activity tracking replaces anecdotes with facts. You’ll see which accounts are going cold, which reps are spreading too thin across too many deals, and where time is being wasted on unqualified opportunities.
Time allocation insights extend beyond individual reps. Activity data reveals team-wide patterns: Are your AEs spending enough time on enterprise accounts versus mid-market? Is prospecting activity dropping off mid-quarter as reps focus on closing? Are newly assigned accounts getting the attention they need? These patterns are invisible without systematic tracking.
Which sales metrics should you track?
Not all metrics matter equally. Focus on these core indicators:
- Win rate: The percentage of opportunities that close successfully. Calculated as (Closed Won / Total Closed) x 100. A low win rate often signals poor qualification or ineffective sales process. Track by segment, rep, and lead source to identify where conversion breaks down.
- Conversion rate: How effectively opportunities move between stages. Track stage-to-stage conversion (e.g., Discovery to Proposal) to identify where deals stall. A 70% conversion from Discovery to Demo but 20% from Demo to Proposal tells you something specific about your demo effectiveness.
- Ramp time: How long it takes new reps to reach full productivity, typically measured as time to first closed deal or time to quota attainment. Activity data shows whether ramping reps are doing enough of the right things. Compare their activity patterns to top performers to identify coaching gaps.
- Pipeline coverage: The ratio of pipeline value to quota. A 3x coverage ratio means you’ve got three dollars of pipeline for every dollar of quota. Activity tracking helps you understand whether that coverage is real or inflated—deals without recent activity shouldn’t count at face value.
- Activity-to-close ratio: The number of activities (calls, emails, meetings) required to close a deal. This varies by segment and deal size but should be consistent within cohorts. Reps with ratios far above average may be inefficient; those below average may be skipping steps that matter.
How activity data improves win rates
Deals with consistent activity close at higher rates than deals with sporadic contact. This isn’t surprising—engaged buyers respond, and engaged sellers follow up. Activity tracking quantifies this relationship and makes it coachable.
When you correlate activity patterns with closed-won deals, you’ll find benchmarks: deals that close typically have at least four stakeholder meetings, 10+ email exchanges, and a demo within the first 30 days. When a current deal falls short of these benchmarks, that’s a coaching moment. The rep can course-correct before the opportunity goes cold.
Activity data also reveals multi-threading effectiveness. Deals with contacts across multiple departments close at higher rates than single-threaded deals. If your reps are only talking to one person, activity tracking surfaces that risk early. You can set alerts when a deal reaches Stage 3 without at least two contacts engaged.
Beyond benchmarks, activity tracking enables pattern recognition. What sequences of activities precede successful closes? Do deals that include a technical evaluation close faster? Is there an optimal gap between demo and proposal? Historical activity data answers these questions with your own numbers, not industry averages.
How sales activity tracking improves forecast accuracy
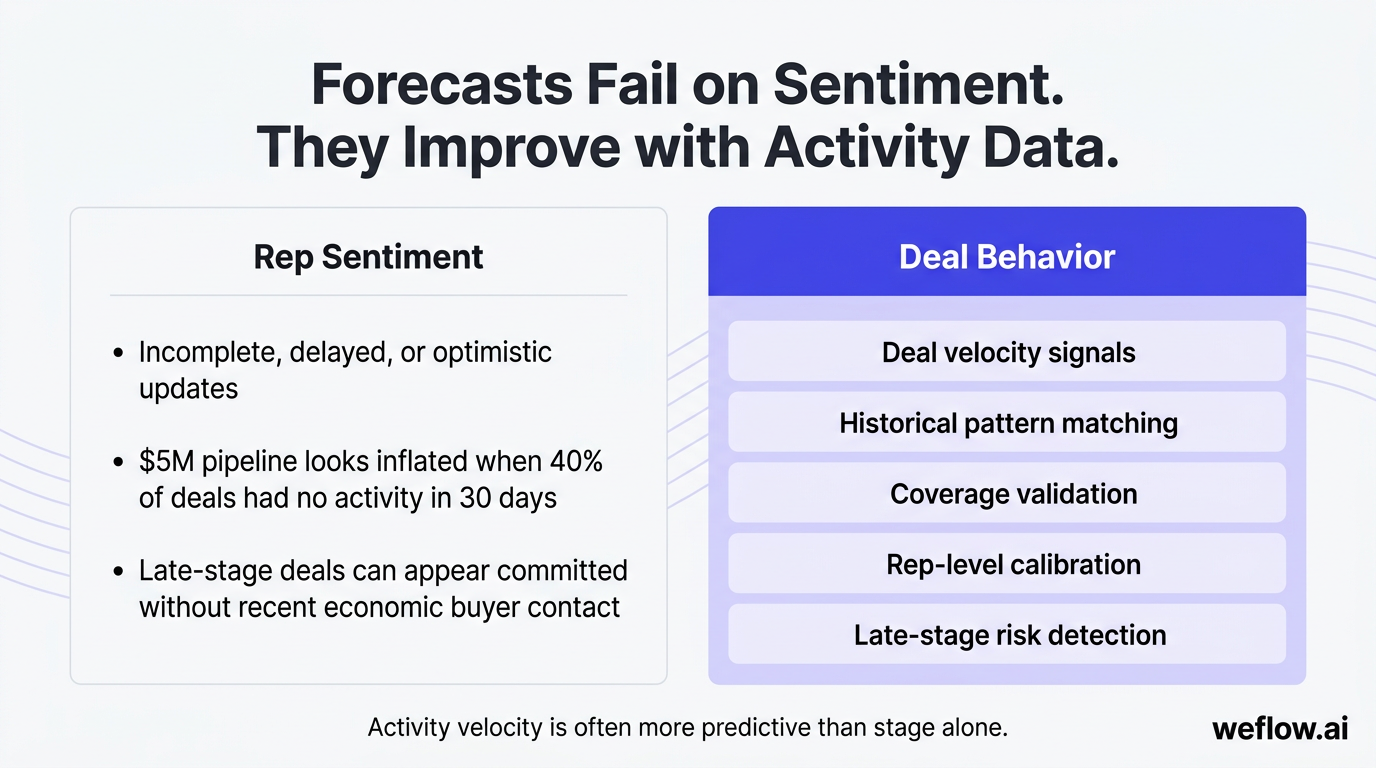
Forecasts fail when they’re based on rep sentiment instead of deal behavior. Activity tracking provides the behavioral layer that forecasts need. Here’s how:
- Deal velocity signals: A deal progressing through stages should show increasing activity—more stakeholders, more meetings, more detailed exchanges. Deals stuck in stage with declining activity are at risk, regardless of what the rep says. Activity velocity is often more predictive than stage alone.
- Historical pattern matching: Activity patterns from past closed-won deals create a template. Current deals can be scored against this template to estimate close probability more accurately than stage-based probability alone.
- Coverage validation: A pipeline might show $5M in coverage, but if 40% of those deals haven’t had activity in 30 days, your real coverage is closer to $3M. Activity data lets you discount stale opportunities from the forecast.
- Rep-level calibration: Some reps consistently forecast accurately; others are chronically optimistic. Activity data lets you calibrate forecasts by rep—apply a higher discount to forecasts from reps whose deal activity doesn’t match their confidence.
- Late-stage risk detection: Deals in Negotiation or Verbal Commit stages should have recent activity with economic buyers. If a “verbal commit” deal hasn’t had contact with the decision-maker in three weeks, it’s not really committed.
How to identify at-risk deals using activity signals
At-risk deals share common patterns that activity tracking makes visible:
- Activity gaps: No emails, calls, or meetings in the past 14+ days on a deal that should be progressing.
- One-way communication: Plenty of outbound activity from the rep, but no replies, no meetings accepted, no engagement from the prospect.
- Single-threaded relationships: All communication with one contact. If that contact goes dark or leaves the company, the deal dies.
- Stage stagnation: Deal has been in the same stage for longer than average cycle time for that stage, with no activity increase.
- Missing stakeholders: Late-stage deals without activity involving economic buyers, legal, or procurement.
- Declining activity velocity: Deals should gain momentum as they progress. When activity levels drop from Stage 2 to Stage 3, something’s stalling.
When you flag these patterns automatically, managers can intervene before deals slip.
Key sales activity tracking KPIs and how to calculate them
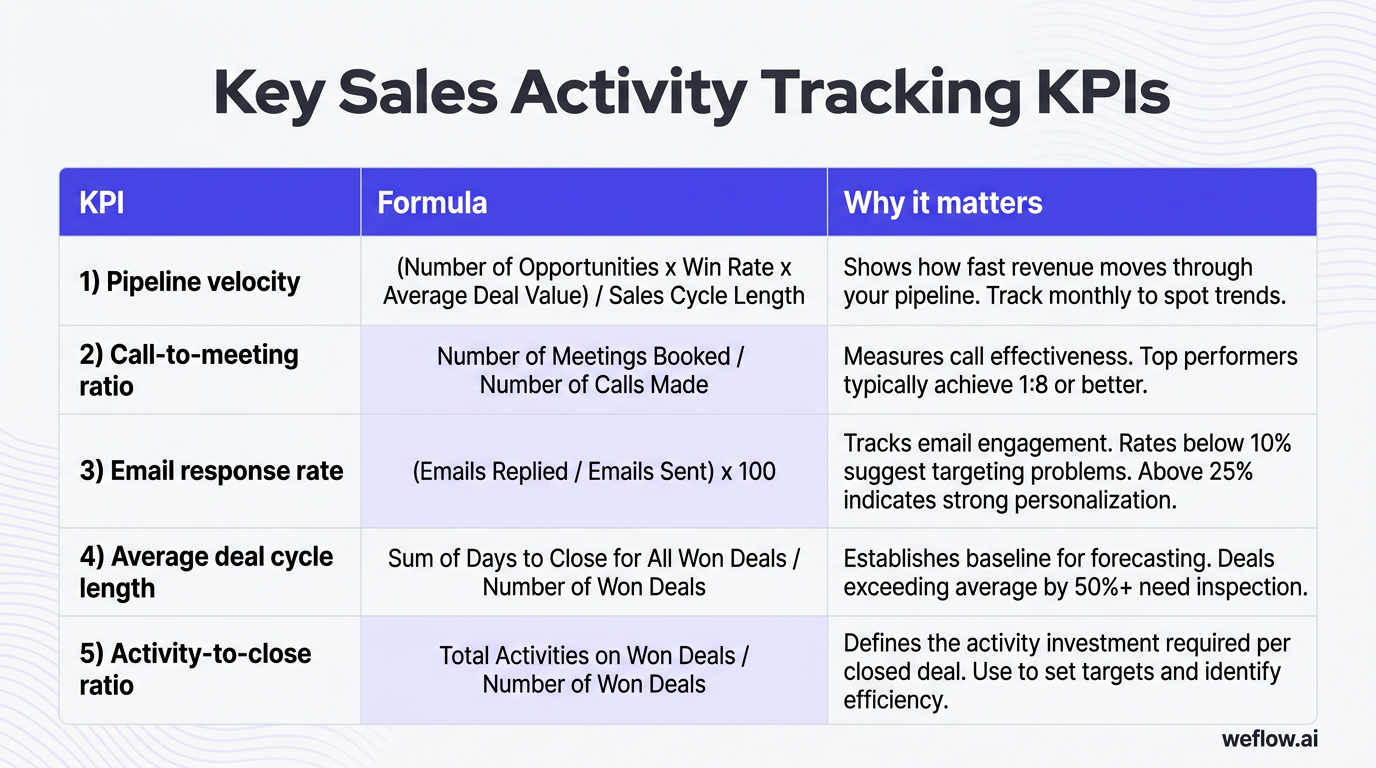
| KPI | Formula | Why it matters |
|---|---|---|
| Pipeline velocity | (Number of Opportunities x Win Rate x Average Deal Value) / Sales Cycle Length | Shows how fast revenue moves through your pipeline. Track monthly to spot trends. |
| Call-to-meeting ratio | Number of Meetings Booked / Number of Calls Made | Measures call effectiveness. Top performers typically achieve 1:8 or better. |
| Email response rate | (Emails Replied / Emails Sent) x 100 | Tracks email engagement. Rates below 10% suggest targeting problems. Above 25% indicates strong personalization. |
| Average deal cycle length | Sum of Days to Close for All Won Deals / Number of Won Deals | Establishes baseline for forecasting. Deals exceeding average by 50%+ need inspection. |
| Activity-to-close ratio | Total Activities on Won Deals / Number of Won Deals | Defines the activity investment required per closed deal. Use to set targets and identify efficiency. |
These KPIs work together. Pipeline velocity tells you the overall health of your sales machine. The supporting metrics help you diagnose where to improve.
How to set up sales activity tracking in 3 steps
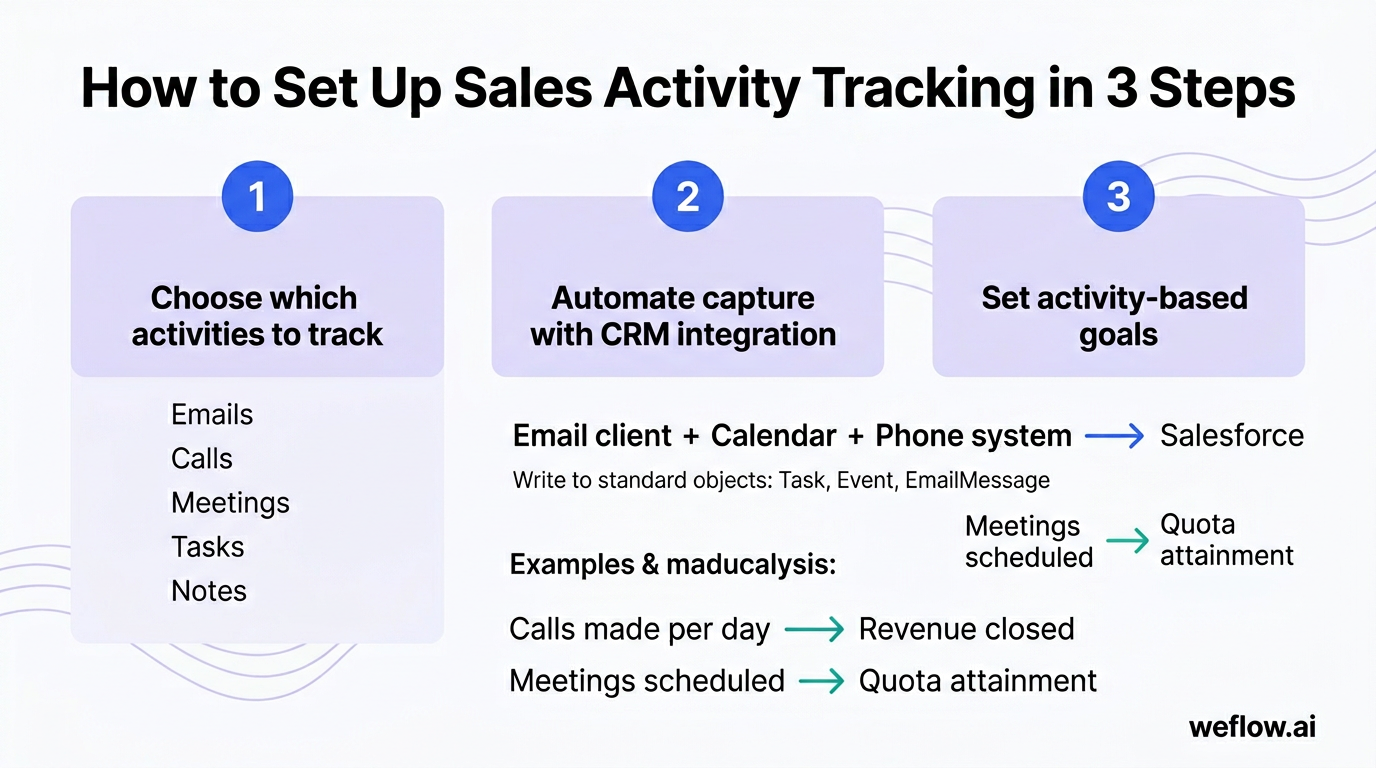
Step 1: Choose which sales activities to track
Start by defining what counts as a trackable activity. The goal is capturing interactions that indicate deal progress, not creating busywork metrics.
| Activity type | What to capture |
|---|---|
| Emails | Sent/received, recipient role, response received (yes/no), thread length, time to reply |
| Calls | Duration, outcome (connected/voicemail/no answer), disposition notes, call recording if available |
| Meetings | Attendees and their roles, meeting type (discovery/demo/negotiation), meeting notes, next steps |
| Tasks | Type, due date, completion status, associated opportunity or contact |
| Notes | Content, timestamp, associated record, author, key topics mentioned |
Activities by funnel stage: Early-stage deals should show high call and email volume. Mid-stage deals should show meetings with multiple stakeholders. Late-stage deals should show activity with economic buyers and procurement, plus document exchanges. Use activity data to validate stage accuracy, not just progress.
[banner type="download" url="https://www.weflow.ai/resources/cheat-sheets/salesforce-activity-capture-cheat-sheet" text="Salesforce Activity Capture Cheat Sheet" subtitle="Get every email, call, and meeting into Salesforce without chasing reps to log them" button="Get the cheat sheet"]
Step 2: Automate activity capture with CRM integration
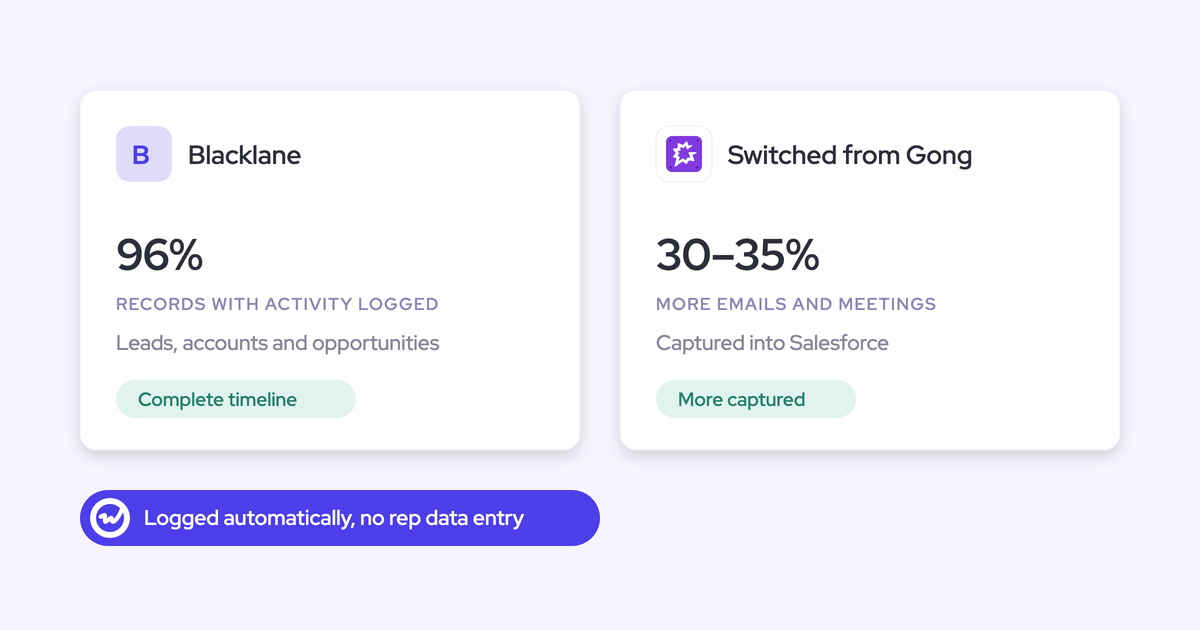
Manual tracking fails. Reps won’t log activities consistently, and even well-intentioned teams fall behind when deals get busy. When 30% of activities go unlogged, your metrics are fiction.
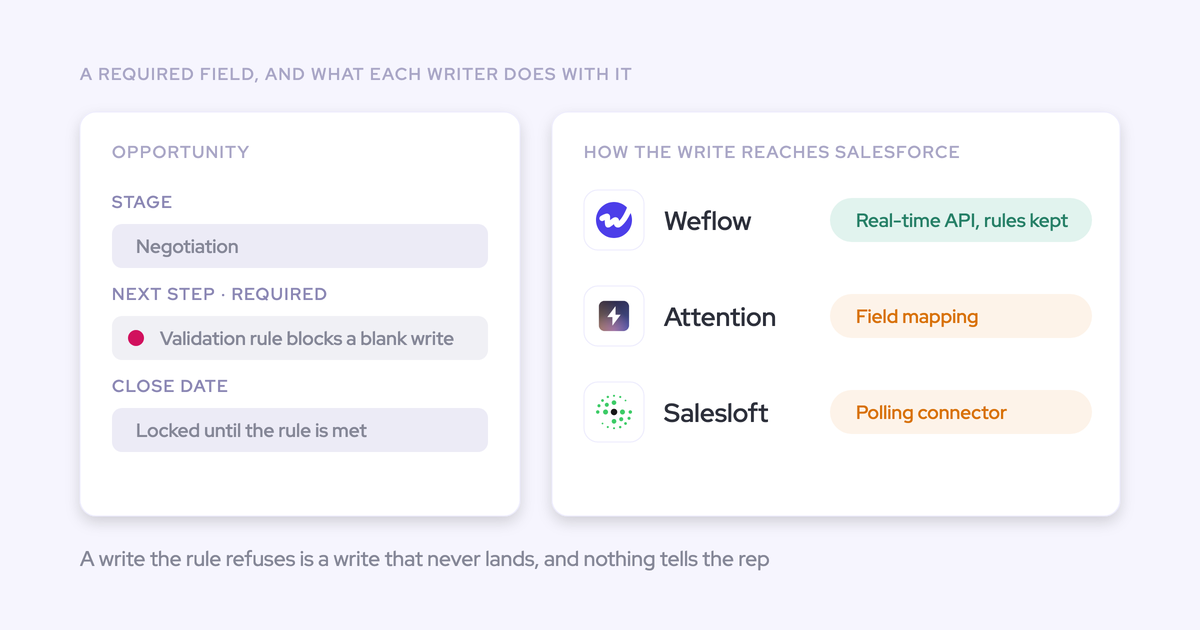
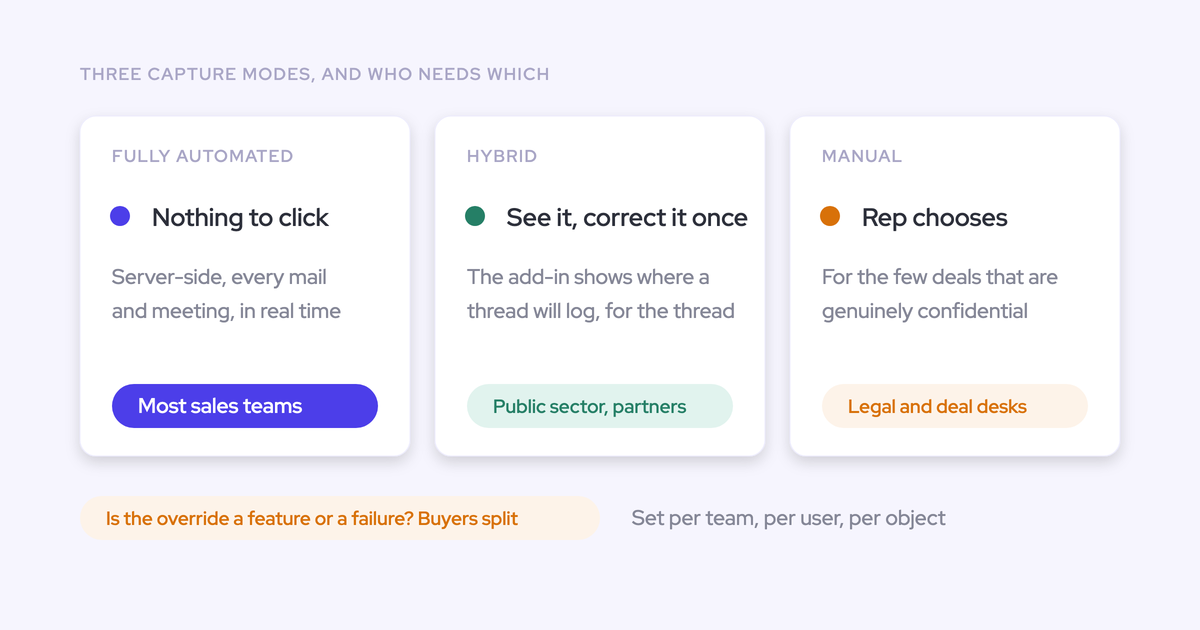
Automation captures activities at the source—your email client, calendar, and phone system—and writes them to Salesforce without rep involvement. No extra clicks, no end-of-day data entry.
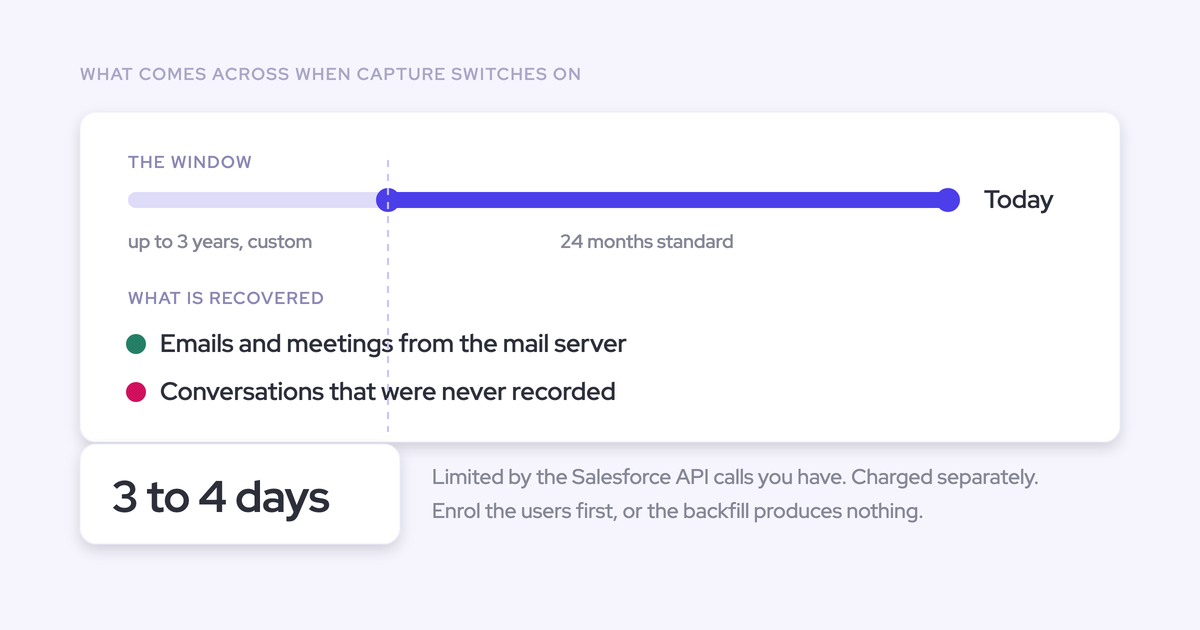
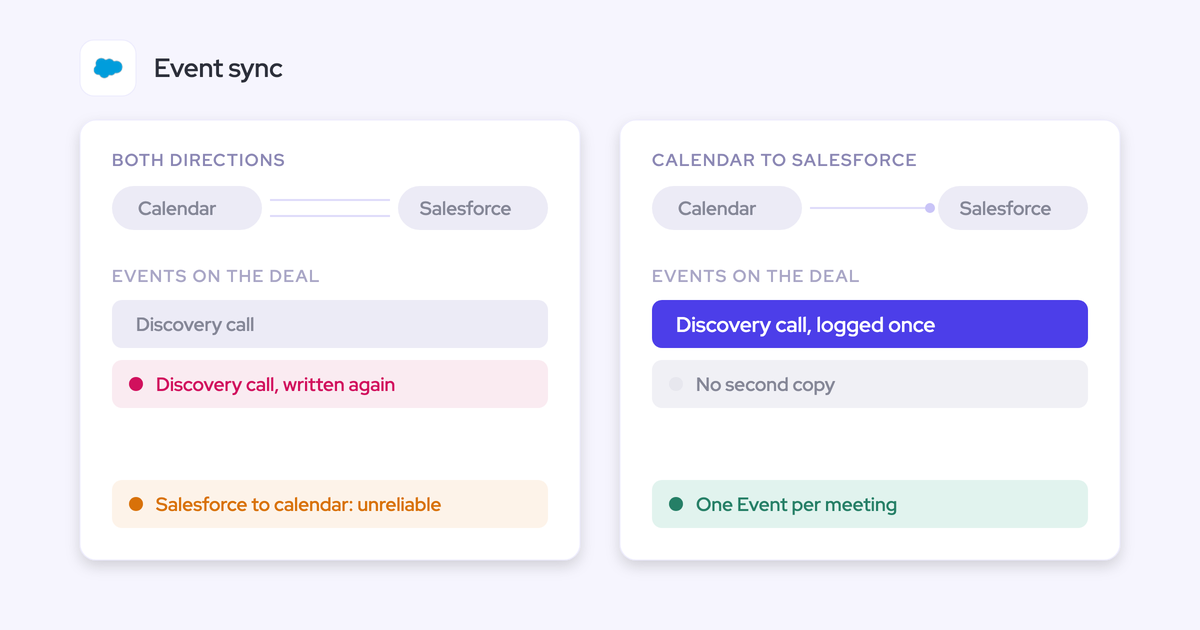
For Salesforce users, Weflow automates this capture. Emails sync from Gmail or Outlook to Salesforce as Activity records. Calendar events become Events. Call recordings and transcripts are captured and linked to the right Opportunity and Contact. AI-generated call summaries, next steps, and MEDDIC field updates reduce admin further.
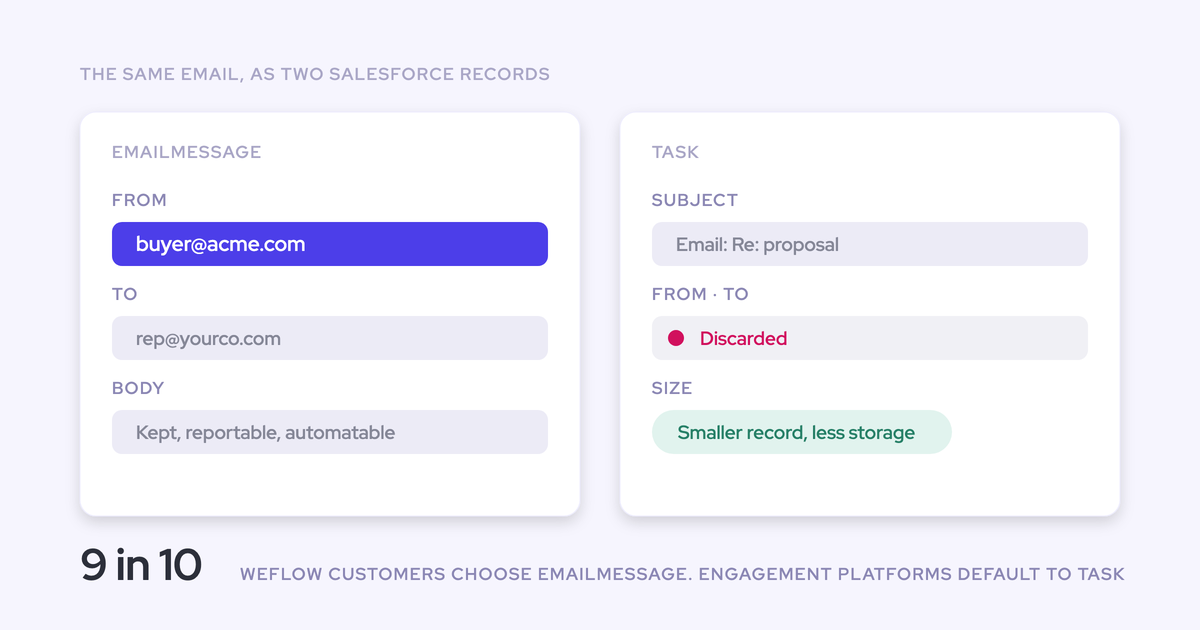
Native capture writes to standard Salesforce objects (Task, Event, EmailMessage), so your existing reports work and your data stays in one place.
Step 3: Set activity-based goals using leading and lagging indicators
Effective activity goals connect daily behaviors (leading indicators) to quarterly outcomes (lagging indicators).
| Leading indicators (controllable) | Lagging indicators (outcomes) |
|---|---|
| Calls made per day | Revenue closed |
| Emails sent per week | Win rate |
| Meetings scheduled | Quota attainment |
| Demos delivered | Average deal size |
| Proposals sent | Sales cycle length |
Worked example: Your team needs to close 50 deals per month. Historical data shows a 10% conversion rate from qualified opportunity to closed-won. That means you need 500 qualified opportunities entering the pipeline monthly. If it takes an average of 20 emails to generate one qualified opportunity, your team needs to send 10,000 emails per month. With 10 reps and 20 selling days, each rep needs to send 50 emails per day.
Work backward from revenue targets to daily activities. When leading indicators are hit but lagging indicators lag, you’ve got a conversion problem. When leading indicators are missed, you’ve got an activity problem. Either way, you know where to focus coaching.
Frequently asked questions
What is sales activity tracking?
Sales activity tracking is the process of recording every sales interaction—emails, calls, meetings, tasks, and notes—and connecting that data to CRM records. The goal is to understand which activities drive revenue and where reps spend their time, without relying on manual logging.
What sales activities should I track?
Track emails (sent and received), calls (duration and outcome), meetings (attendees and type), tasks, and notes. Focus on activities that indicate deal progression: stakeholder meetings, proposal sends, and economic buyer engagement matter more than raw activity volume.
How do I automate sales activity tracking?
Use a tool that captures activities from your email client, calendar, and phone system and syncs them to Salesforce automatically. Look for native integration that writes to standard objects (Task, Event) rather than external storage.
What are leading vs. lagging indicators in sales?
Leading indicators are activities you control: calls made, emails sent, meetings held. Lagging indicators are outcomes: revenue closed, win rate, quota attainment. Track both—leading indicators predict future results, while lagging indicators confirm whether your activity strategy is working.
How do I calculate pipeline velocity?
Pipeline velocity = (Number of Opportunities x Win Rate x Average Deal Value) / Sales Cycle Length. This metric shows how fast revenue moves through your pipeline. Improving any variable increases velocity.
How often should I review sales activity data?
Review activity data weekly at minimum. Monthly, analyze aggregate patterns across the team. Quarterly, recalibrate your activity-to-outcome models based on actual results.
What’s the difference between sales tracking and sales activity tracking?
Sales tracking covers pipeline, revenue, and deal-stage reporting. Sales activity tracking focuses on rep interactions—emails, calls, meetings—that move deals forward. Activity tracking is the upstream layer that explains pipeline movement.
Can I track sales activities with a spreadsheet?
You can, but it won’t scale. Spreadsheet tracking requires manual data entry, which reps skip when busy. For teams larger than three to five reps, automated CRM-based tracking is worth the investment.