
Out-Quarter Pipeline: How to Assess Next Quarter's Pipeline Before This One Closes
Learn how to assess next quarter's pipeline before quarter-end using cohort analysis and coverage benchmarks


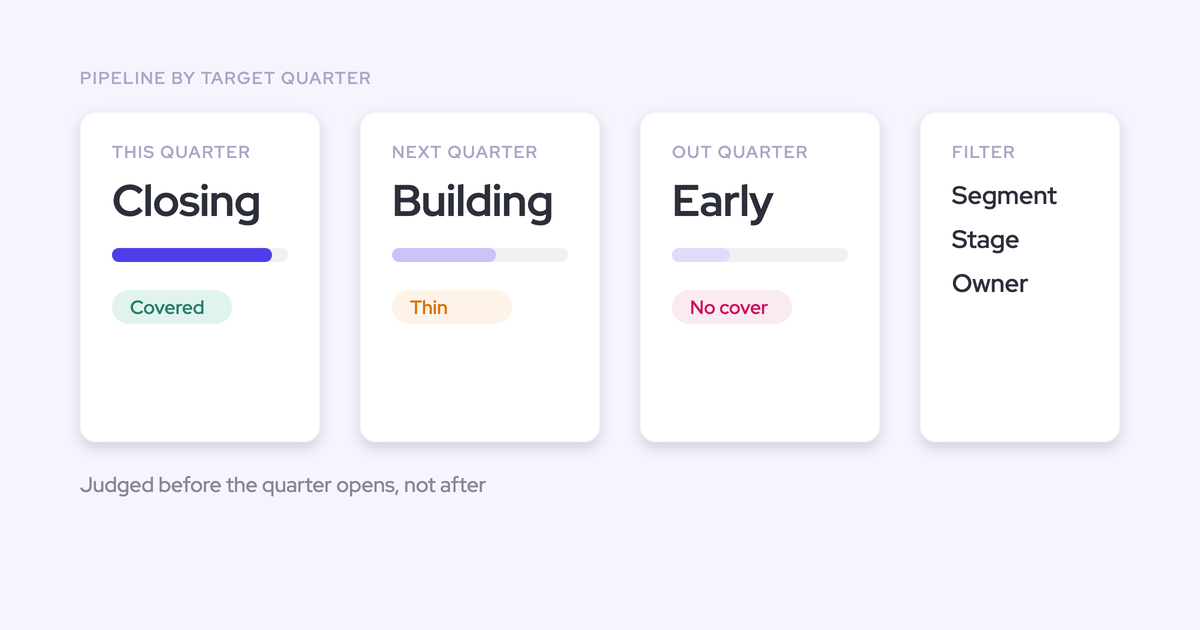

You already know how this ends. Coverage looked healthy in week one, deals started slipping and stalling around week five, and by week seven the quarter that was covered three times over wasn't covered at all. Then the real damage: the segment that was short didn't surface until the quarter you needed it to close, when it was far too late to build anything.
That's not a reporting gap in the current quarter. It's the absence of a separate discipline, one most revenue teams never run: judging the pipeline being built for quarters you haven't started selling yet, by segment and by creation cohort, while a pipeline-generation decision can still change the outcome.
Weflow is the Revenue AI Orchestration platform for sales, customer success, and RevOps teams, and this read runs on Deal Intelligence & Forecasting. But the mechanism only matters once the discipline is clear, so start there.
Why pipeline shortfalls surface when it's too late to fix
The shortfall surfaces late because coverage gets judged once, by hand, at QBR, as one blended number for the whole business.
One number for the whole business is exactly the number that hides the problem. A healthy enterprise team at 3.5x masks a Nordic team sitting at 1.4x, and nobody sees the Nordic team until the miss arrives with its name on it.
The second half of the problem is timing. Pipeline is a lagging output: what you're looking at today was generated cohorts ago.
"Your pipeline coverage is kind of like light from a star. By the time you see the light, it had already traveled a great distance. Same thing with your pipeline. Your pipeline was generated cohorts ago, right? Whether it's a weekly cohort, monthly cohort, quarterly cohort."
So by the time a CRO can see the gap in the quarter, the decision that caused it was made two or three cohorts back. Pipeline generation becomes a post-mortem you write instead of a decision you make.
The recurring symptoms are the same across almost every team we talk to:
- Coverage is assembled by hand in a spreadsheet at QBR time, one blended figure, so segment-level risk never appears until it becomes a miss.
- The coverage target is a borrowed 3x rule from a conference talk that was never tested against the team's own win rate and cycle length. Some businesses hit the number on less than 1x. Some need 5x.
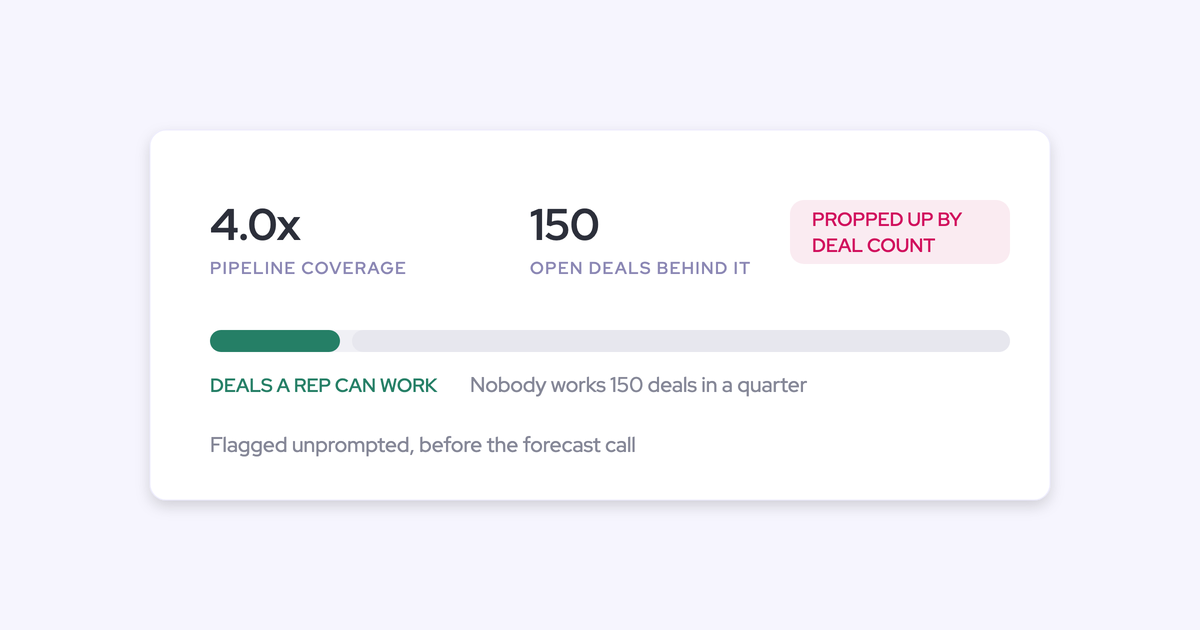
- Coverage gets propped up by deal count. A rep at 4x coverage built from 150 open deals doesn't have 4x coverage, they have a queue nobody can work.
- Nobody can compare this quarter's build to the same point in the last three quarters, so there's no way to tell whether the number is normal or alarming.
What an out-quarter pipeline read actually tells you
The out-quarter read judges the pipeline being built for quarters you haven't started selling yet, by target quarter, segment, and creation cohort, run in the back half of the current quarter while there's still time to generate more.
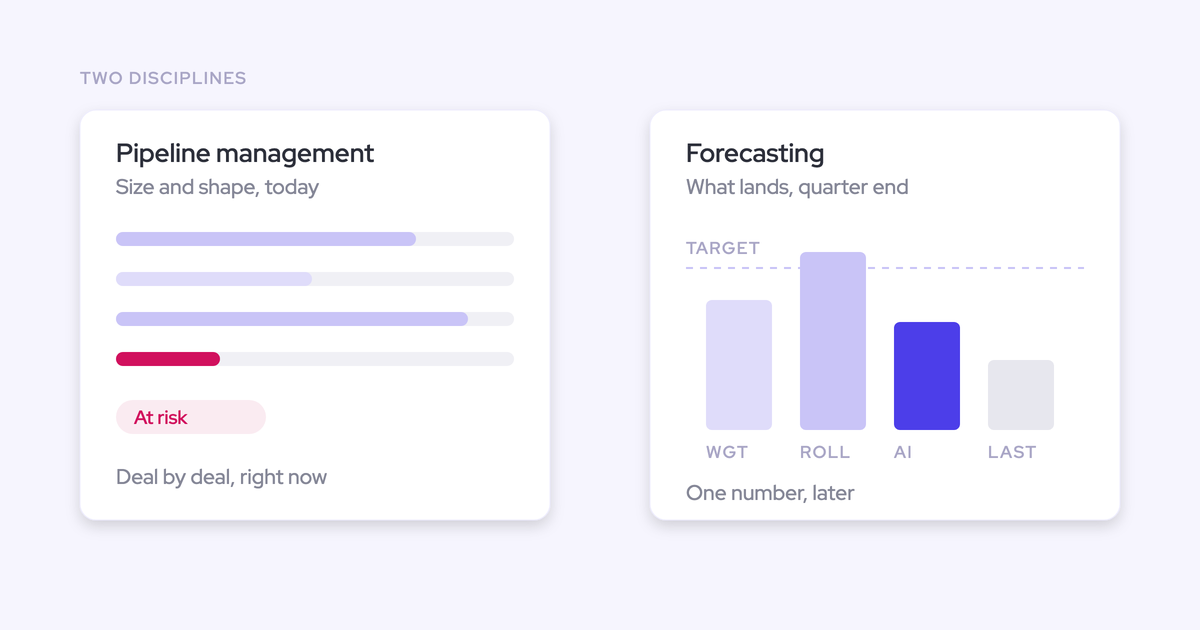
It's a different job from the one your forecast call already does. The forecast roll-up and the pacing view answer "will we land this quarter." The out-quarter read answers "which segments are going to be short two quarters from now, and by how much."
Run it in the back half of the current quarter. Earlier and you're reading noise. Later and you've inherited the same problem you had last time.
| The current-quarter read | The out-quarter read | |
|---|---|---|
| Question it answers | Will we land the number we committed? | Is enough pipeline being built for the quarters after this one, and where isn't it? |
| Time horizon | Weeks remaining in the quarter | One to three quarters ahead |
| Unit of analysis | The individual deal, and the roll-up above it | The segment, the territory, and the creation cohort |
| Decision it feeds | Which deals to inspect, escalate, or pull in | Which segment gets a pipeline-generation intervention, and when |
| Who runs it | Managers, weekly, deal by deal | The CRO and RevOps, weekly, in the back half of the quarter |
Keep the two conversations apart. Mixing them produces an unfocused meeting where a discussion about closing what you have swallows the discussion about not having enough.
Why Salesforce and Clari can't produce the out-quarter read
The read needs two things: history on how the pipeline looked at earlier points in time, and date logic that can reason about quarters other than the one you're in. Your CRM supplies neither, and the current-quarter forecasting tool sitting on top of it wasn't designed to.
Salesforce shows pipeline as it stands today, with no history
Salesforce keeps no record of what the pipeline looked like last month. The field is overwritten, and unless field history tracking was switched on in advance, the previous value is simply gone.
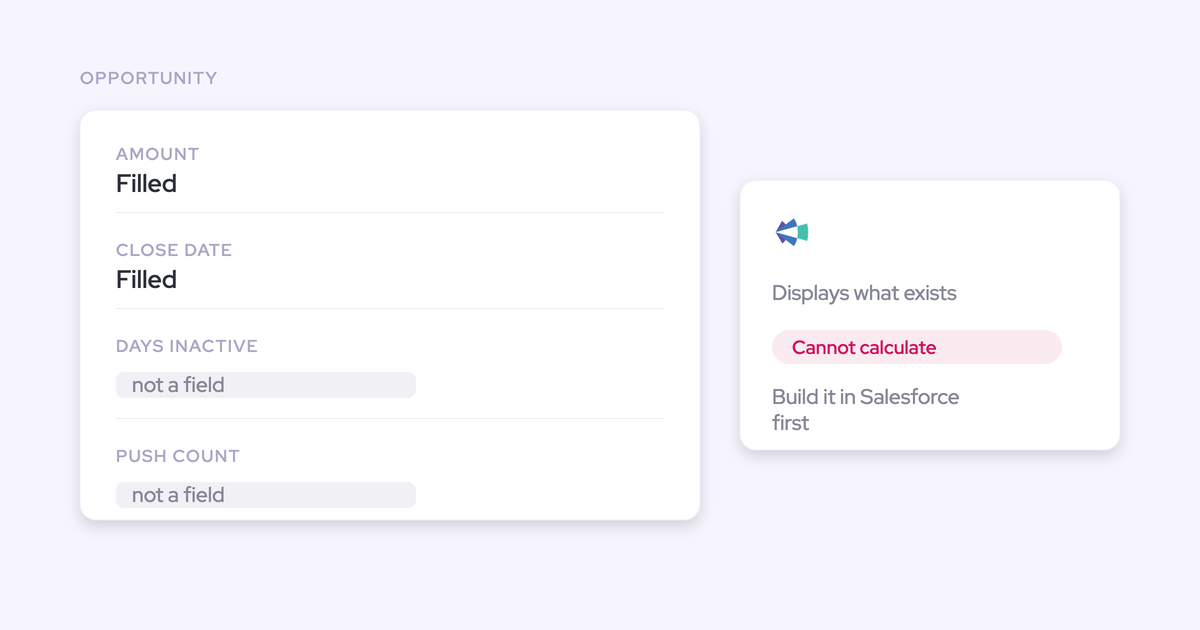
Worse for this job: calculated and roll-up fields can't be history-tracked at all. The custom amount field most teams forecast on is often exactly the field that can't carry history.
So the two reads that turn future pipeline into a forecast both fail:
- Cohort analysis by creation date, because you can't see what a cohort was worth when it was created versus what it's worth now.
- The same-day-last-quarter comparison, where a leader asks how day 35 of this quarter compares with day 35 of the last three.
Teams find this out the first time an executive asks why the forecast moved and the honest answer is that the evidence no longer exists. From there it's a warehouse, a snapshotting job, and a maintenance bill, which turns a management question into a data engineering project.
Clari's views and date logic are built for the current quarter
Give Clari its due first. The pipeline waterfall, the pacing view, and the comparison against the same day in previous quarters are genuinely the views revenue teams use, and Clari is a strong roll-up and board reporting surface for the quarter in flight. Sales leaders like it for a reason.
The structure is the problem, not the polish. Clari can't compare two date fields relative to each other.
That sounds abstract until you try to build a forward-quarter view. You can't express "target quarter is later than today's quarter" as a rule, so the workaround is to name the future quarters explicitly in a filter. Which works, right up until the calendar moves and the filter quietly starts excluding the wrong deals. Nobody gets an error. The number just goes wrong.
Two more limits compound it. Clari can't calculate a field, so any derived metric has to be built as a formula field in Salesforce first and maintained by someone else. And its waterfall compares one date to another rather than showing what moved in between, which is why so many teams end up exporting to a BI tool to see the movement they actually care about.
How Weflow turns future-quarter pipeline into a weekly decision
Four things make the out-quarter read runnable: a view that filters forward by target quarter, snapshots that let you cohort pipeline by creation date, coverage tracked continuously by segment, and the decomposition that stops the ratio lying to you.
Filter pipeline by target quarter, segment, and stage
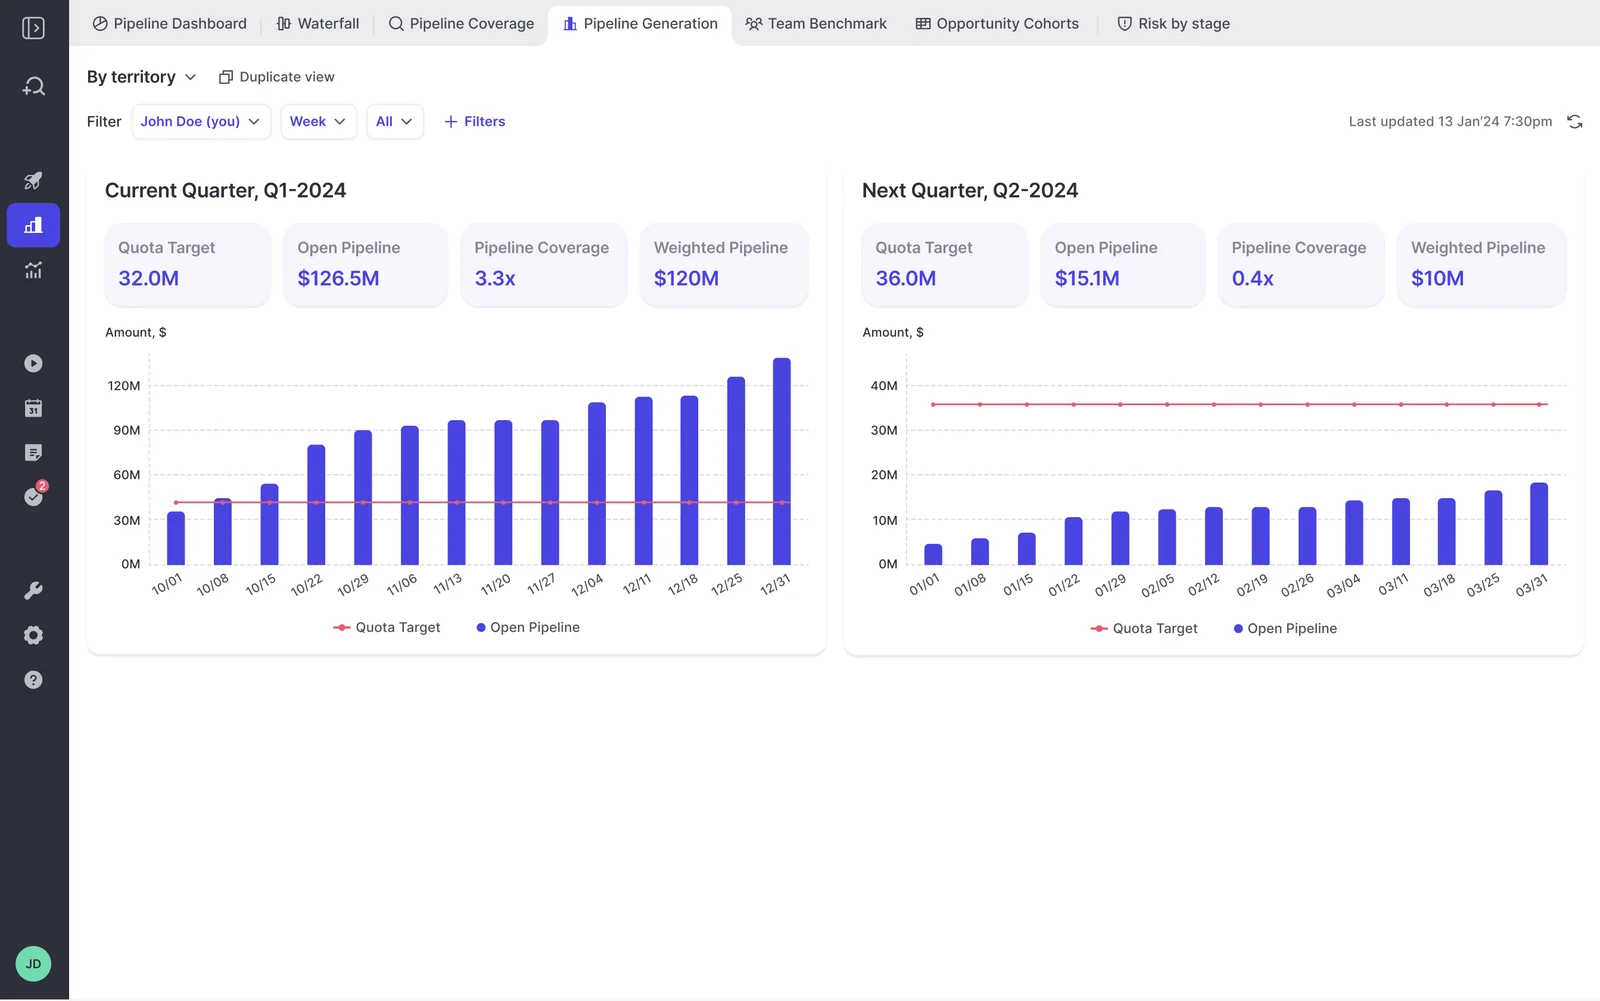
Weflow's out-quarter pipeline view lets you inspect what's being built for future quarters, filtered by target quarter, segment, and stage, before the current quarter closes.
In practice, that's a side-by-side. Current quarter at 3.3x coverage against a 32M target looks fine. Next quarter at 0.4x against 36M is the conversation you needed to be having six weeks ago.
Filter that next-quarter panel by segment and you find out whether the 0.4x is spread evenly or concentrated in one team. That's the difference between a general pipegen push and a specific intervention.
Read close rates by creation cohort from opportunity snapshots
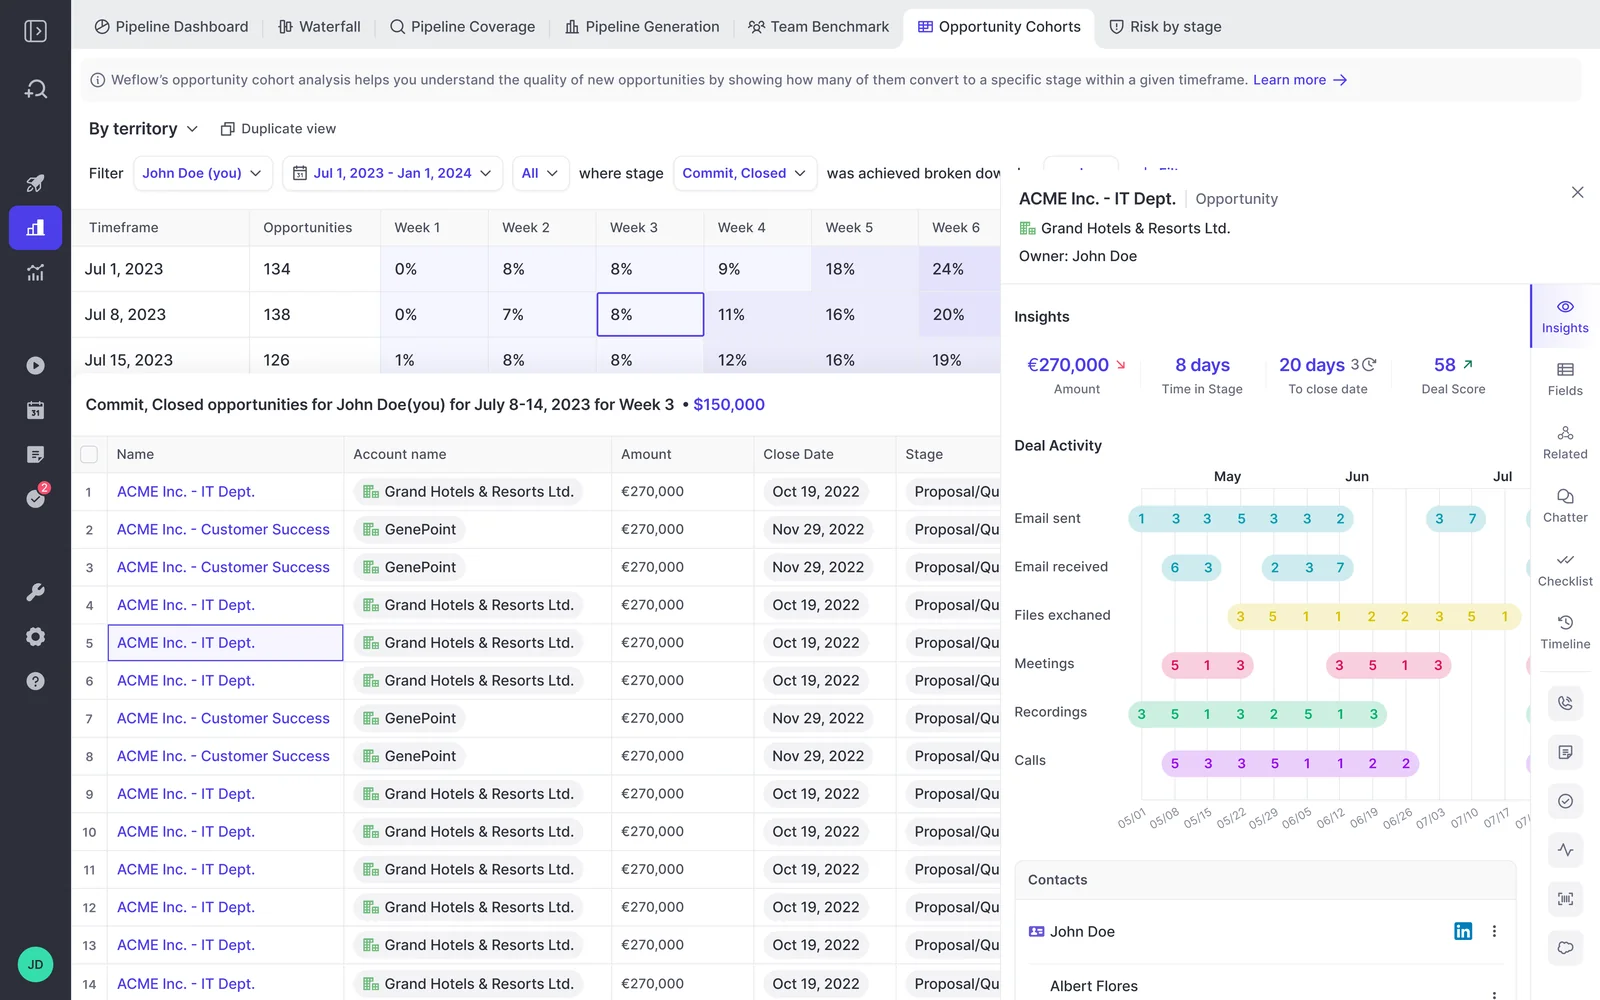
Weflow snapshots opportunity data every few hours, which is what makes cohort analysis possible: pipeline grouped by creation date, with each cohort's close rate tracked as it matures.
Filtering by creation date instead of close date answers a question your roll-up can't:
"But not filtering by close dates in Salesforce terms, but filtering by creation date and see how much of that pipeline did we close. And sometimes we had quarters where we said like, oh, normally we close twenty percent, but this one is ailing at below ten percent. What's wrong there? Are we going to make up? Are some deals stuck? Or did we get sloppy in the way we created pipeline in that quarter?"
That's the whole read. A cohort converting at half your norm tells you the pipeline built in that quarter wasn't built to standard, and it tells you while the deals in it are still alive.
One rule that matters: compare cohorts at the same age. Younger cohorts always show lower close rates because of cycle length, and a leader who forgets that will panic every time they look.
Track coverage by segment, territory, and rep continuously
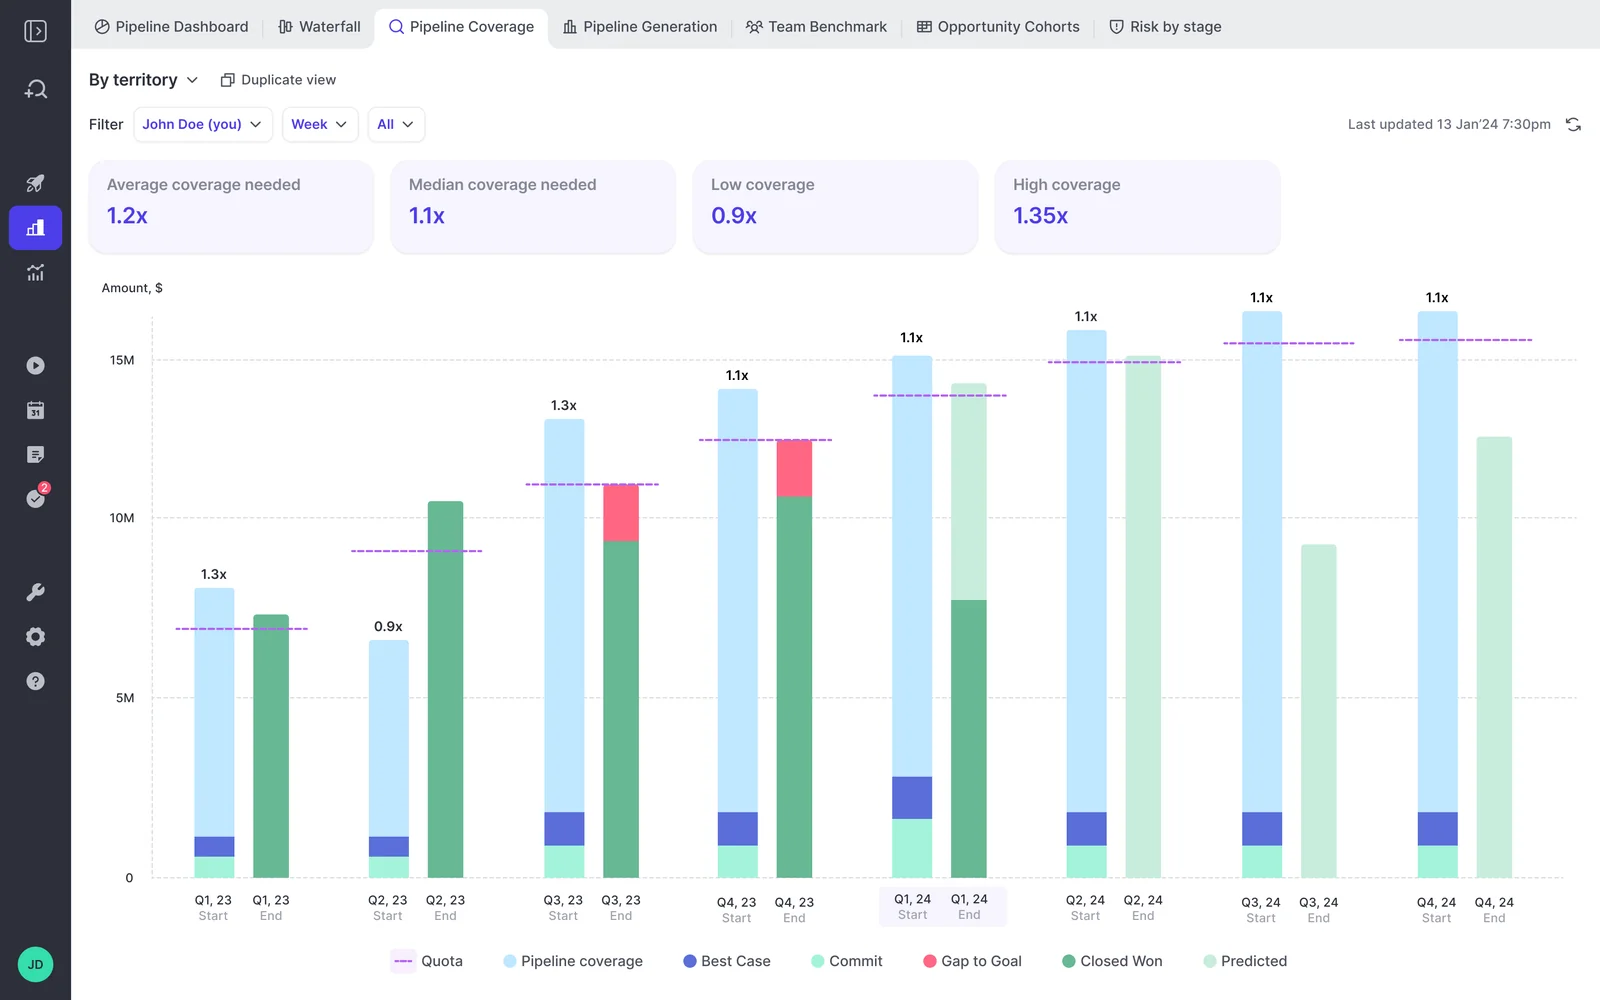
Weflow tracks coverage against quota continuously by segment, territory, and rep, so a team at 1.4x shows up in week six of the prior quarter rather than in the post-mortem.
Two things make that number defensible rather than decorative.
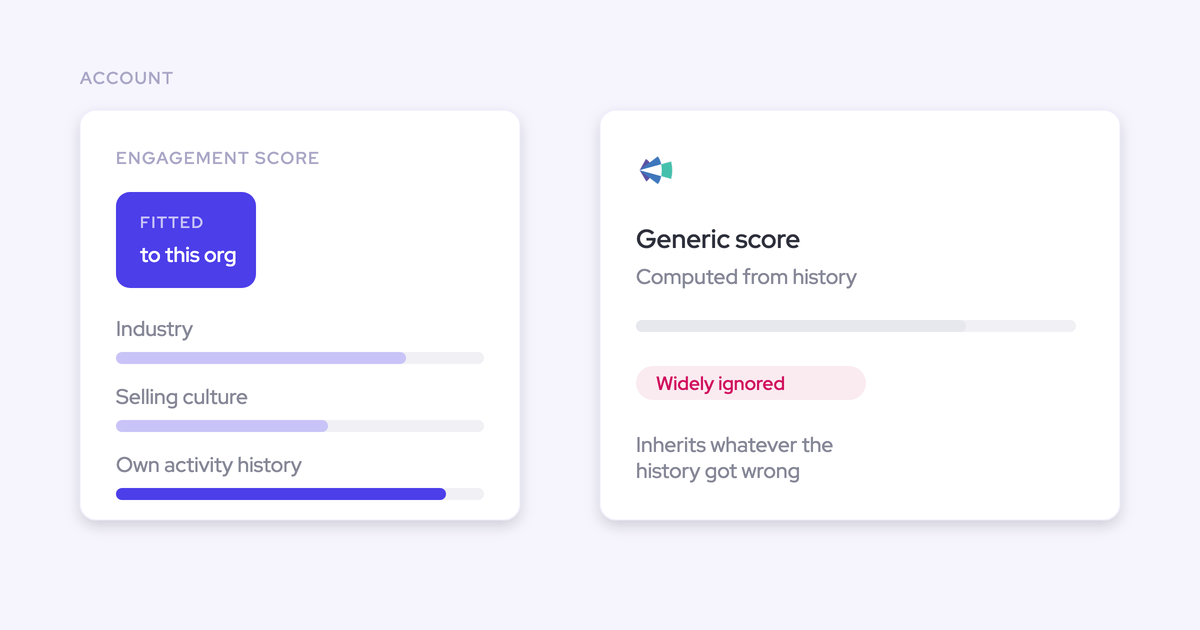
First, the benchmark comes from your own history. Weflow computes the coverage you actually need from your win rate and cycle rather than shipping a 3x default, and shows it as an average, a median, and a low and high band. If your business closes on 1.2x, a dashboard shouting at you to hit 3x is noise.
Second, coverage isn't a constant. It converges from around 3x at the start of a period toward 1x at the end as deals close and slip, so the same ratio means something different in week two than in week ten. Reading it weekly against that expected decay is the point.
One definition to fix before anyone argues about the number: coverage is open pipeline over the gap to goal, and it's worth subtracting the business you historically create and close inside the same period, because that portion was never going to come from carry-in pipeline.
Put deal count and inactivity next to the coverage ratio
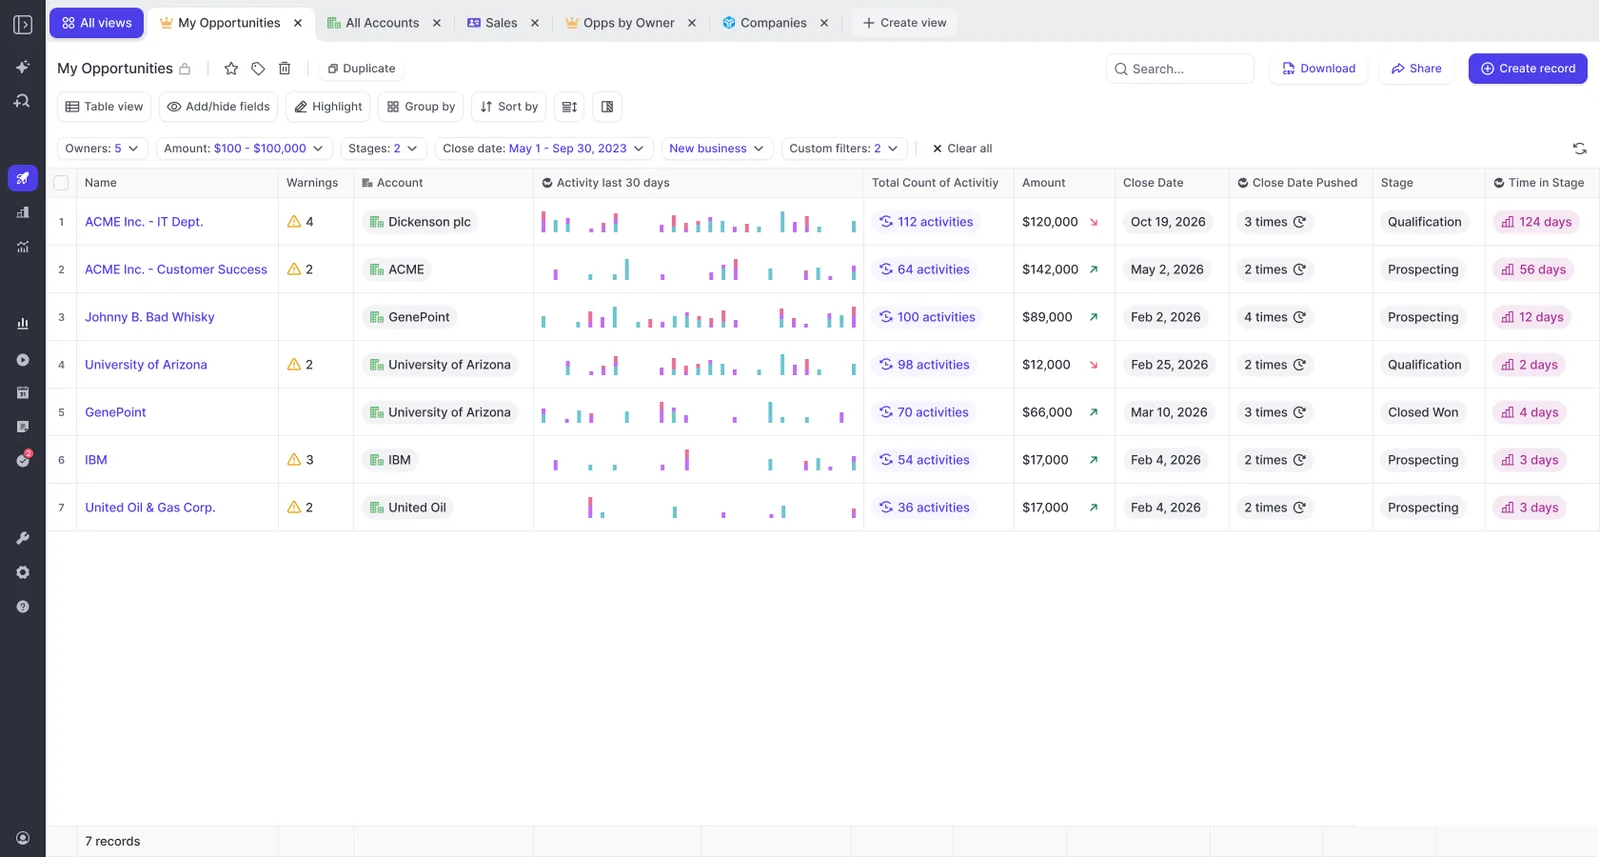
A coverage ratio is only readable when you can decompose it, which is why Weflow surfaces deal count, days in stage, close-date push count, and inactivity next to the value.
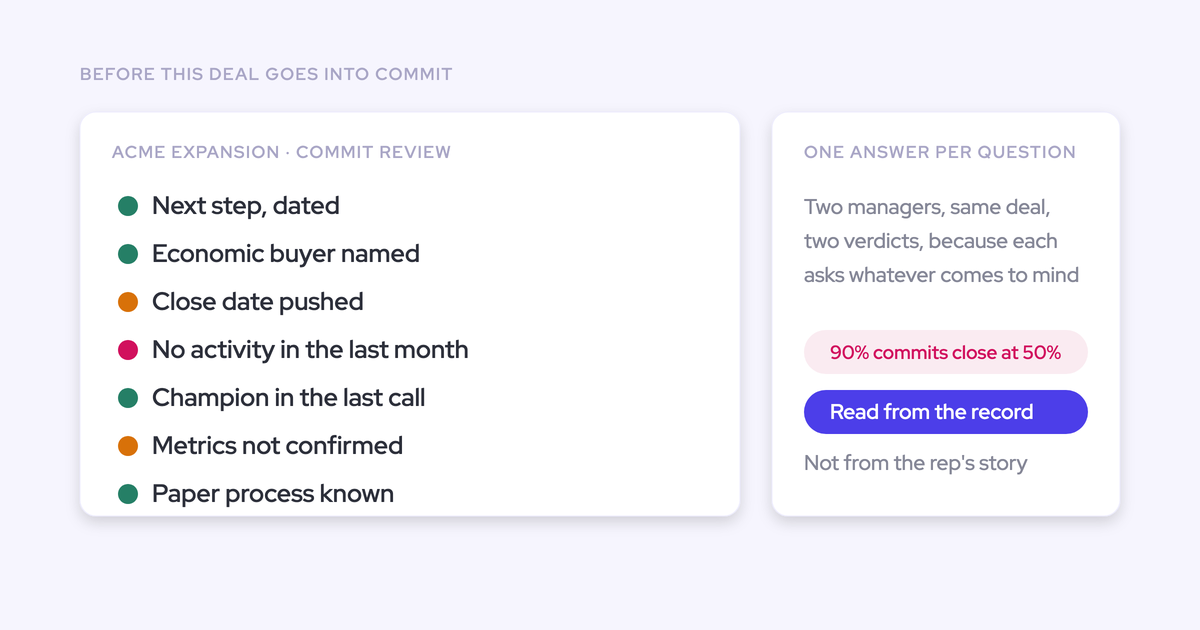
This is the fiction the decomposition kills:
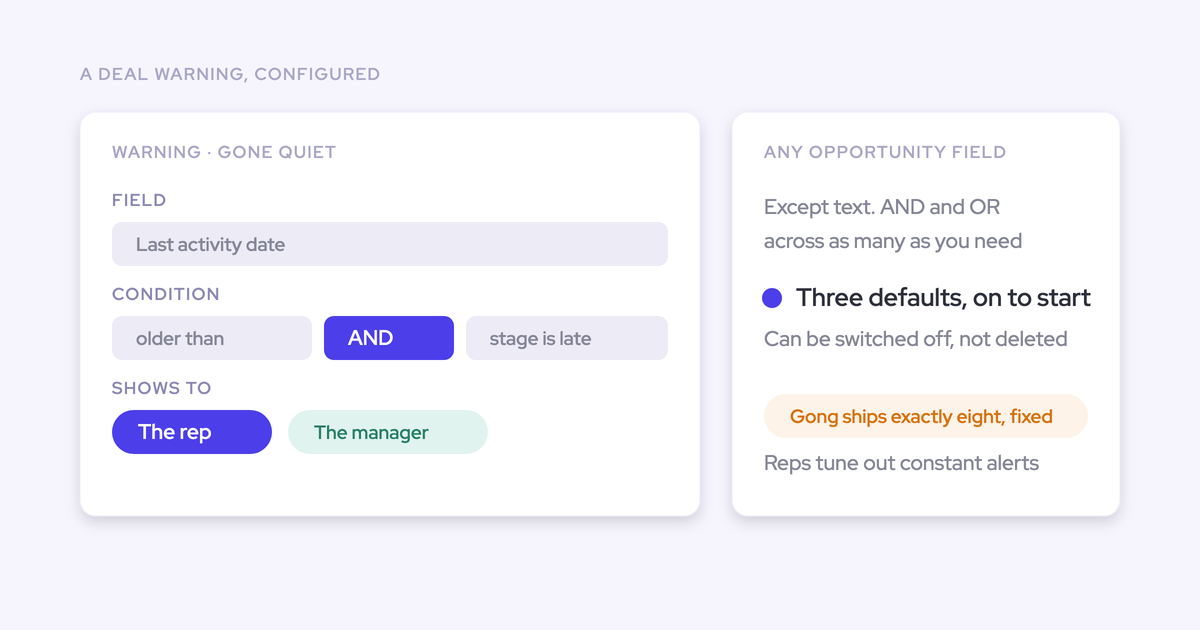
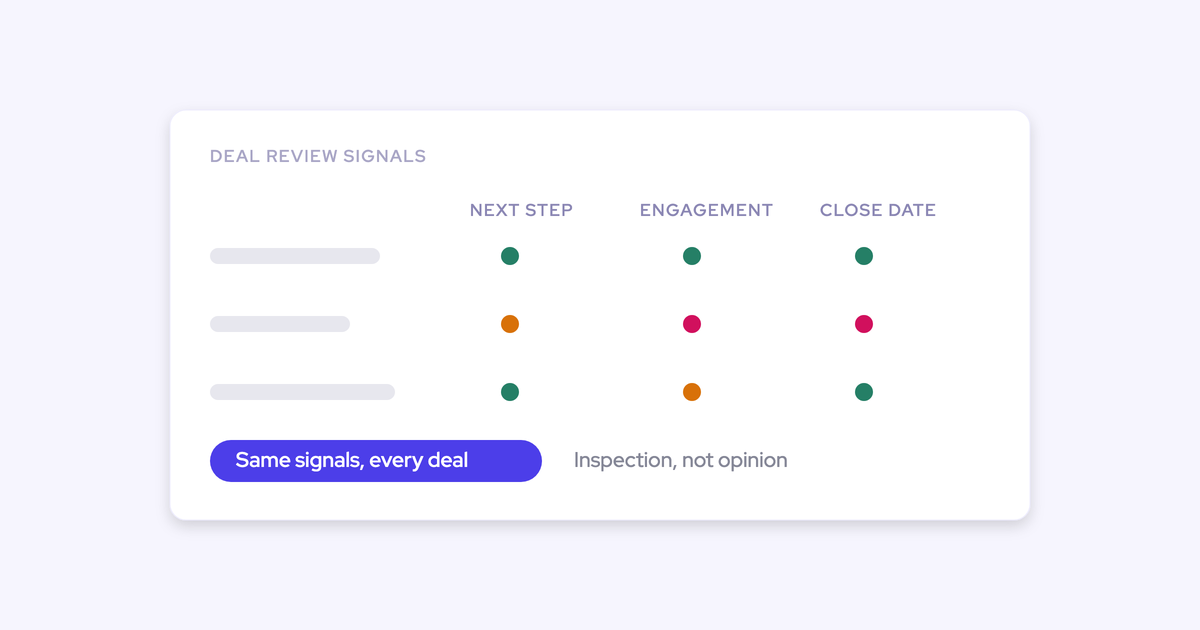
The signals that sit alongside the ratio, all computed from captured activity rather than typed by a rep:
- Deal count per rep, so coverage built from volume nobody can work is visible as volume.
- Days inactive and a rolling activity timeline, so dead pipeline stops counting as coverage.
- Close-date push count and time in stage, tracked automatically, so chronic slippage inside a future quarter is visible before it becomes this quarter's problem.
These matter more in an out-quarter read than in a current-quarter one, because pipeline for two quarters out has had less scrutiny and carries more of the bloat. If you take a number to the board, this is what makes it defensible when someone asks what it's made of.
What the weekly out-quarter review looks like in practice
It's a 20-minute pass, run weekly from roughly week six of the current quarter, and it ends in one decision rather than a discussion.
- Open the out-quarter pipeline view, filtered to the next target quarter, split by segment. Question: which segments are below the coverage they need at this point in the build? Threshold: any segment more than 20% below its own benchmark goes on the list.
- Check coverage against your own benchmark, not a borrowed multiple. Question: is this ratio low for this week of the build, or does it just look low? Threshold: compare against the same week in the last two or three quarters before reacting.
- Decompose every flagged segment. Question: is the coverage real, or is it deal count and stale opportunities? Threshold: if median deal count per rep is beyond what that team closes in a cycle, treat the ratio as unproven.
- Read the creation cohorts for the last two quarters at equal age. Question: is the pipeline being created converting at our normal rate? Threshold: a cohort tracking meaningfully below the norm at the same age is a qualification problem, not a volume problem, and more pipeline won't fix it.
- Make one call. Which segment gets the pipeline-generation intervention this week, and is it a volume intervention or a quality one? Write it down, and check next week whether the cohort moved.
Step five is the discipline. Everything before it is preparation, and a review that ends without a named segment and a named action is just another dashboard someone opened.
How Blockaid acts on pipeline risk early with Weflow
Acting early on pipeline risk is the whole outcome the out-quarter read exists to produce, and it's what Blockaid's RevOps team describes getting from Weflow.
"Weflow provides extraordinary visibility into pipeline health and progression, allowing us to act on risks early and make the right decisions."
Note what's doing the work in that sentence: progression, not just health. A snapshot of pipeline health tells you where you stand. Progression tells you which direction the number is moving and how fast, which is the only version of the information you can still act on.
Where Weflow fits if Clari already runs your forecast
You don't have to displace Clari to get this read, and in plenty of accounts you shouldn't try.
If a private equity sponsor has standardized on Clari across the portfolio, replacing it stops being a technical decision. RevOps leaders tell us they raised it internally and it was a non-starter. Fighting that is a political battle you lose in year one, whatever the evaluation says.
The realistic play there is coexistence, and it has a specific shape: run one capture infrastructure writing clean activity into Salesforce, let Clari read that Salesforce activity, and own the data layer underneath both. The failure mode isn't coexisting, it's running two capture engines at once, which produces duplicate activities and a mess nobody wants to own.
Now the honest part. If you're weighing a full replacement, here's what we tell people on calls:
That's a fair read and we don't argue with it. A team running a mature Clari configuration has years of accumulated setup, splits, dual date logic, a particular roll-up, and a replacement lands near that mark rather than above it. Weflow also has no equivalent of Clari's flow view. And forecasting proves out over cycles, not in a two-week trial: you need enough forecast periods to compare predicted against actual before anyone can judge it.
Run Weflow alongside Clari if:
- The Clari contract is mid-term or sponsor-mandated, and the CFO won't approve two forecasting tools.
- What you're missing is the out-quarter read, cohort conversion, and segmented coverage rather than the roll-up itself.
- Your activity and conversation data is thin, which is the layer Clari's forecast quality depends on and doesn't produce.
Consider replacing at renewal if:
- You've audited usage and the tool is doing three things: roll-up, simple pipeline analytics, and deal inspection, at a price that was never set for three things.
- Your conversation intelligence and your forecasting don't talk to each other, so call content never reaches the forecast.
- Every column change and new quarterly target goes through professional services, and your RevOps team has stopped asking.
Landing on capture and conversation intelligence first sidesteps the blocked renewal entirely, and expanding into forecasting later is a small per-user step rather than a second six-figure contract.
FAQ: assessing next-quarter pipeline with Weflow
Does the out-quarter view need the full Forecasting package?
Yes. Pipeline Analytics, which is where coverage, generation, and cohort views live, ships as part of the Forecasting package, and Pipeline Management is a separate product. Buying Pipeline Management, Activity & Contact Capture and Conversation Intelligence leaves you without an analytics or forecasting tab. In bundle terms that means Revenue AI Enterprise, or the standalone Deal Intelligence & Forecasting product. Worth knowing: the analytics upsell shows in-app even when the licence isn't there, which is a recurring source of confusion.
How much does Weflow cost compared with Clari?
Weflow runs $19 to $79 per user per month billed annually, with Deal Intelligence & Forecasting at $39 standalone and Revenue AI Enterprise at $79. Clari is reported at $120 to $180 per user per month, plus $15,000 to $50,000 in professional services implementation fees. Weflow charges no implementation fee and publishes its pricing; Clari is quote-only with no self-serve trial.
How much pipeline history does Weflow show on day one?
Opportunity snapshotting starts when Weflow is installed, so the cohort and waterfall reads get richer every week from that point. What you get immediately comes from the sync-back: historical activity and contact backfill of up to 24 months, which means the trial runs on your own Salesforce and months of real history rather than a demo org. The AI projection draws on up to two years of history where it exists. Be realistic about the sequence: coverage and out-quarter views are usable in week one, cohort trend reading gets genuinely sharp after a quarter or two of snapshots.
Who on the revenue team actually uses the out-quarter view?
Leadership and RevOps, and that's the honest answer rather than a dodge. Reps adopt activity capture and conversation intelligence because those give something back immediately; forecasting and pipeline analytics are a leadership motion by nature. It matters commercially too: unlimited view-only licences are included, so leaders and managers who only consume the analytics don't burn paid seats.
Can we slice out-quarter pipeline by our own segments and territories?
Yes. The out-quarter view filters by target quarter, segment, and stage, and coverage runs by segment, territory, and rep against the quotas you set in Weflow. The slices come from your own Salesforce fields and your own hierarchy, so the Nordics SME team and the KAM team are each their own read rather than rows in a fixed vendor hierarchy. You can also run separate forecast setups in parallel for new business, renewals, and expansion, each with its own revenue field, quota, and cadence.
If you want to check that the out-quarter view, the cohort read, and segmented coverage work the way this article describes, walk through the product yourself, no call required.



.webp)