
Pipeline Management vs Forecasting Tools: Two Jobs, and What Each One Can't Do
Learn what pipeline management vs forecasting tools can and can't do, and which problem you have.



You bought a forecasting tool. The roll-up works, the hierarchy resolves, the commit number lands in the board deck. And you still can't answer which deals have been sitting in the pipe forever, or what actually moved since last Tuesday.
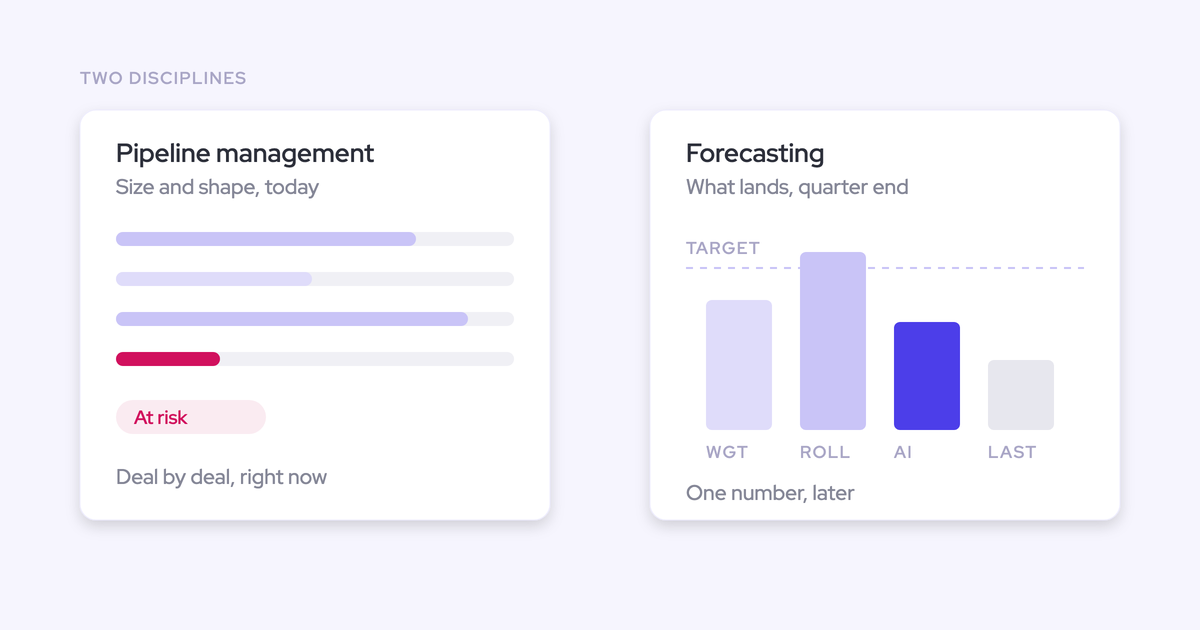
That gap isn't a configuration mistake. Pipeline management and forecasting are two different jobs that vendors market as one word. One inspects the size, shape, and movement of open pipeline. The other predicts the landing range derived from that pipeline.
This article draws the line where it's provable: at the Salesforce record. What gets snapshotted, what Salesforce can and can't history-track, what gets written where.
By the end you'll know which of the two jobs is broken in your org and be able to defend it internally. Weflow's Deal Intelligence & Forecasting runs both, and we'll be specific about where that helps and where it doesn't.
What is the difference between pipeline management and forecasting tools?
Pipeline management tools inspect the size, shape, and movement of open pipeline. Forecasting tools predict the landing range derived from that pipeline. Two disciplines, one feeding the other.
"And the pipeline is about the size and the shape. So the size is the deal sizes, the number of deals. The shape is going to be, you know, what stage they're in. And that should give you some ability to inspect the pipeline that it is one of high quality or low quality."
Jeff Ignacio, Growth & Revenue Operations Leadership Head of GTM Operations at Keystone AI, on the RevOps Lab podcast
The practical consequence: disciplined pipeline management produces a lower-variance forecast, and no forecasting method compensates for pipeline nobody inspected.
| Pipeline management | Forecasting | |
| Question it answers | What's in the pipeline, and how is it moving? | Where do we land, and how confident are we? |
| Primary user | Reps, frontline managers, RevOps | Managers, VPs, CRO, finance |
| Unit of work | The individual open deal | The submitted number and the roll-up |
| What the data has to support | Stored history of each record over time, plus derived per-deal signals | A hierarchy, a cadence, and submissions retained across quarters |
| What good looks like | Fewer stuck and inactive deals, slippage caught in week two | Submitted number lands within a tight band of actuals, measured every quarter |
Why vendors sell pipeline management and forecasting as one thing
Every tool in this space was built from one of two starting points, and each vendor markets its starting point as the whole category.
Roll-up-first tools start with the submission, the hierarchy, and the board number. Inspection gets added later as reporting on the CRM's current state.
Inspection-first tools start with the record and its history, and the forecast is derived on top.
Both get called "revenue intelligence" on the website, which is why you can't tell them apart from a feature grid.
Buying both jobs from one vendor also doesn't guarantee they share data. Clari's conversation intelligence product arrived through the Wingman acquisition in 2022, Groove arrived in 2023, and the Salesloft merger added a fourth application in December 2025. Each came with its own data model, and the forecasting product still doesn't read the call data.
So here are two questions worth asking any vendor before the demo: where does the pipeline history physically live, and can the tool compute a field my CRM doesn't already hold? The answers separate the two categories faster than an hour of screens.
What Salesforce records can't tell you about pipeline movement
Salesforce overwrites the field. It records how a field changed over an opportunity's lifetime only if field history tracking was switched on for that field in advance, and calculated or roll-up fields can't be history-tracked at all.
That last part catches teams out. The custom ARR or converted-amount field you actually forecast on is often exactly the calculated field that can't be tracked.
Without stored history, these questions have no answer after the fact:
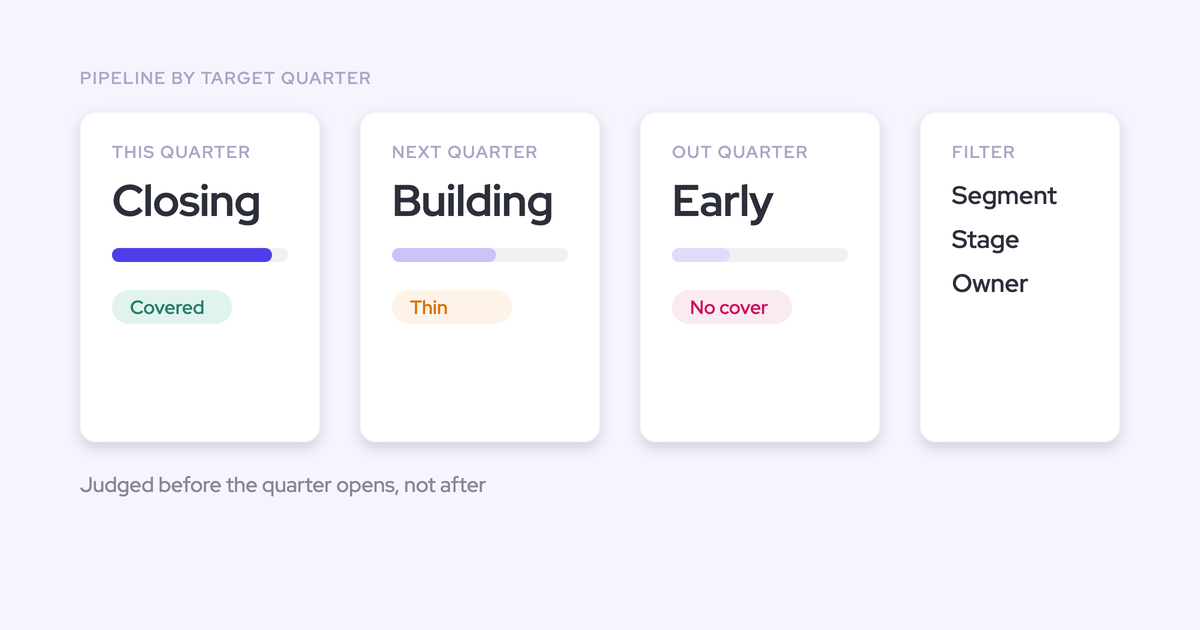
- Which deals slipped out of this quarter, and in which week did they move?
- What was created mid-quarter, and what was quietly pulled in from next quarter?
- When was the amount cut, and by how much?
- How are we tracking at day 35 compared with day 35 of the last three quarters?
That's a RevOps leader on a call with us, and it's the fork in the road. Either an external system snapshots opportunity-level data on a schedule, or a management question becomes a data engineering project with a bill attached. Native Salesforce forecasting doesn't close the gap: no waterfall, no pipeline history, and quota tracking lives somewhere else entirely.
What a pipeline management tool does to your pipeline data
Pipeline management turns stored snapshots and captured activity into answers the live record can't give: what moved, and which deals are actually alive.
Two components carry the job. One works at the level of the whole pipeline, the other at the level of a single deal.
Example below from Weflow's Pipeline Dashboard.
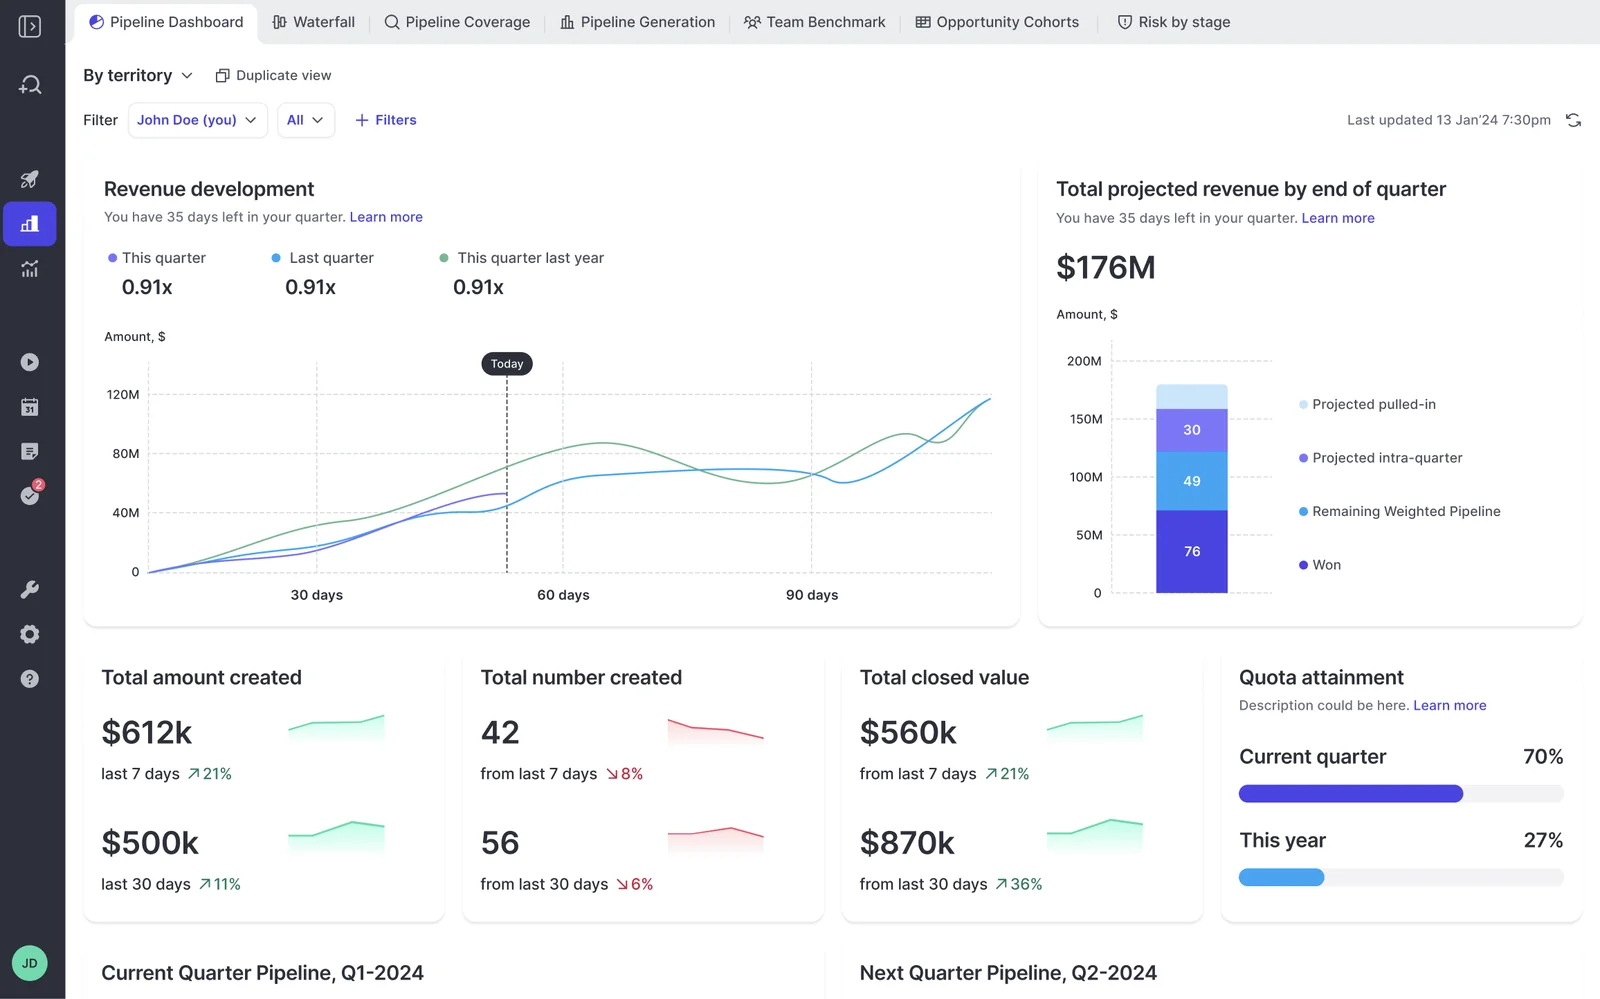
Pipeline waterfall analysis: showing what moved, not two dates
A real waterfall reconciles starting pipeline to ending pipeline by decomposing the change into buckets:
- Deals created during the period
- Amounts increased on existing deals
- Deals moved into the period from elsewhere
- Deals moved out of the period
- Amounts decreased
- Deals won
- Deals lost
The middle buckets are the point. Moved out and decreased are the early warning that a quarter is drifting, and neither shows up in a snapshot of today's pipeline.
A waterfall also exposes chronic slippage and sandbagging: a total that looks stable quarter after quarter while the same deals get pushed underneath it.
One requirement makes or breaks it. Each bucket has to drill through to the actual opportunities. A waterfall that names a problem without naming the deals causing it just moves the argument to the next meeting.
Deal health signals: days in stage and close-date pushes
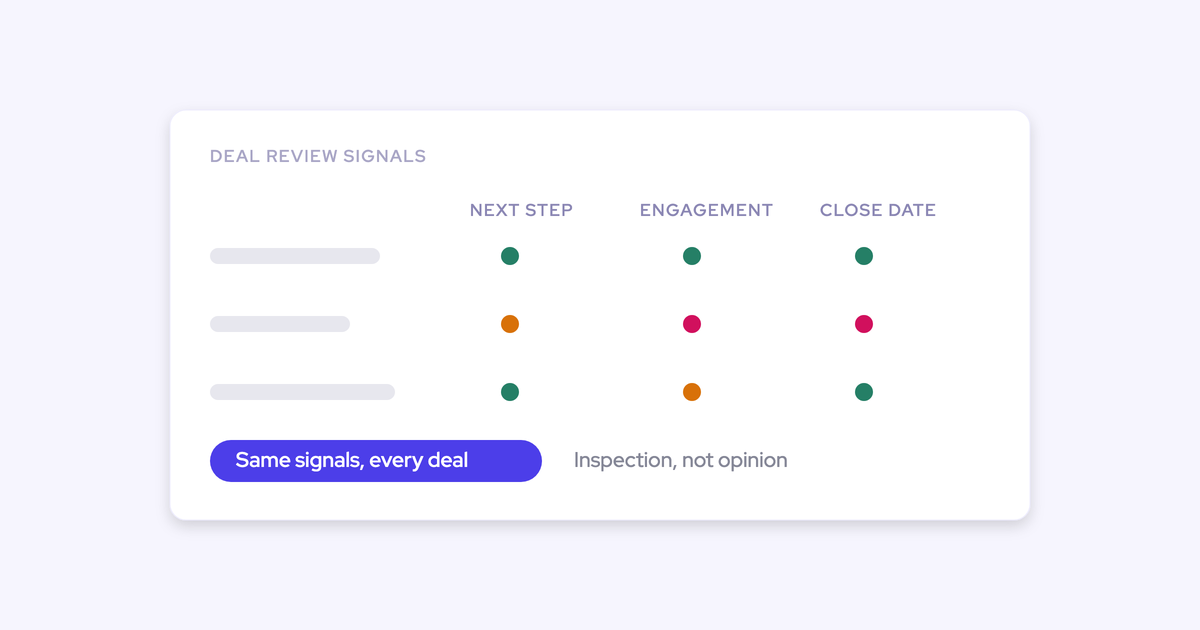
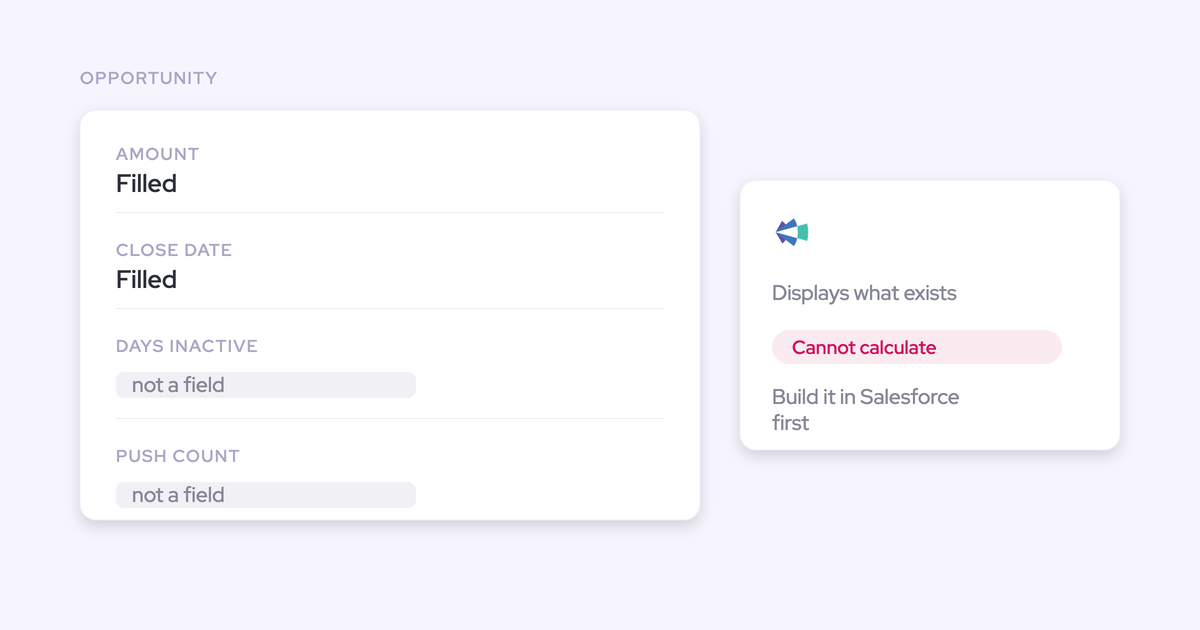
Deal health is read from derived signals, not from anything a rep types: days in stage, close-date push count, days inactive, whether more than one contact is engaged.
That's from a RevOps leader who already pays for a forecasting tool. In a roll-up, a dead deal and a live one look identical.
Two things make these signals usable. First, they have to be computed rather than self-reported, because a rep who won't close a deal lost also won't flag it as stalled. Second, they need a benchmark built from your own closed-won history. Sixty days in stage means nothing until you know that deals which actually closed spent thirty.
The downstream cost of skipping this is worse than a messy pipeline. Dead opportunities stretch your average sales cycle, so the benchmark you use to judge whether a live deal is late is itself wrong.
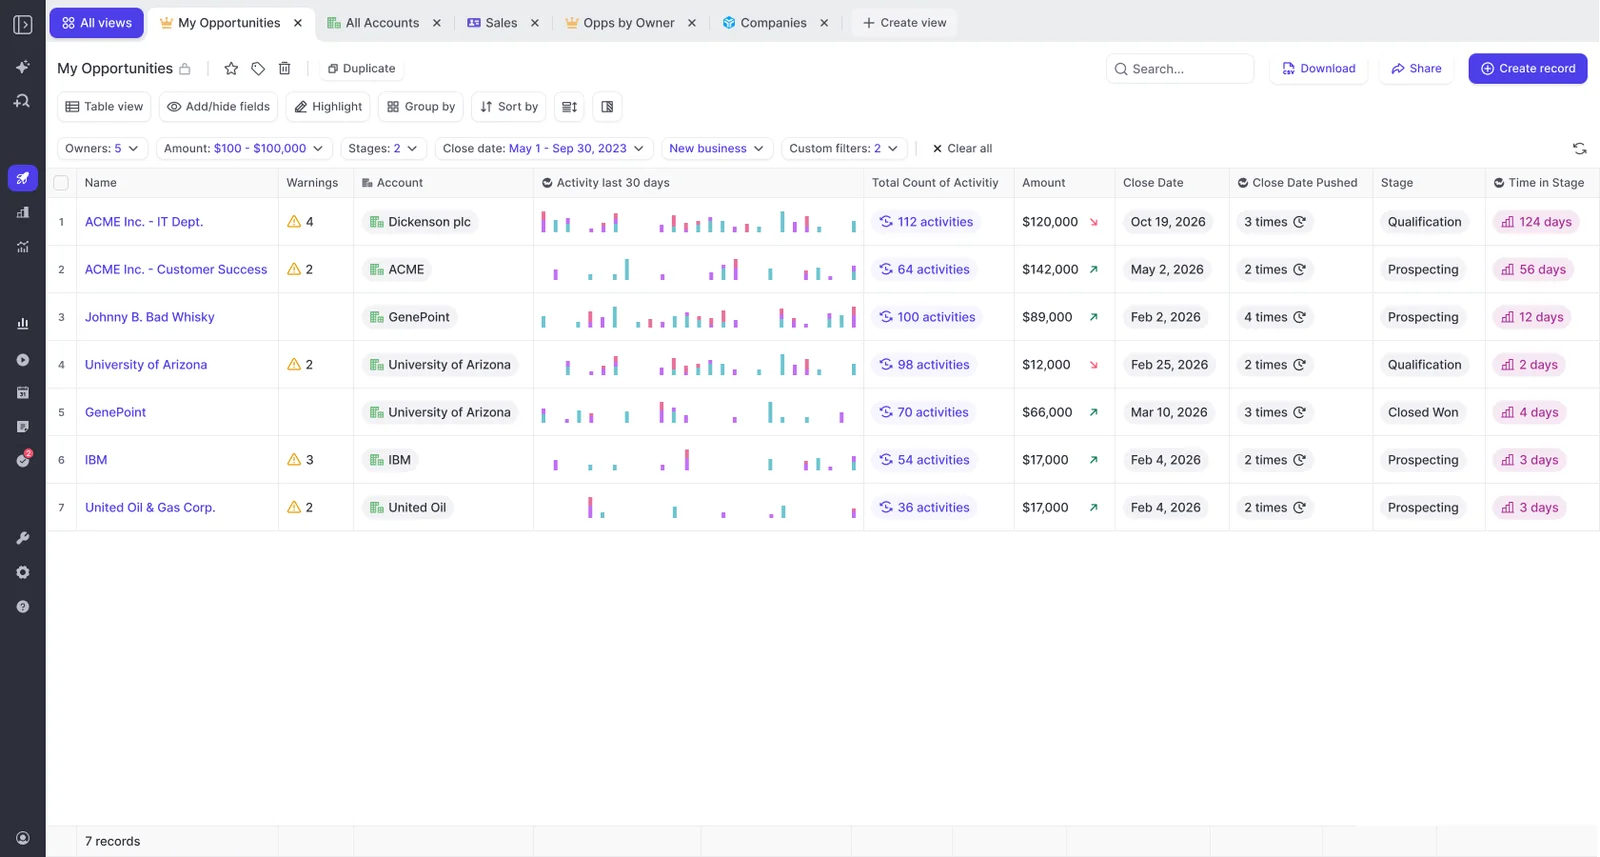
HolidayCheck cut past-due opportunities by around 75% and inactive opportunities by over 60% after making these signals visible on the deal. Nothing clever happened. Reps arrived at meetings already knowing what was overdue.
What a forecasting tool does: submissions, roll-up, and the number
Forecasting is the operating cadence that produces a defensible number. It's a real discipline, and a strong roll-up product earns its keep here.
- Reps update their pipeline by a fixed day each week.
- Managers run deal reviews against that updated pipeline.
- Reps submit, ideally two numbers: a baseline they're confident in and a best case if timing goes their way.
- Managers review and override, with the original submission retained next to the change.
- The call rolls up the hierarchy automatically to VP and executive level.
- Methods get compared: weighted from historic stage conversion, the team roll-up, an AI projection.
- Accuracy is measured after the quarter, per rep and per manager, against what actually closed.
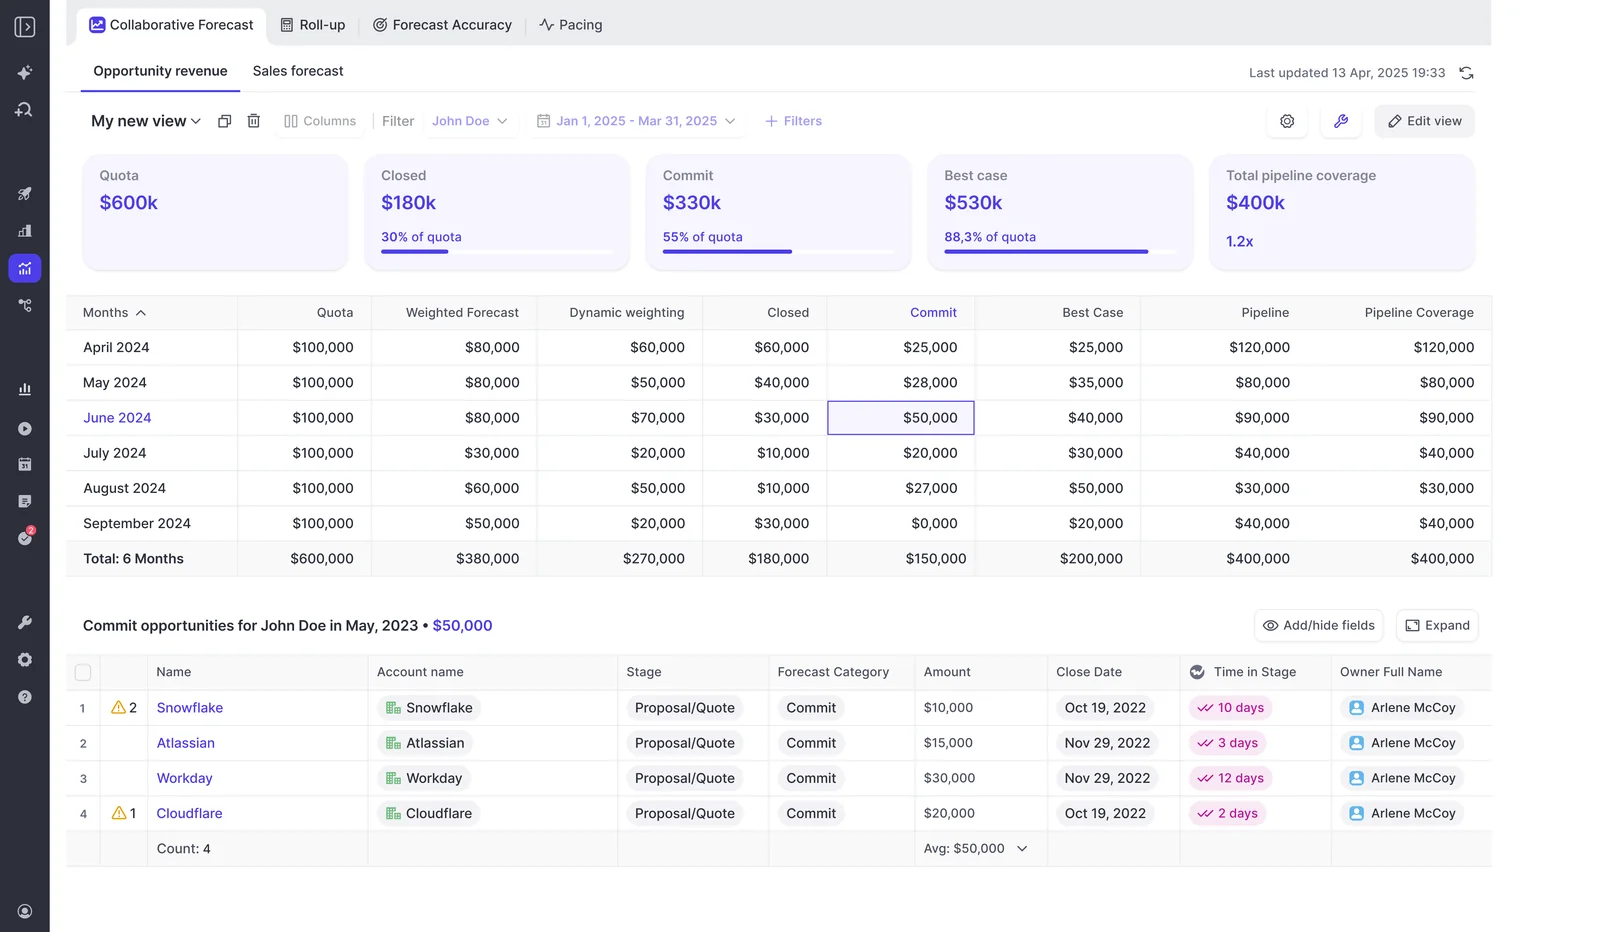
Credit where it's due: Clari is genuinely strong and flexible at roll-up. Long-time users praise the same thing, being able to see and edit the whole forecast inline, and flexible roll-up mechanics at scale are not trivial to build.
What roll-up-first forecasting tools like Clari can't show you
An overlay that reads the CRM's current state can compare two dates. It can't show you what moved between them, and it can't compute a field your CRM doesn't already hold.
That's a buyer describing the architecture, not a competitor. It has three consequences you feel weekly.
| What you ask on a Monday | What a two-date overlay returns |
| Which deals slipped out of the quarter, and when? | Pipeline on date A versus pipeline on date B. The deals in between aren't itemized, so the analysis gets rebuilt in a BI tool every cycle. |
| How long has this deal sat in stage, how many times has the close date moved? | Only what Salesforce already holds. A derived field has to be specified, built, and maintained as a formula field in Salesforce first. |
| Show me the swing between what the rep submitted and what the manager called. | Not computable in the tool. It becomes a change request on your Salesforce backlog. |
| How accurate was last quarter's commit? | No forecast-versus-actual variance tracking. |
The second row is the expensive one. You end up creating Salesforce fields whose only purpose is to make a column possible in the reporting tool, which is CRM debt manufactured by the layer that was supposed to reduce it.
And because deal-by-deal health can't be assessed without those derived signals, the forecast stays a well-organized opinion. That's the mechanical reason behind the complaint we hear most often at renewal:
What pipeline inspection can't do without a forecast process
Inspection doesn't produce a number. If your problem is forecast process, no waterfall in the world fixes it.
Only a forecast cadence gives you:
- A submission from each level of the chain, so you can see whose judgment moved the number
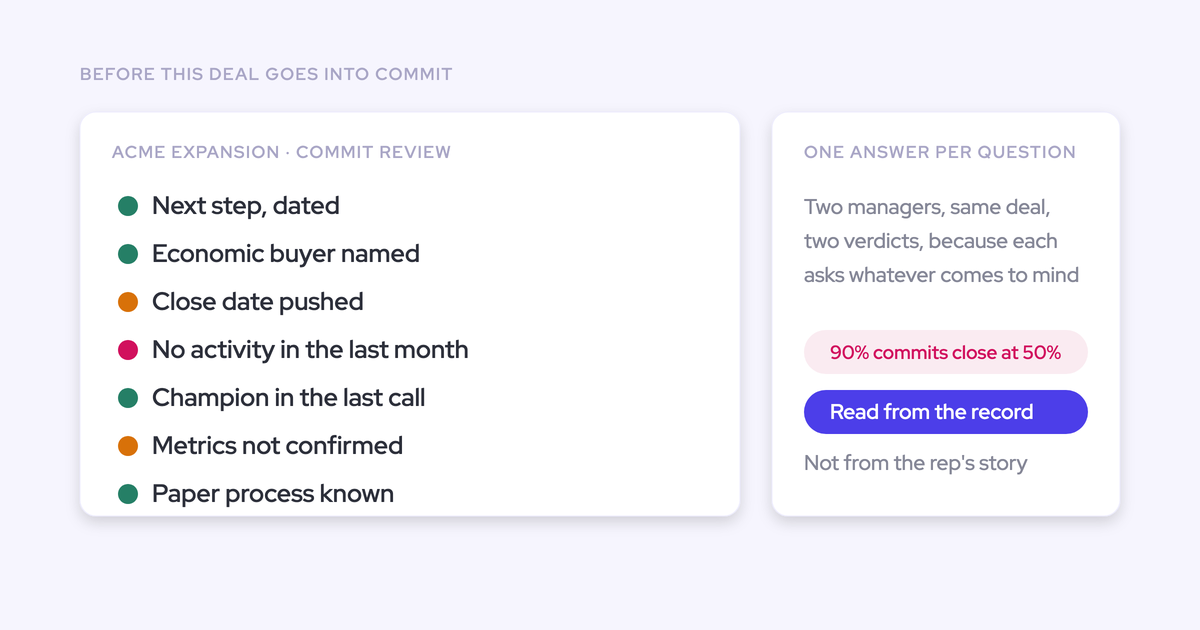
- A shared definition of commit that can be evidenced rather than asserted
- Retained history of every revision, which is what makes a forecast call coachable
- Accuracy measured after the quarter, per rep, so habitual sandbagging becomes visible
- One figure the CFO and the board can plan against
"Forecasting is really like a muscle you need to train and the number in the end, that's sort of the outcome of a long, long training cycle, exercise cycle that you went through before."
Janis Zech, Co-founder and CEO of Weflow
We say this to prospects before we show them anything: if there's no locked pipeline update day, no defined deal review, and no agreed commit criteria, a forecasting tool automates nothing. It reports the same suspicion faster.
How to tell which job is broken before you buy
Match the symptom to the job, then to a tooling shape. Some of these cost nothing to fix.
| Symptom | Job that's broken | What actually fixes it |
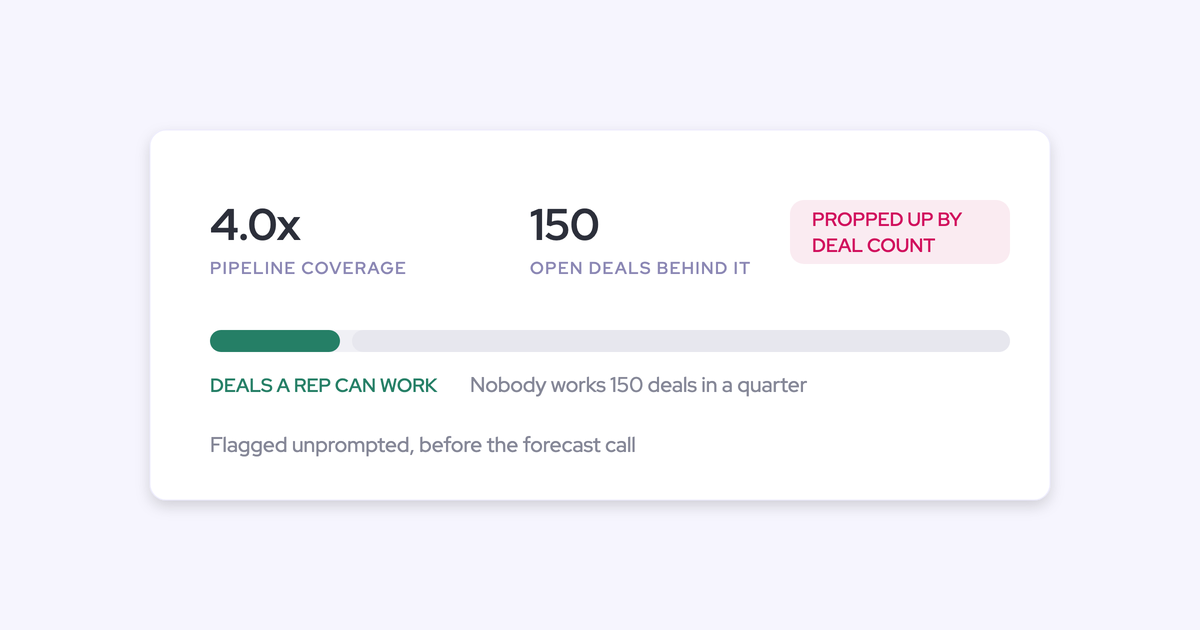
| Coverage looked healthy in week one and evaporated by week six | Inspection | Snapshots plus deal-level warnings, reviewed in their own session outside the forecast call |
| Nobody can say what moved since last week | Inspection | Time-series opportunity snapshots with a drillable waterfall |
| Every deal gets defended and none get killed | Inspection | Days in stage and push count, benchmarked against your own closed-won history |
| Commit is called at 90% confidence and 60% closes | Process | Written commit criteria and per-rep accuracy measured after the quarter. No purchase required |
| Reps never submit; the manager types the number | Process | A submission motion with deadlines and retained versions, not another dashboard |
| The forecast deck gets rebuilt in a BI tool every cycle | The tool | Check whether it can compute a derived field at all. If not, you'll keep rebuilding |
Two tools is a defensible answer if your forecast config is mature and your inspection layer is missing. One tool is the better answer when both jobs run off the same captured data, because deal health then becomes assessable instead of asserted.
And if the top two rows of that table are empty for you but the middle two aren't, don't buy anything this quarter. Fix the cadence first.
How Weflow runs both jobs on one snapshot foundation
Weflow is the Revenue AI Orchestration platform for sales, customer success, and RevOps teams. Both jobs run on one foundation: Weflow snapshots opportunity data every few hours and builds the waterfall, pacing, stage conversion, and benchmarks from that time series, so each bucket clicks through to the deals behind it.
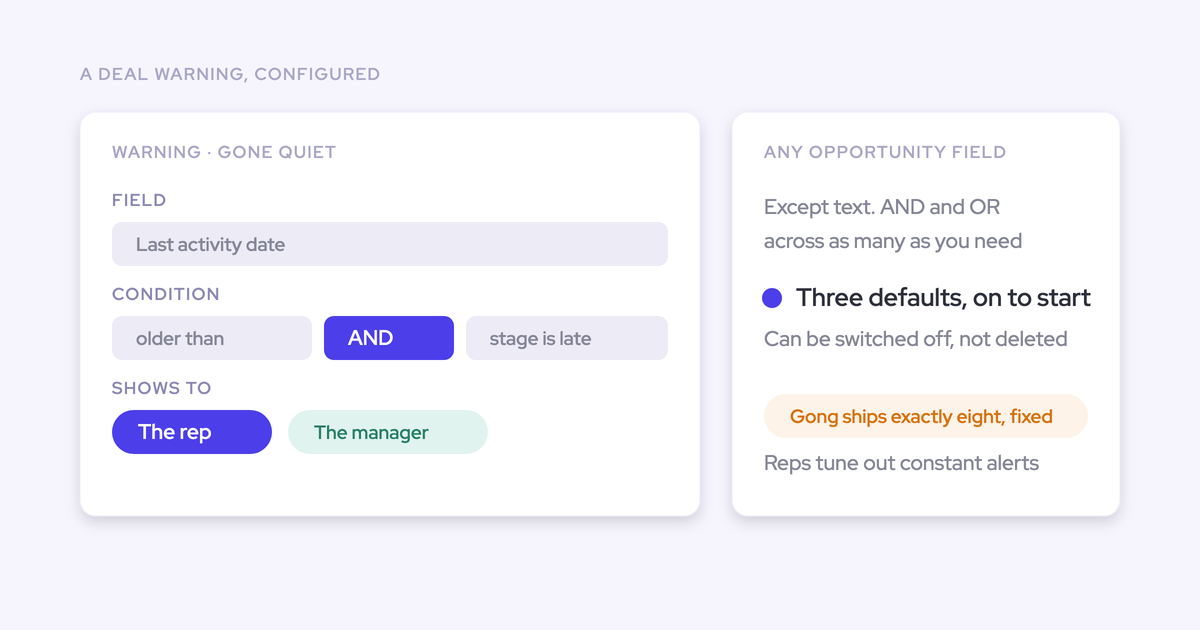
Days in stage and close-date push count sit on every opportunity without anyone building a custom field for them. Warnings are rules you author against any Salesforce field or any of those computed fields, and they surface inside the forecast submission screen, at the moment a rep decides what to commit.
That's the structural argument: the same captured activity and conversation data feeds the inspection layer and the forecast, so the number inherits pipeline someone actually looked at.
Three limits, stated plainly:
- Weflow has no pipeline flow view. Clari has one, and if your team lives in it, that's a real gap.
- Forecast submissions, targets, and roll-up data live in the Weflow app rather than in Salesforce fields. Everything else, activity, transcripts, summaries, AI field updates, and opportunity edits, writes back to native Salesforce objects.
- On a switch from a mature multi-year Clari configuration, forecast parity lands around 80% on day one. The splits and dual-date logic built up over years take work to rebuild. One buyer treated our forecasting as the counterweight while the inspection layer was the reason to move.
Free Guide: Deal Insights & Pipeline Management Best Practices
FAQ: choosing between pipeline management and forecasting tools
Can you license pipeline management without buying forecasting?
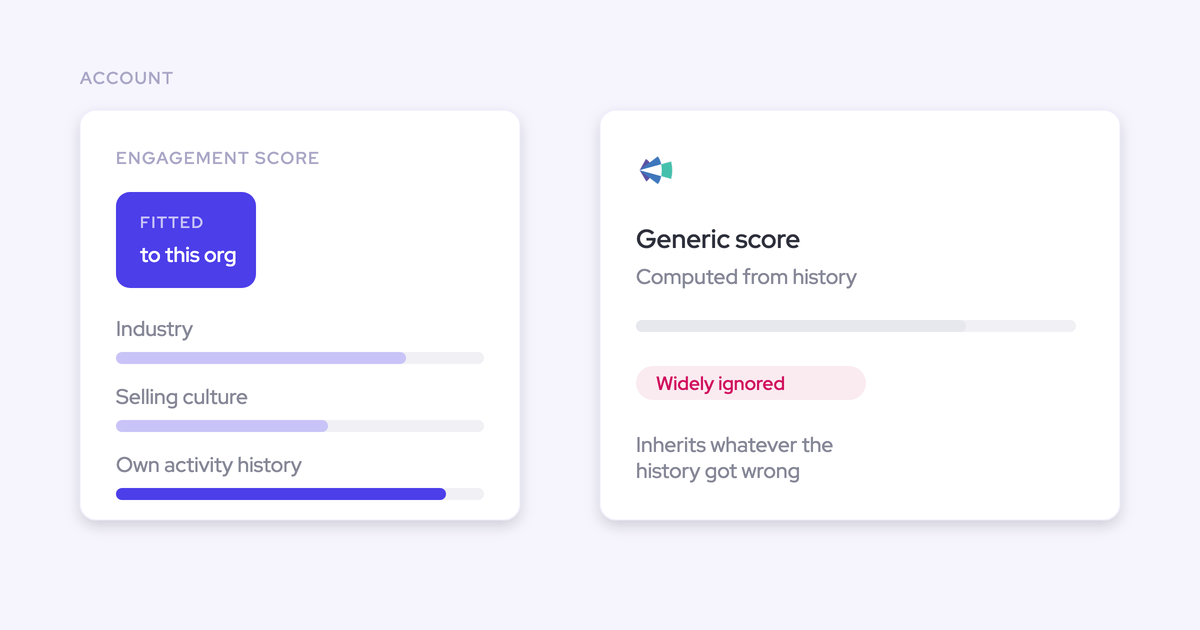
Partly, and this is where the packaging trips people up. Revenue AI Business includes Deal Intelligence, which covers table and Kanban pipeline views, AI deal and account scoring, warnings, and buying committee intelligence, but not pipeline analytics or forecasting.
Pipeline Analytics, including the waterfall, is generated from forecast configurations, so it ships with the forecasting package. If the waterfall is what you came for, the route is Deal Intelligence & Forecasting standalone at $39 per user per month, or Revenue AI Enterprise at $79.
Can a pipeline management tool run alongside Clari?
Yes, and it's the pattern we recommend when the forecasting tool is locked in by a renewal or a private equity sponsor. Clari reads activities out of Salesforce, so Weflow captures activity and conversation data into Salesforce and Clari consumes the cleaner data. Both get better.
The one failure mode: don't run two capture engines at once. Turning on Weflow capture and Clari Capture together creates duplicate activities. Pick one capture infrastructure.
Does forecast submission data write back to Salesforce?
No, and we'd rather say so upfront. Forecast submissions, targets, and roll-up data live in the Weflow application. Everything else lands in native Salesforce objects you own, and opportunity edits made in Weflow write straight back, so the Salesforce record stays the source of truth for the deal.
If you snapshot forecasts into a BI tool, you pull the roll-up through the public API rather than reading it from Salesforce. And if your rule is that reps live in Salesforce only, the weighted forecast and the AI projection still work, because neither needs rep input.
What do pipeline management and forecasting tools cost?
Weflow's Deal Intelligence & Forecasting is $39 per user per month billed annually, with bundles at $49, $59, and $79. Minimum ten users, no implementation fees.
Our read on Clari is $120 to $180 per user per month, plus $15,000 to $50,000 in professional services to implement, with no standalone products and no free trial.
The packaging logic matters more than the sticker. A CFO who just signed a forecasting renewal won't approve a second forecasting contract, so the sane entry point is a capability you don't already own, with forecasting added later for roughly $10 more per user per month.
Will reps actually use a pipeline inspection tool?
Reps don't adopt forecasting tools. Leaders do.
Activity capture and conversation intelligence are the rep-facing layers, because they remove work rather than add oversight. Deal intelligence is shared ground. Forecasting is a leadership motion, and it's the one that needs a cadence agreed before anyone logs in.
So roll out in that order: capture, then conversation intelligence, then pipeline and deal inspection, then forecasting. Do it in reverse and you'll be asking reps to submit numbers built on data they already know is wrong.



.webp)