
32 Salesforce KPIs to Track Across Pipeline, Activity, and Revenue
Learn 32 Salesforce KPIs for pipeline, activity, conversion, and revenue, plus formulas and benchmarks.




32 Salesforce KPIs every sales leader should track
Salesforce holds every data point your revenue team generates—deals, activities, contacts, forecast submissions. But raw data isn’t visibility. The difference between a CRO who can defend a forecast and one who’s guessing comes down to which KPIs they’re tracking, how those KPIs are calculated, and whether the underlying Salesforce data is accurate enough to trust.
This guide covers 32 Salesforce KPIs across four categories: pipeline health, rep activity, conversion efficiency, and revenue performance. Each KPI includes a formula, a definition, and—where industry data exists—a benchmark. Whether you’re building your first Salesforce dashboard or rebuilding a reporting framework after a CRM cleanup, this is the reference list.
What are Salesforce KPIs (and how are they different from sales metrics)?
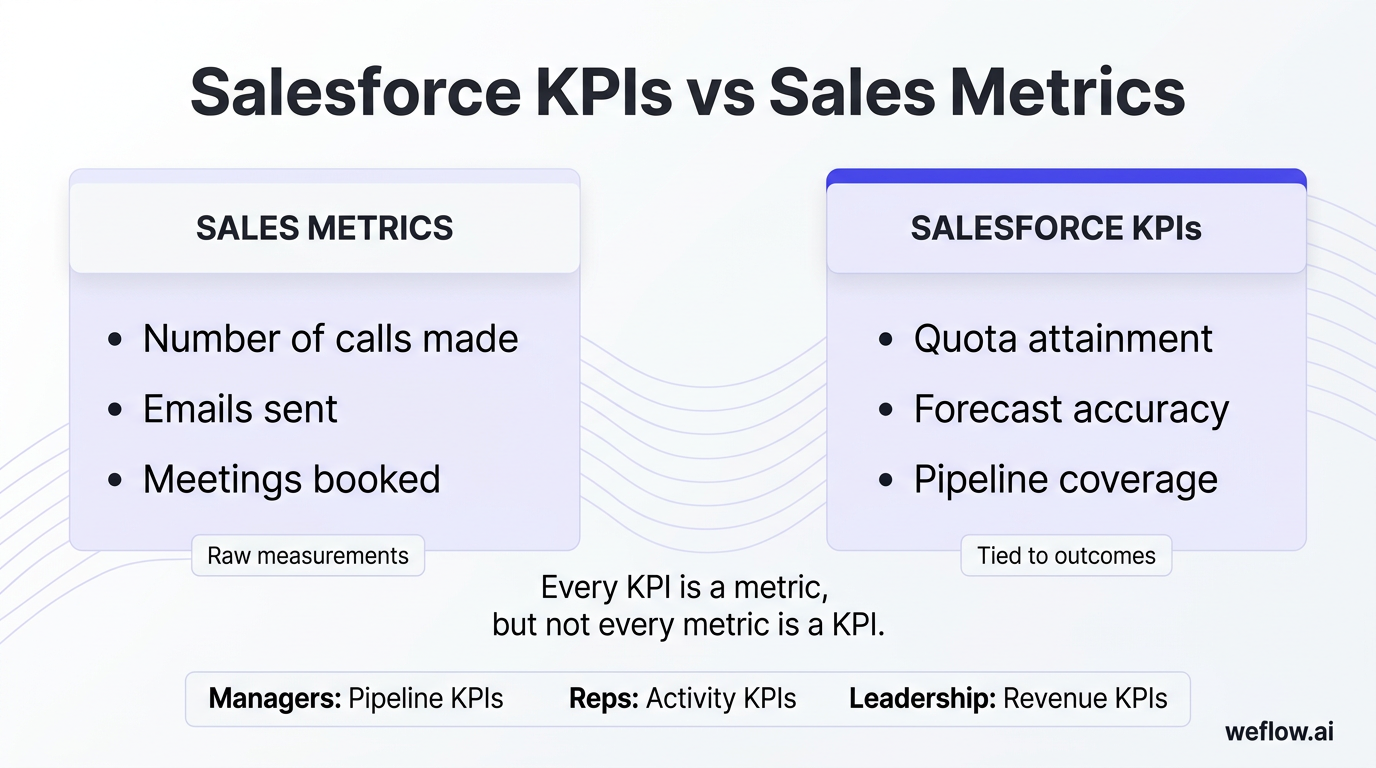
A Salesforce KPI is a measurable value that tells you whether your revenue team is on track to hit a specific goal. KPIs are tied to outcomes: quota attainment, forecast accuracy, pipeline coverage. Metrics are the raw measurements underneath—number of calls made, emails sent, meetings booked. Every KPI is a metric, but not every metric is a KPI.
The distinction matters because Salesforce can generate hundreds of metrics. Tracking all of them creates dashboard clutter. Tracking the right eight to 12 KPIs per role—pipeline KPIs for managers, activity KPIs for reps, revenue KPIs for leadership—gives each stakeholder a clear signal without the noise.
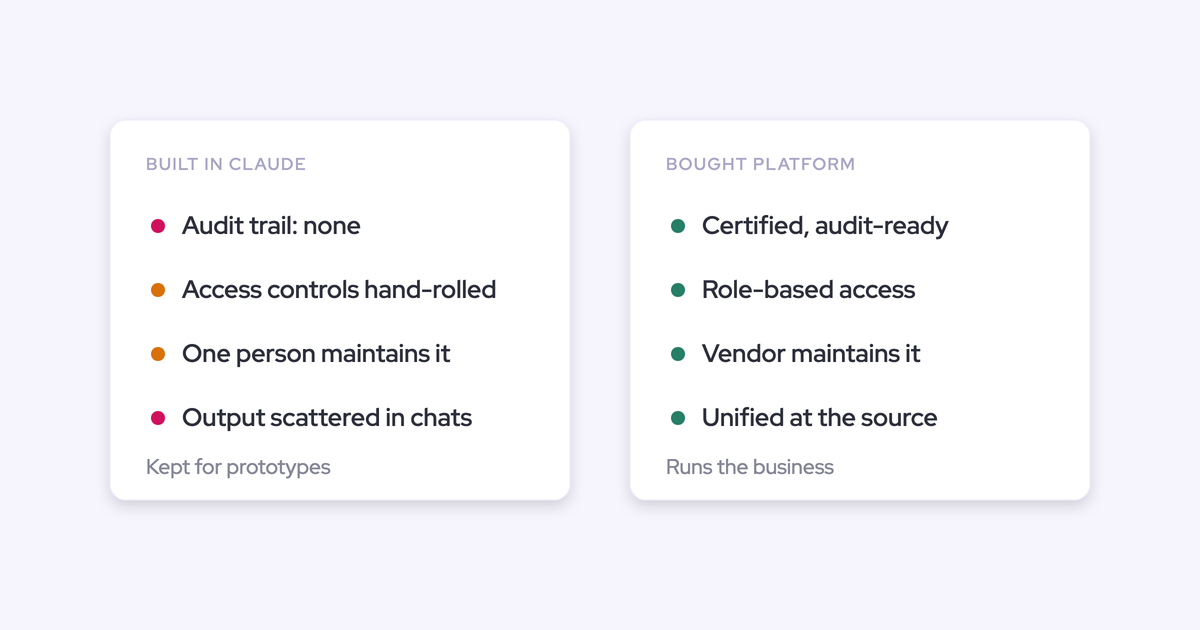
One more thing: KPIs only work if the data behind them is complete. If reps aren’t logging activities, if deal stages are stale, if contacts aren’t associated to opportunities—your KPIs will show you a polished version of bad data. Fixing data capture is step zero. The KPIs below assume you’ve solved that problem (or are using a tool like Weflow, a Salesforce-native revenue AI platform, to solve it automatically).
32 Salesforce KPIs by category
Pipeline KPIs
Pipeline KPIs measure the health, velocity, and predictability of your open deals. These are the KPIs your CRO and sales managers review weekly to assess whether there’s enough pipeline to hit the quarter.
1. Open pipeline value
The total dollar value of all open opportunities in your pipeline at a given point in time. This is the starting point for every pipeline conversation—it tells you how much potential revenue is in play before applying any weighting or qualification filters.
Formula: Sum of Amount on all open Opportunity records (Stage ≠ Closed Won or Closed Lost)
Benchmark: Varies by segment. The number itself isn’t the KPI—pipeline coverage ratio (below) gives it context.
2. Pipeline coverage ratio
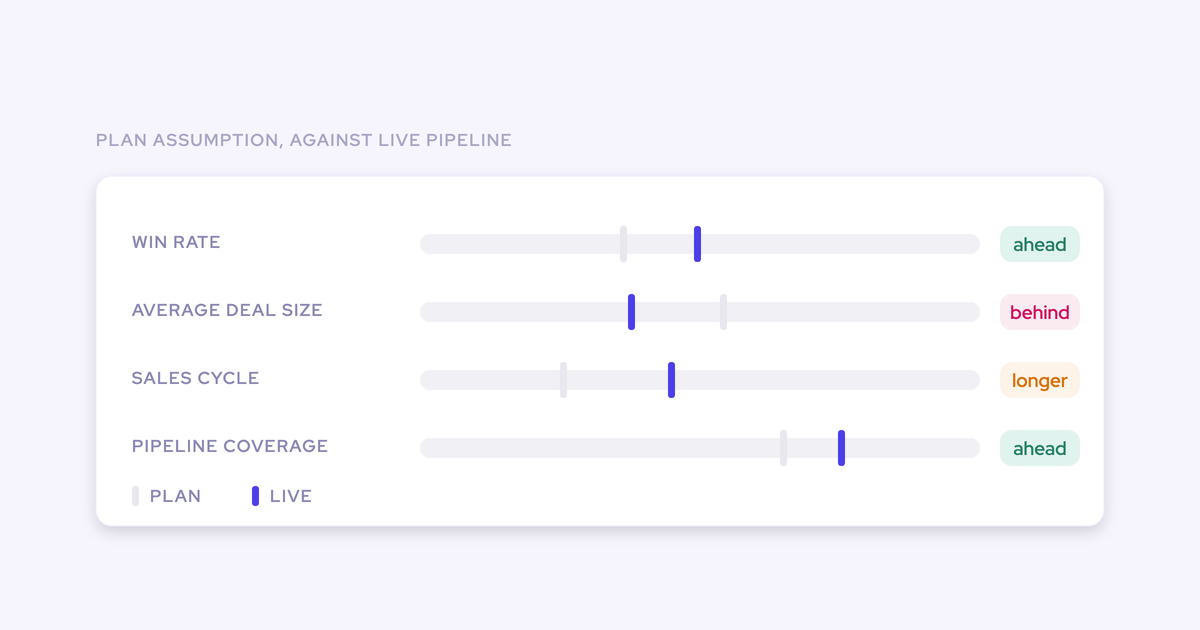
How much pipeline you have relative to your quota target. A coverage ratio of 3x means you have $3 in pipeline for every $1 of quota. This is the single most-referenced pipeline KPI in board meetings and forecast calls.
Formula: Open Pipeline Value ÷ Remaining Quota for the Period
Benchmark: 3x–5x for B2B SaaS. Early-stage pipelines need higher coverage because win rates are lower. Enterprise deals with longer cycles typically need 3x–4x.
3. Pipeline velocity
How fast revenue moves through your pipeline, measured in dollars per day. Pipeline velocity combines deal count, average deal size, win rate, and sales cycle length into a single number—making it one of the most useful composite KPIs for forecasting.
Formula: (Number of Opportunities × Average Deal Size × Win Rate) ÷ Average Sales Cycle Length (in days)
Benchmark: No universal benchmark—track month-over-month trends. A declining velocity with stable deal count usually means deals are stalling or average deal sizes are dropping.
4. Pipeline forecast
The weighted value of your pipeline based on stage probabilities or rep-submitted forecast categories (Commit, Best Case, Upside). Unlike raw pipeline value, this applies probability to give you a more realistic expected revenue number.
Formula: Sum of (Opportunity Amount × Stage Probability) for all open opportunities, or sum of amounts in Commit + weighted Best Case
Benchmark: Compare against actual closed revenue each quarter. Forecast accuracy within 5–10% is strong for mid-market B2B.
5. Average deal size by segment
The average dollar value of closed-won deals, broken out by segment (SMB, Mid-Market, Enterprise). Tracking by segment prevents a few large enterprise deals from masking a decline in your core mid-market motion.
Formula: Total Closed-Won Revenue in Segment ÷ Number of Closed-Won Deals in Segment
Benchmark: B2B SaaS mid-market average deal sizes typically range from $15,000–$75,000 ACV. Enterprise deals: $100,000+.
6. Deal slippage rate
The percentage of deals that miss their projected close date and push to a future period. High slippage erodes forecast accuracy and signals that reps are setting optimistic close dates or that deals are stalling in late stages.
Formula: Deals That Pushed Past Original Close Date ÷ Total Deals Forecasted to Close in Period × 100
Benchmark: 20–30% slippage is common in B2B. Below 15% indicates strong deal qualification and realistic close date setting.
7. Time in stage
The average number of days an opportunity spends in each pipeline stage before advancing or closing. Spikes in time-in-stage for a specific stage often reveal process bottlenecks—like deals stalling at the proposal stage because of slow legal review.
Formula: Average of (Date Exited Stage − Date Entered Stage) for all opportunities in a given stage
Benchmark: Define internal benchmarks based on historical closed-won deals. Flag any deal sitting 2x longer than your stage average.
Activity KPIs
Activity KPIs measure what your reps are doing day-to-day—calls, emails, meetings, demos. These KPIs matter because pipeline doesn’t build itself. If activity drops, pipeline follows six to eight weeks later.
8. Lead response time
The time between when a lead enters Salesforce (web form, MQL handoff, inbound call) and when a rep makes first contact. Speed-to-lead is one of the highest-impact KPIs in sales—response time directly correlates with conversion rates.
Formula: Average of (First Activity Date/Time − Lead Created Date/Time)
Benchmark: Under five minutes for inbound leads is the gold standard. Harvard Business Review research shows that responding within five minutes makes you 100x more likely to connect than waiting 30 minutes.
9. Follow-up contact rate
The percentage of leads that receive at least one follow-up after the initial outreach. Many leads go cold not because of poor qualification but because reps don’t follow up consistently.
Formula: Leads with 2+ Logged Activities ÷ Total Leads Assigned × 100
Benchmark: 80%+ follow-up rate for assigned leads. If reps are following up on fewer than 60% of assigned leads, you’ve got a process or capacity problem.
10. Sales activity volume (calls, emails, tasks)
The total number of logged activities per rep per day or week—calls, emails, tasks, and meetings combined. This is the baseline activity KPI that everything else builds on.
Formula: Count of Task and Event records per rep per period
Benchmark: Varies by role. SDRs: 50–80 activities/day. AEs: 20–40 activities/day. Note: these benchmarks assume activities are actually logged in Salesforce. Without automated capture, reported numbers are typically 30–50% lower than actual.
11. Outbound call volume
The number of outbound calls logged per rep per day. Tracks prospecting effort for outbound-driven teams and SDR orgs.
Formula: Count of Task records where Type = Call and Call Direction = Outbound, per rep, per day
Benchmark: SDRs: 40–60 calls/day. AEs doing their own prospecting: 15–25 calls/day.
12. Outbound contact rate
The percentage of outbound calls that result in a live conversation (connected calls). This measures the effectiveness of prospecting, not just the volume.
[banner type="download" url="https://www.weflow.ai/resources/cheat-sheets/sales-onboarding-cheat-sheet" text="Sales Onboarding Cheat Sheet" subtitle="Cut ramp time so new hires contribute to pipeline this quarter, not next" button="Get the cheat sheet"]
Formula: Connected Calls ÷ Total Outbound Calls × 100
Benchmark: 5–15% contact rate for cold outbound. If you’re below 5%, review call timing, list quality, and dialing strategy.
13. Demos scheduled
The number of product demos or discovery calls scheduled per rep per period. For teams with a demo-driven sales motion, this is the bridge between prospecting activity and pipeline creation.
Formula: Count of Event records where Type = Demo or Discovery, per rep, per period
Benchmark: SDRs: 10–20 demos/month. AEs self-sourcing: 4–8 demos/month.
14. Email open and reply rate
The percentage of sales emails that get opened and replied to. Tracks the effectiveness of rep messaging. Open rates tell you about subject lines; reply rates tell you about relevance and value prop.
Formula: Open Rate = Emails Opened ÷ Emails Sent × 100. Reply Rate = Emails Replied ÷ Emails Sent × 100
Benchmark: B2B sales emails: 30–50% open rate, 5–15% reply rate. Personalized emails from reps outperform sequences by 2–3x on reply rate.
15. Meeting-to-opportunity rate
The percentage of completed meetings (demos, discovery calls) that result in a new opportunity being created. Measures the quality of meetings and the effectiveness of early-stage qualification.
Formula: Opportunities Created ÷ Completed Meetings × 100
Benchmark: 30–50% for well-qualified inbound meetings. 15–25% for outbound-sourced meetings.
Conversion KPIs
Conversion KPIs measure how efficiently your funnel turns leads into pipeline and pipeline into revenue. These are the KPIs that connect marketing’s work to sales outcomes and help you diagnose where deals are dying.
16. Total inbound leads
The total count of new leads entering Salesforce from inbound channels (website, content, events, referrals) per period. This is the top-of-funnel volume metric that everything downstream depends on.
Formula: Count of Lead records created where Lead Source = Inbound, per period
Benchmark: Depends entirely on your go-to-market motion. Track month-over-month trends and conversion rates rather than absolute numbers.
17. Lead-to-opportunity ratio
The percentage of leads that convert into qualified opportunities. This is the handoff metric between marketing and sales—if leads are coming in but not converting, either lead quality is poor or sales follow-up is broken.
Formula: Opportunities Created from Leads ÷ Total Leads × 100
Benchmark: 10–15% for B2B SaaS with a mix of inbound and outbound. Pure inbound motions with strong qualification: 20–30%.
18. Opportunity win rate
The percentage of opportunities that close as won. This is the most-watched conversion KPI in most sales orgs and a direct input to pipeline coverage calculations and forecasting models.
Formula: Closed-Won Opportunities ÷ (Closed-Won + Closed-Lost Opportunities) × 100
Benchmark: B2B SaaS average: 15–25%. Top-performing teams: 25–35%. Enterprise with strong qualification: 30–40%.
19. Lead conversion rate
The percentage of leads that convert to a Contact and associated Opportunity in Salesforce. Different from lead-to-opportunity ratio because it tracks the Salesforce-specific conversion action, not just opportunity creation.
Formula: Converted Leads ÷ Total Leads × 100
Benchmark: 10–20% for B2B. Track by lead source to identify your highest-converting channels.
20. Average sales cycle length
The average number of days from opportunity creation to close (won or lost). Sales cycle length directly affects pipeline velocity, forecasting accuracy, and cash flow planning.
Formula: Average of (Close Date − Created Date) for all closed opportunities
Benchmark: B2B SaaS SMB: 14–30 days. Mid-Market: 30–90 days. Enterprise: 90–180+ days.
21. Rep ramp time
The number of months it takes a new sales rep to reach full quota attainment. This KPI matters for headcount planning—if ramp time is six months, hiring in Q3 doesn’t help Q3 pipeline.
Formula: Average number of months from rep start date to first month at 100% quota attainment
Benchmark: B2B SaaS: 3–6 months for SMB/Mid-Market reps. 6–12 months for Enterprise AEs. Reducing ramp time by even one month has a material revenue impact.
Revenue KPIs
Revenue KPIs measure the financial outcomes of your sales motion—what you closed, how efficiently you closed it, and whether the revenue is growing or leaking. These are the KPIs your board and investors care about most.
22. Average contract value (ACV)
The average annualized revenue per closed-won deal. ACV is the baseline for LTV calculations, payback period analysis, and determining whether your sales motion is economically viable at your current CAC.
Formula: Total Annual Contract Value of Closed-Won Deals ÷ Number of Closed-Won Deals
Benchmark: Depends on segment. B2B SaaS mid-market: $25,000–$75,000. Enterprise: $100,000+. Track ACV trends—declining ACV with stable win rates can signal market positioning issues.
23. Quota attainment
The percentage of quota a rep, team, or org achieves in a given period. This is the scoreboard KPI—everything else leads to it.
Formula: Actual Revenue Closed ÷ Quota Target × 100
Benchmark: Healthy orgs: 60–70% of reps hitting quota. If fewer than 50% of reps are at quota, check whether the problem is pipeline, skills, or quota setting.
24. Revenue per rep
The total revenue generated per sales rep in a given period. This measures sales team productivity and helps you assess whether adding headcount will generate proportional revenue growth.
Formula: Total Closed-Won Revenue ÷ Number of Quota-Carrying Reps
[banner type="download" url="https://www.weflow.ai/resources/cheat-sheets/free-cro-onboarding-cheat-sheet" text="CRO Onboarding Cheat Sheet" subtitle="Walk into your first board meeting with a forecast you can defend" button="Get the cheat sheet"]
Benchmark: B2B SaaS: $500,000–$1,000,000 per AE per year for mid-market. Enterprise: $1,000,000–$2,500,000+.
25. Customer acquisition cost (CAC)
The total cost to acquire one new customer, including marketing spend, sales comp, tools, and overhead. CAC combined with LTV tells you whether your go-to-market motion is sustainable.
Formula: (Total Sales + Marketing Costs) ÷ Number of New Customers Acquired
Benchmark: B2B SaaS target: CAC payback period under 18 months. LTV:CAC ratio of 3:1 or higher.
26. Customer lifetime value (CLV)
The total revenue you expect from a customer over the full duration of their relationship with you. CLV sets the ceiling for what you can afford to spend on acquisition and determines the long-term economics of your business.
Formula: Average Revenue per Account per Year × Average Customer Lifespan (in years)
Benchmark: LTV:CAC ratio of 3:1 or higher indicates a healthy sales motion that grows with the business.
27. Churn rate
The percentage of customers who cancel or don’t renew in a given period. Churn is the silent killer of SaaS economics—high churn forces you to run faster just to stay in place.
Formula: Customers Lost in Period ÷ Total Customers at Start of Period × 100
Benchmark: B2B SaaS annual churn: 5–10% for mid-market, under 5% for enterprise. Monthly churn above 2% is a red flag.
28. Upsell and cross-sell revenue
Revenue generated from expanding existing customer relationships—upgrades, additional seats, new products. Expansion revenue is typically more capital-efficient than new logo acquisition.
Formula: Total Revenue from Expansion Opportunities Closed in Period
Benchmark: Best-in-class SaaS companies generate 30–40% of new ARR from expansion. If expansion is under 20%, you’re over-relying on new logos for growth.
29. Forecast accuracy
How close your forecasted revenue is to the actual revenue closed. This is the KPI that separates disciplined sales orgs from ones that are guessing. Accurate forecasts enable better hiring, spending, and board communication.
Formula: 1 − (|Forecasted Revenue − Actual Revenue| ÷ Actual Revenue) × 100
Benchmark: Within 10% is strong. Within 5% is excellent. If you’re consistently off by 20%+, the problem is usually data quality—stale stages, missing close dates, deals that should have been disqualified sitting in pipeline.
30. Sales expense ratio
Total sales costs (comp, tools, travel, overhead) as a percentage of revenue. This tells you how efficiently your sales org is converting spend into revenue.
Formula: Total Sales Expenses ÷ Total Revenue × 100
Benchmark: B2B SaaS: 20–35% of revenue is typical. Above 40% usually signals that either ACV is too low, sales cycles are too long, or the team is over-staffed relative to pipeline.
31. Net revenue retention (NRR)
The percentage of revenue retained from existing customers after accounting for churn, downgrades, and expansion. NRR above 100% means your existing customer base is growing even without new logos—the gold standard for SaaS.
Formula: (Starting Revenue + Expansion − Contraction − Churn) ÷ Starting Revenue × 100
Benchmark: Best-in-class B2B SaaS: 110–130% NRR. Above 100% means expansion outpaces churn. Below 90% indicates a retention problem that needs immediate attention.
32. Win rate by rep
Opportunity win rate broken down by individual rep. This takes the org-level win rate KPI and makes it practical at the coaching level—identifying which reps are converting efficiently and which need support.
Formula: Rep’s Closed-Won Opportunities ÷ Rep’s (Closed-Won + Closed-Lost Opportunities) × 100
Benchmark: Compare against your org average. Reps consistently below the team median may need coaching on qualification, discovery, or deal execution. Reps above may have best practices worth scaling.
How to calculate each Salesforce KPI
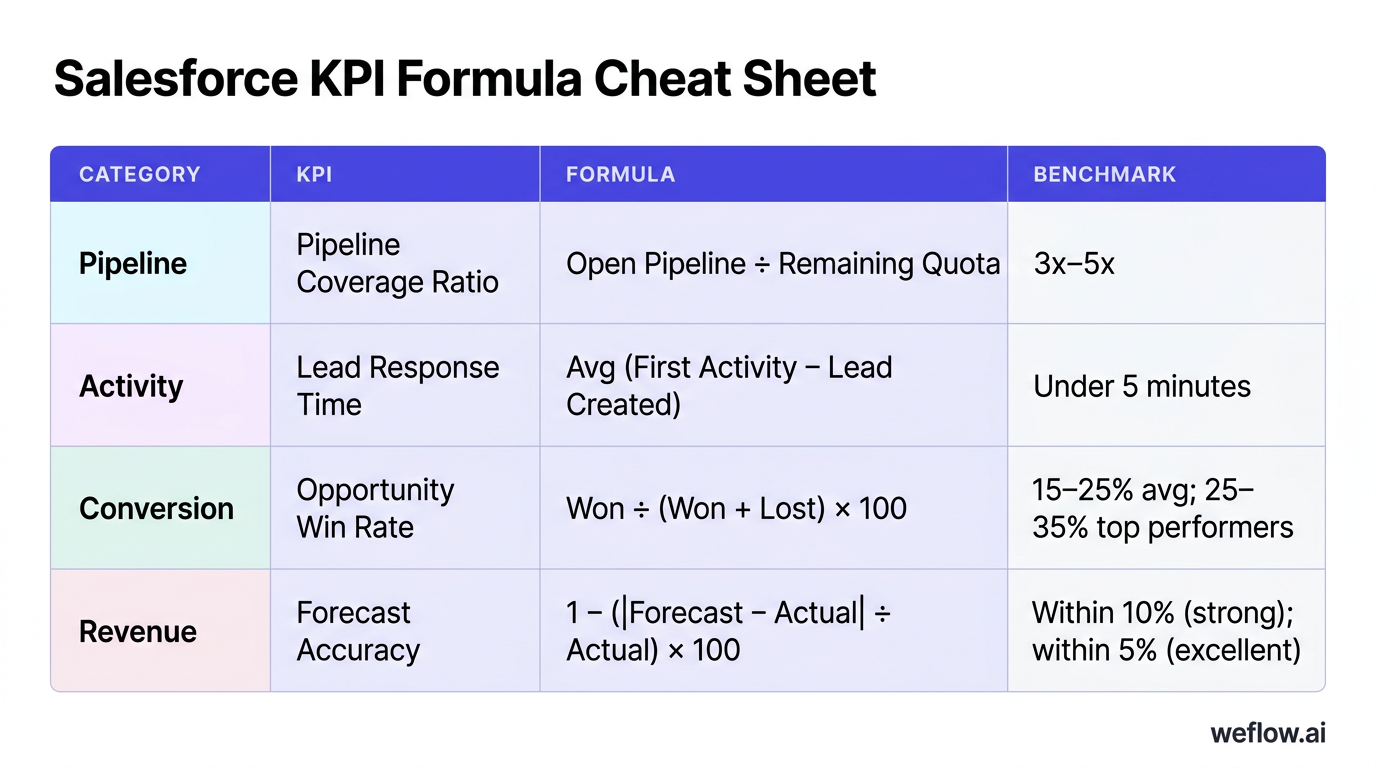
Use this reference table when building Salesforce reports, dashboards, or tracking spreadsheets. Every formula maps directly to standard Salesforce fields or easily created custom fields.
| KPI | Formula | Benchmark |
|---|---|---|
| Open Pipeline Value | Sum of Amount on open Opportunities | Depends on quota (use coverage ratio) |
| Pipeline Coverage Ratio | Open Pipeline ÷ Remaining Quota | 3x–5x |
| Pipeline Velocity | (Opps × Avg Deal Size × Win Rate) ÷ Avg Cycle Length | Track trend month-over-month |
| Pipeline Forecast | Sum of (Amount × Stage Probability) | Within 5–10% of actual |
| Average Deal Size by Segment | Closed-Won Revenue ÷ Closed-Won Deals (per segment) | $15K–$75K mid-market; $100K+ enterprise |
| Deal Slippage Rate | Pushed Deals ÷ Total Forecasted Deals × 100 | Under 20% |
| Time in Stage | Avg (Exit Date − Entry Date) per stage | Internal benchmark from closed-won deals |
| Lead Response Time | Avg (First Activity − Lead Created) | Under 5 minutes |
| Follow-Up Contact Rate | Leads with 2+ Activities ÷ Total Assigned Leads × 100 | 80%+ |
| Sales Activity Volume | Count of Tasks + Events per rep per period | SDRs: 50–80/day; AEs: 20–40/day |
| Outbound Call Volume | Count of outbound call Tasks per rep per day | SDRs: 40–60/day |
| Outbound Contact Rate | Connected Calls ÷ Total Outbound Calls × 100 | 5–15% |
| Demos Scheduled | Count of demo/discovery Events per rep per period | SDRs: 10–20/month |
| Email Open and Reply Rate | Opens ÷ Sent × 100; Replies ÷ Sent × 100 | 30–50% open; 5–15% reply |
| Meeting-to-Opportunity Rate | Opps Created ÷ Completed Meetings × 100 | 30–50% inbound; 15–25% outbound |
| Total Inbound Leads | Count of inbound Lead records per period | Track trend, not absolute number |
| Lead-to-Opportunity Ratio | Opps from Leads ÷ Total Leads × 100 | 10–15% blended; 20–30% inbound |
| Opportunity Win Rate | Won ÷ (Won + Lost) × 100 | 15–25% avg; 25–35% top performers |
| Lead Conversion Rate | Converted Leads ÷ Total Leads × 100 | 10–20% |
| Average Sales Cycle Length | Avg (Close Date − Created Date) | SMB: 14–30 days; Mid: 30–90; Enterprise: 90–180+ |
| Rep Ramp Time | Avg months from start to full quota | 3–6 months mid-market; 6–12 enterprise |
| Average Contract Value | Total ACV ÷ Closed-Won Deals | $25K–$75K mid-market; $100K+ enterprise |
| Quota Attainment | Actual Revenue ÷ Quota × 100 | 60–70% of reps at quota |
| Revenue per Rep | Total Revenue ÷ Quota-Carrying Reps | $500K–$1M mid-market; $1M–$2.5M enterprise |
| Customer Acquisition Cost | (Sales + Marketing Costs) ÷ New Customers | Payback under 18 months; LTV:CAC 3:1+ |
| Customer Lifetime Value | Avg Revenue/Year × Avg Customer Lifespan | LTV:CAC ratio 3:1+ |
| Churn Rate | Lost Customers ÷ Start-of-Period Customers × 100 | 5–10% annual mid-market; under 5% enterprise |
| Upsell and Cross-Sell Revenue | Revenue from expansion Opps in period | 30–40% of new ARR from expansion |
| Forecast Accuracy | 1 − (|Forecast − Actual| ÷ Actual) × 100 | Within 10% (strong); within 5% (excellent) |
| Sales Expense Ratio | Total Sales Expenses ÷ Revenue × 100 | 20–35% |
| Net Revenue Retention | (Start + Expansion − Contraction − Churn) ÷ Start × 100 | 110–130% best-in-class |
| Win Rate by Rep | Rep Won ÷ Rep (Won + Lost) × 100 | Compare against org average |
How to build a Salesforce KPI dashboard
Salesforce gives you two options for KPI dashboards: Lightning Dashboards (built into every Salesforce org) and CRM Analytics (formerly Tableau CRM, available on Enterprise+ editions). For most sales orgs, Lightning Dashboards cover 80% of what you need. CRM Analytics is worth the investment when you need cross-object trending, predictive models, or dashboards that pull from sources outside Salesforce.
Build three dashboards, each designed for a different audience and cadence:
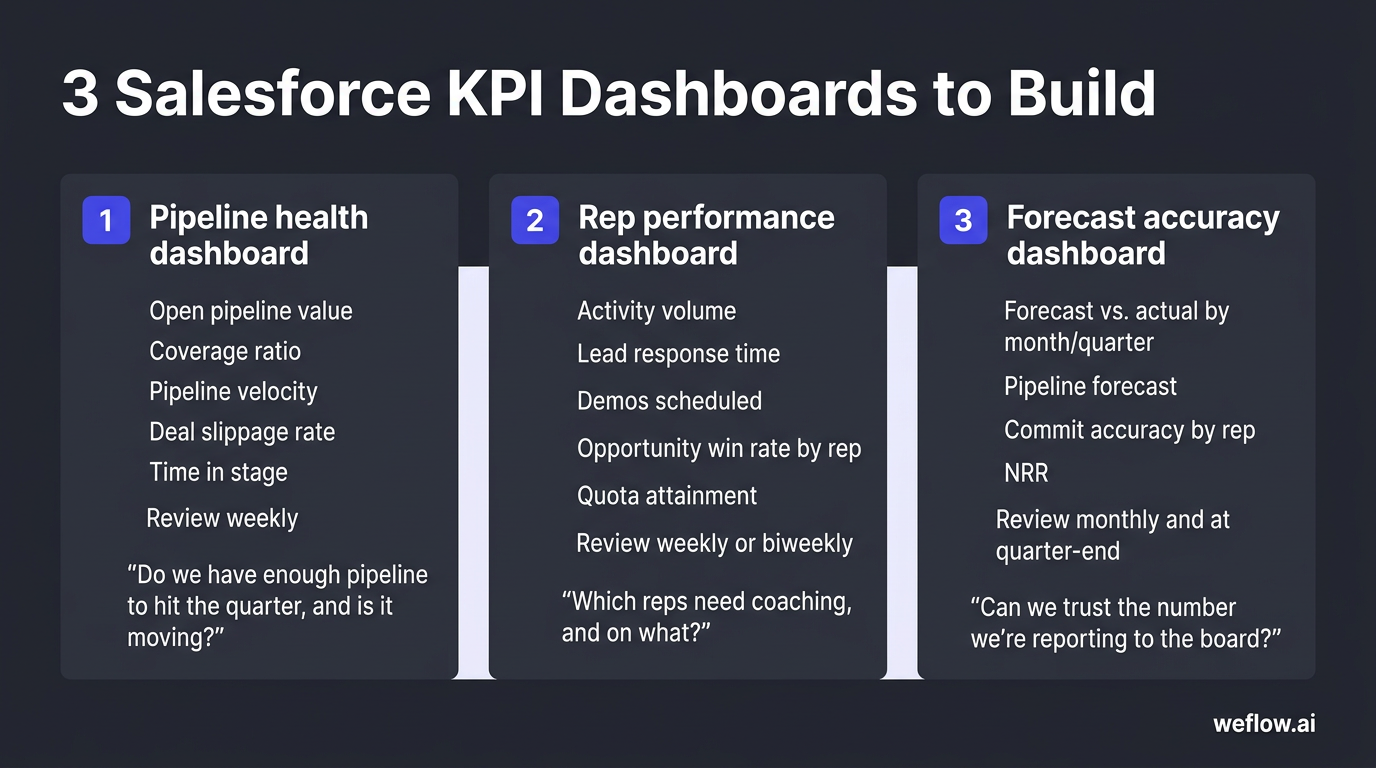
- Pipeline health dashboard — For sales managers and RevOps. Shows open pipeline value, coverage ratio, pipeline velocity, deal slippage rate, and time in stage. Review weekly. This dashboard answers the question: “Do we have enough pipeline to hit the quarter, and is it moving?”
- Rep performance dashboard — For frontline managers and sales ops. Shows activity volume, lead response time, demos scheduled, opportunity win rate by rep, and quota attainment. Review weekly or biweekly. This dashboard answers: “Which reps need coaching, and on what?”
- Forecast accuracy dashboard — For CROs and VP Sales. Shows forecast vs. actual by month/quarter, pipeline forecast, commit accuracy by rep, and NRR. Review monthly and at quarter-end. This dashboard answers: “Can we trust the number we’re reporting to the board?”
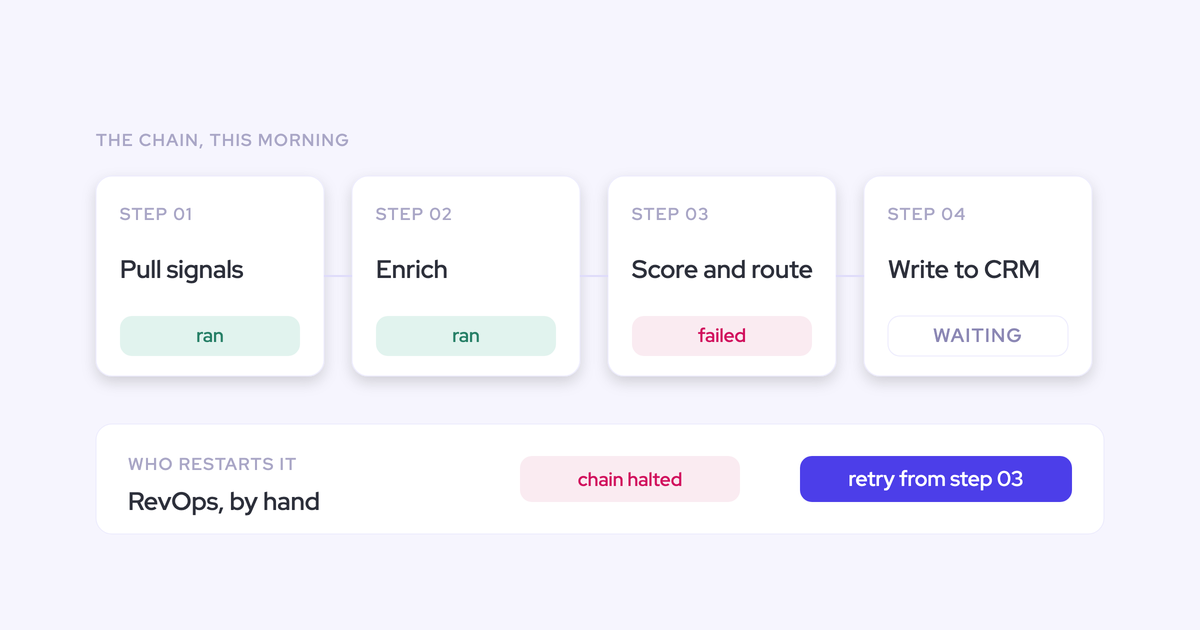
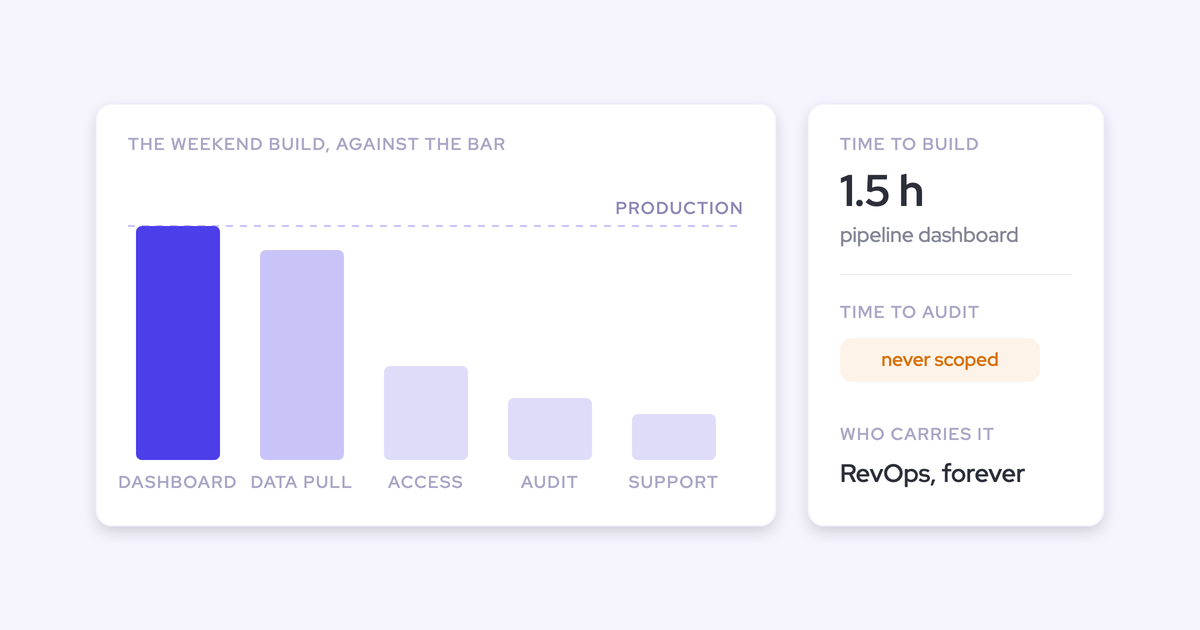
The hardest part of building these dashboards isn’t the Salesforce configuration—it’s data quality. If activities aren’t logged, stages aren’t updated, and close dates don’t reflect reality, your dashboards will display clean charts built on unreliable data. Automating Salesforce data capture—so that emails, meetings, and calls flow into the right records without rep effort—is the foundation that makes KPI dashboards trustworthy.
Frequently asked questions
What are the most important KPIs to track in Salesforce?
Start with pipeline coverage ratio, opportunity win rate, quota attainment, and forecast accuracy. These four KPIs give leadership a clear view of whether the team has enough pipeline, is converting it efficiently, hitting targets, and producing reliable forecasts. Add lead response time and sales activity volume if you manage SDR or prospecting teams.
How do you measure KPIs in Salesforce?
Use Salesforce Reports and Dashboards. Create custom report types that combine Opportunities, Tasks, Events, and Leads. Build dashboard components (charts, gauges, tables) that visualize the formulas above. For more advanced analytics—like pipeline velocity trends or cohort analysis—use CRM Analytics or export data to a BI tool.
What is a good lead conversion rate in Salesforce?
A good lead conversion rate (Lead to Opportunity) in B2B SaaS is 10–15% for blended inbound/outbound and 20–30% for pure inbound with strong qualification. If your rate is below 10%, investigate lead source quality, rep follow-up speed, and whether marketing and sales are aligned on what counts as a qualified lead.
How do you calculate pipeline velocity in Salesforce?
Pipeline velocity = (Number of Opportunities x Average Deal Size x Win Rate) / Average Sales Cycle Length in days. Pull each input from Salesforce reports: opportunity count and average amount from an Opportunities report, win rate from a closed-opportunity report, and cycle length from the average of Close Date minus Created Date on closed deals.
What is the difference between Salesforce KPIs and sales metrics?
KPIs are metrics tied to a specific business objective—they tell you whether you’re on track. Metrics are raw measurements (calls made, emails sent, deals created). Pipeline coverage ratio is a KPI because it measures progress toward hitting quota. Total calls logged is a metric. Every KPI is built from metrics, but only the metrics that directly indicate performance against a goal qualify as KPIs.
How often should you review Salesforce KPIs?
Activity KPIs (calls, emails, demos) should be reviewed weekly. Pipeline KPIs (coverage, velocity, slippage) should be reviewed weekly during the quarter and daily in the final two weeks. Revenue KPIs (quota attainment, NRR, forecast accuracy) should be reviewed monthly and at quarter-end. Build a cadence that matches your sales cycle length—shorter cycles need more frequent reviews.
What Salesforce dashboard should sales leaders use for KPI tracking?
Build three dashboards: a pipeline health dashboard (coverage ratio, velocity, deal slippage, time in stage), a rep performance dashboard (activity volume, win rate by rep, quota attainment), and a forecast accuracy dashboard (forecast vs. actual, commit accuracy, NRR). Each dashboard serves a different review cadence and audience—don’t try to put all 32 KPIs on one screen.
How do you improve low win rates in Salesforce?
Diagnose first—look at win rate by lead source, by rep, and by deal size to find where the problem is concentrated. Common fixes: tighten qualification criteria so fewer bad deals enter pipeline, reduce time-in-stage at the discovery and proposal stages, improve competitive positioning by analyzing closed-lost reasons, and coach reps whose win rates fall below the team median. Track the changes over two to three quarters to see if they’re working.
How to start tracking Salesforce KPIs today
Pick five to eight KPIs from this list that match your team’s current priorities—pipeline health if you’re worried about coverage, activity metrics if you’re ramping new reps, revenue KPIs if you’re preparing for board reporting. Build the dashboards in Salesforce, set a weekly review cadence, and hold reps and managers accountable to the numbers.
The biggest blocker to reliable KPIs isn’t dashboard design—it’s data completeness. If activities, deal updates, and contacts aren’t flowing into Salesforce automatically, your KPIs will always be an approximation. Weflow automates Salesforce data capture for emails, meetings, and calls, so the data behind your KPIs is complete without reps lifting a finger. Start with the data, then build the dashboards.

.webp)