

B2B Revenue Planning: How to Build Territories, Quotas, and Comp Plans
Most revenue plans fail for a simple reason: the target gets set first, and the math gets forced to fit later. That’s how you end up with overloaded territories, inflated quotas, avoidable comp disputes, and forecast calls nobody trusts.
This guide gives you a step-by-step framework to build a B2B revenue plan from the bottom up. You’ll start with clean planning inputs, model capacity by month, balance territories by account potential, set quotas that the core team can actually hit, and design comp plans that pay for the outcomes the business wants.
[banner type="download" url="https://www.weflow.ai/content/revenue-planning-fast-track-cheat-sheet" text="Revenue Planning Fast-Track Cheat Sheet" subtitle="Quota-sizing framework, territory-balance checklist, and comp-plan scoring model for B2B teams." button="Download now"]
Revenue planning inputs: build a predictable growth model
Start with the data that determines selling capacity, not with the board number alone. If your inputs are wrong, every downstream output—territories, quotas, pipeline targets, and compensation cost—will be wrong too.
The goals are straightforward: hit the target, keep pay fair, drive the right selling behavior, and improve forecast accuracy. To do that, RevOps needs one locked planning model with clear ownership across the CRO, CFO, Finance, Marketing, Customer Success, and Business Systems.
Required data inputSource systemActive sellers by role, segment, and regionHRIS, ATS, Salesforce user tableStart dates, manager assignments, and ramp statusHRIS, ATS, Salesforce user data, enablement trackerHistorical ARR per AE, win rate, and median sales cycle by segmentSalesforce opportunity history, CPQ, finance bookings dataCurrent pipeline coverage and monthly pipeline creation paceSalesforce pipeline reports, SDR reporting, marketing automationICP tier, geography, vertical, employee count, revenue band, and parent-child account structureSalesforce accounts, enrichment vendors, data warehouseRenewal base, expansion pool, and retention data for AM/CSM planningSalesforce, billing system, finance data, customer success platform
Use medians, not averages, for core productivity assumptions. Averages get pulled up by a few outlier deals or one unusually productive rep, while medians reflect what the middle of the team actually does by segment, role, and ACV band.
Freeze the data before planning begins. If account assignments, opportunity stages, field mappings, or headcount assumptions keep changing mid-model, you’ll spend the cycle debating numbers instead of making decisions.
Gather headcount and historical productivity data
Before you model quotas or books, get clear on baseline selling capacity. That means looking at rep availability, ramp timing, pipeline creation, and actual closed-won performance from Salesforce—not management estimates.
Dirty Salesforce data at this stage creates quota problems later. If close dates slip without updates, stage progression is inconsistent, or activity data sits outside standard objects—as often happens with partial Einstein Activity Capture setups—your productivity medians and cycle assumptions will be off, and that error will roll directly into quota math.
Align cross-functional stakeholders and org design
Revenue planning is shared work, but it needs a single model owner. The CRO sets the growth stance and field trade-offs, the CFO sets budget guardrails and risk posture, and RevOps builds the model that reconciles the two.
RevOps callout: RevOps should own the planning model, the assumption log, the scenario analysis, and the final system-ready outputs for Salesforce, CPQ, and compensation administration.
Your GTM design also matters because it determines how hard territory and quota planning will be to operationalize:
GTM archetypeBest fitWhat it changes in planningSegmentedDifferent ACVs and sales motions across SMB, mid-market, and enterpriseRequires separate productivity baselines, quota ranges, and coverage targets by segmentGeo-basedRegional buying patterns or field sales motionsAdds territory balancing complexity and raises the need for strong rules of engagementPod-basedVelocity motions with SDR, AE, and SE teams working togetherPushes you to plan rep capacity, SDR support, and manager ratios togetherProduct-lineMultiple products with different buyers and cycle lengthsOften requires different quota units, different comp logic, and tighter account ownership rules
Choose the archetype early. A segmented model with clean rules is easier to plan than a hybrid org where territory ownership, product ownership, and expansion ownership all overlap.
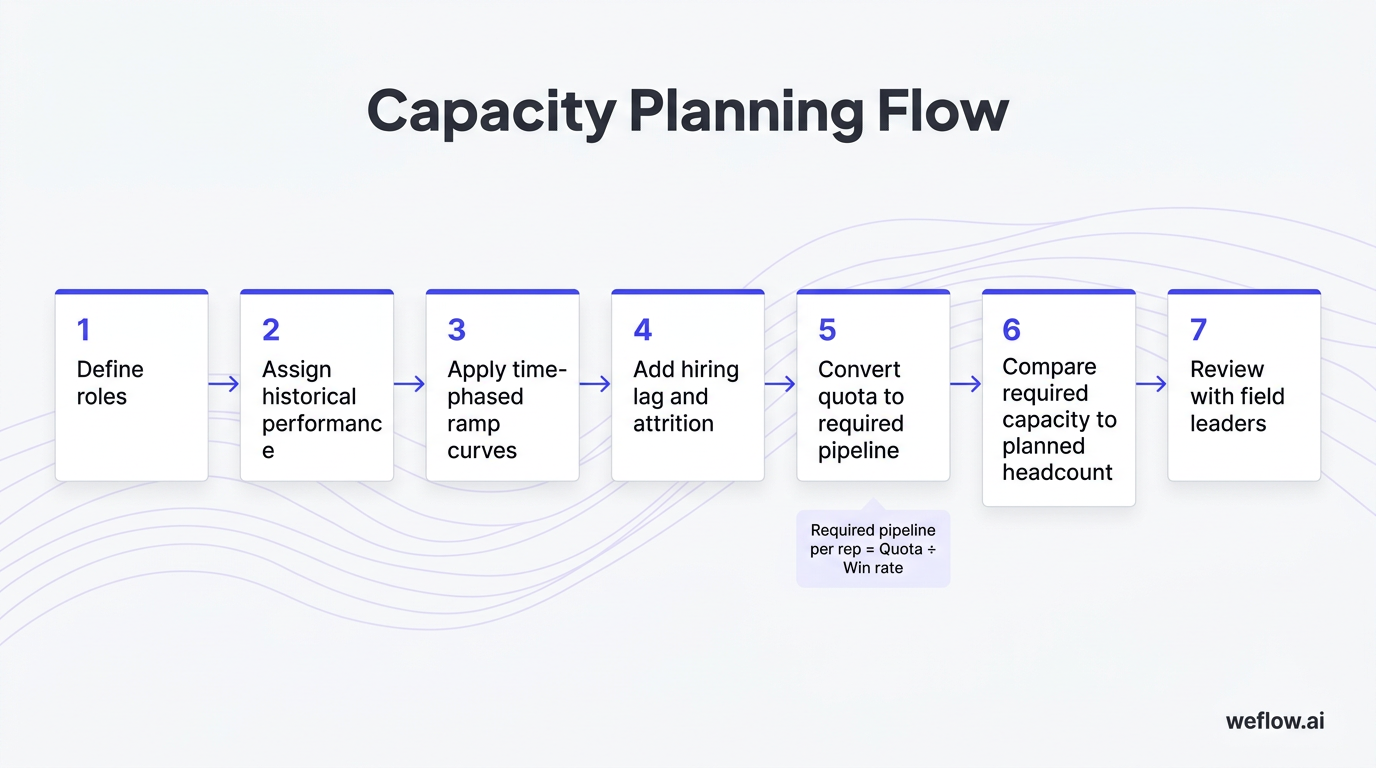
Capacity planning: turn targets into realistic headcount
Capacity planning answers one question: how many productive sellers do you need, by month, to support the number Finance expects? This is where bottom-up math protects the business from top-down only targets that look fine on a board slide but fail in quarter one.
Top-down only targets create rep burnout because they ignore hiring lag, ramp time, territory quality, and pipeline creation reality. Bottom-up capacity math is the only way to show the executive team what extra headcount, pipeline, or budget the number actually requires.
Model time-phased rep ramp and attrition rates
Ramp isn’t a single assumption. It should vary by role, segment, and sometimes region if onboarding quality or deal complexity differs.
If you ignore ramp time, you create forecast risk immediately. The first two quarters look healthy on paper because headcount appears “full,” but the team doesn’t have enough productive capacity to support the commit.
Map pipeline requirements to hiring timelines
Once quota is set, the pipeline requirement follows. That math should drive hiring timing, SDR capacity, and demand generation targets.
Formula: Required pipeline per rep = Quota ÷ Win rate
If a rep carries a $1,000,000 annual quota and wins 25% of qualified opportunities, that rep needs $4,000,000 in qualified pipeline over the period. If your median cycle length is six months, you also need that pipeline in market early enough for it to close inside the fiscal year.
Aggregate the requirement by segment and month, then compare it to:
This is where capacity planning connects directly to Marketing and SDR goals. If the model says the enterprise team needs another $12,000,000 of pipeline by Q2 to support quota, that isn’t a sales problem alone—it’s a demand generation target that needs executive sign-off.
Run base, upside, and downside scenario models
One scenario isn’t a plan. RevOps should show the executive team what happens if win rates improve, ramp speeds up, or pipeline creation misses.
Base caseUpside caseDownside caseUses current headcount, current productivity assumptions, current ramp curves, and the hiring plan already approved.Improves key drivers by 10–20%, such as win rate, ramp speed, or pipeline creation pace, and may include incremental budget.Models pipeline shortfalls, slower hiring, weaker conversion, or higher attrition to show likely exposure.Useful for operating cadence and monthly forecast baselines.Useful for deciding where extra headcount, marketing spend, or enablement investment could pay back.Useful for early pull-backs, revised hiring plans, or cost control if the market softens.Primary question: can the team hit the number with the plan as approved?Primary question: what additional revenue is available if a few drivers improve?Primary question: what needs to change if the assumptions break?
These scenarios make trade-offs concrete. Instead of debating optimism, the CRO and CFO can decide whether a higher number needs more sellers, more pipeline investment, or a lower risk posture on comp and hiring.
Territory design: balance account books to maximize win rates
Territory design should give each rep a fair mathematical chance at quota. The fastest way to break trust with the field is to assign books by account count instead of account potential.
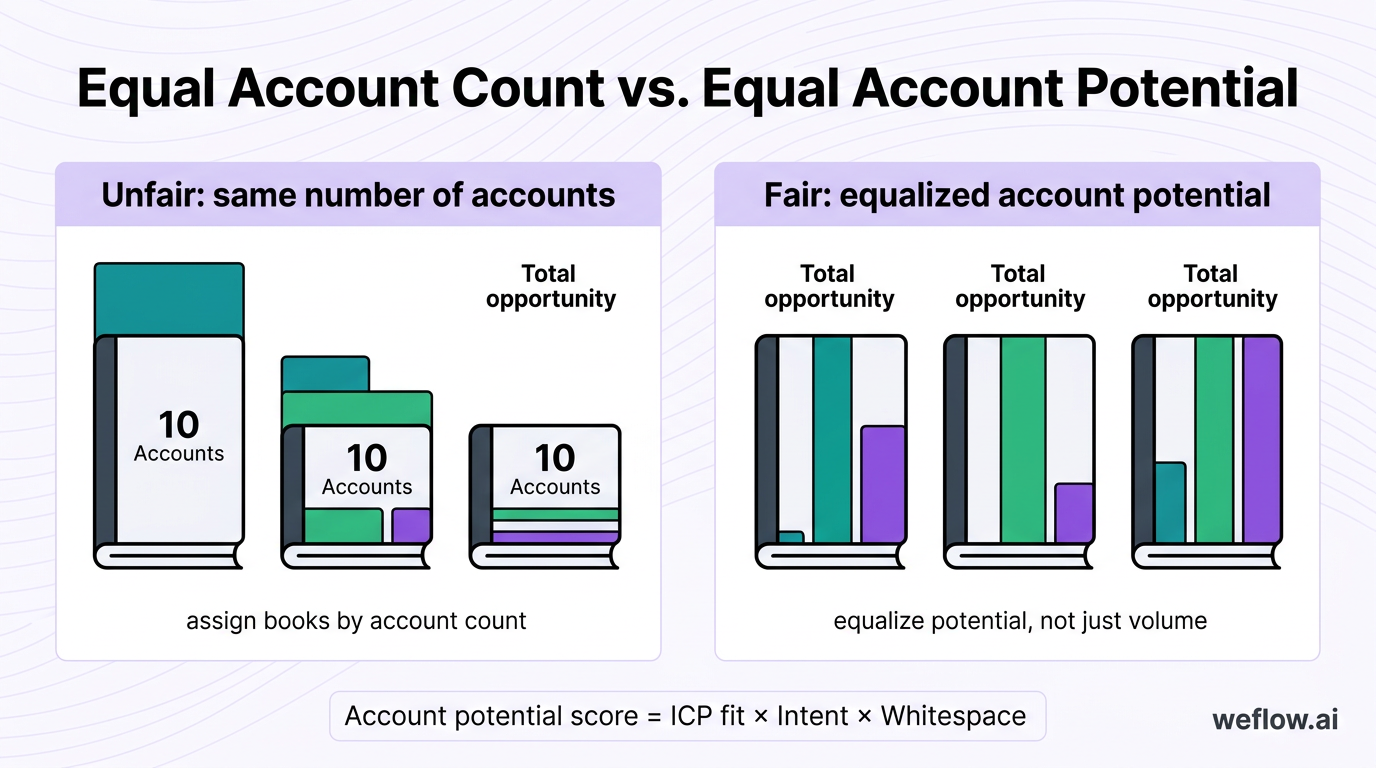
The shift that matters most is simple: stop asking whether each rep has the same number of accounts, and start asking whether each rep has the same amount of realistic opportunity.
Score account potential using ICP and intent data
Territory fairness starts with a standard score on every account in Salesforce. That requires cleaner account data than many teams realize.
Formula: Account potential score = ICP fit × Intent × Whitespace
A simple version works well:
Freeze the fields that drive the score before you map territories—industry, employee band, revenue band, region, parent account, tech stack, current spend, and any custom account score fields. If those values change during the design cycle, books stop being comparable.
Most teams need enrichment help here. Without current firmographic coverage from providers like ZoomInfo or Clearbit, account scores depend too heavily on incomplete Salesforce records, and territory quality varies for reasons that have nothing to do with selling skill.
Map boundaries and equalize total potential scores
Once every account has a score, you can build books around a primary dimension and then rebalance until total potential lands in range.
Strategic accounts often skew territory math. The clean fix is usually to isolate them with clear ownership and quota crediting rules, not to pretend they belong in a standard book and then wonder why one rep’s attainment profile looks nothing like the rest of the segment.
Review coverage models and optimize boundaries
A fair book still has to be sellable. After the first draft of territories, check whether the book can support the rep’s required pipeline and whether the rep can physically work the account set.
Warning: If account fields are missing, duplicate accounts remain unresolved, or territory changes are communicated late, you’ll create coverage gaps, manager escalations, and lost selling time in the first month of the plan.
If a book is overloaded, adding SDR or SE support is often better than redrawing boundaries again. Constant territory changes can hurt more than a targeted support adjustment, especially in mid-market and enterprise motions with longer cycles.
Quota planning: set attainable targets that prevent rep burnout
Quota planning turns your capacity model and territory design into individual targets. The goal isn’t to make quota easy—it’s to make quota supportable.
Quota inflation creates the wrong behaviors. When reps see “stretch” targets that don’t match territory quality or selling capacity, they sandbag late-stage deals, disengage from the plan, or leave.
Anchor quota architecture in modeled capacity
Quota architecture is the set of rules behind the number: what unit the rep carries, when full quota applies, and how much variance you allow across comparable roles.
Bottom-up capacity math and top-down board targets won’t always match. When they don’t, reconcile them explicitly: either raise headcount, increase pipeline investment, change ramp assumptions, or accept a wider forecast risk band. Don’t hide the gap inside quota inflation.
Calibrate distribution for a 70-80% attainment rate
Most healthy sales organizations aim for 70–80% of fully ramped reps to hit goal. That’s a better design target than a blended average across the whole team, which can mask weak attainment under a wave of new hires.
P10/P50/P90 callout: Use an attainment curve to show the expected spread. P10 shows what low-end performance looks like, P50 shows the median rep outcome, and P90 shows strong but still plausible performance. If the median fully ramped rep can’t land near target, your quota design is too aggressive.
Handle mid-year exceptions and territory transfers
Exceptions should follow math, not negotiation. If you don’t publish rules upfront, every transfer and leave request turns into an escalation.
CaseRuleMath exampleLate mid-period hirePro-rate quota by working days active and apply the rep’s ramp percentage for that period.Monthly quota = $100,000; rep starts on day 11 of 20 workdays; ramp month = 40%. Quota = $100,000 × 40% × 10/20 = $20,000.Territory transferSplit quota by working days in each territory and document the effective date in the change log.Monthly quota = $90,000; transfer on day 16 of 20. Old book = $90,000 × 15/20 = $67,500. New book = $90,000 × 5/20 = $22,500.Leave of absencePause quota for full calendar days on leave, then resume the ramp curve where it stopped.Quarterly quota = $120,000; rep is out 30 of 90 days. Adjusted quota = $120,000 × 60/90 = $80,000.
Set a no retro changes policy and publish it in a central one-pager. If the effective date wasn’t approved before the period closed, the plan shouldn’t be rewritten after the fact.
Compensation design: drive profitable behaviors with simple math
Comp plans work when reps can explain them back to you in one minute. If the plan needs a spreadsheet and a manager interpretation to understand, it will create confusion, shadow accounting, and payout disputes.
Complex plans with hidden levers or micro-tiers usually demotivate reps. They make payout harder to predict, invite deal gaming, and create more manual work for Finance and RevOps at quarter end.
Tie core payout measures to specific role outcomes
Each role should be paid on the outcomes it controls most directly. That keeps the plan fair and makes performance coaching easier.
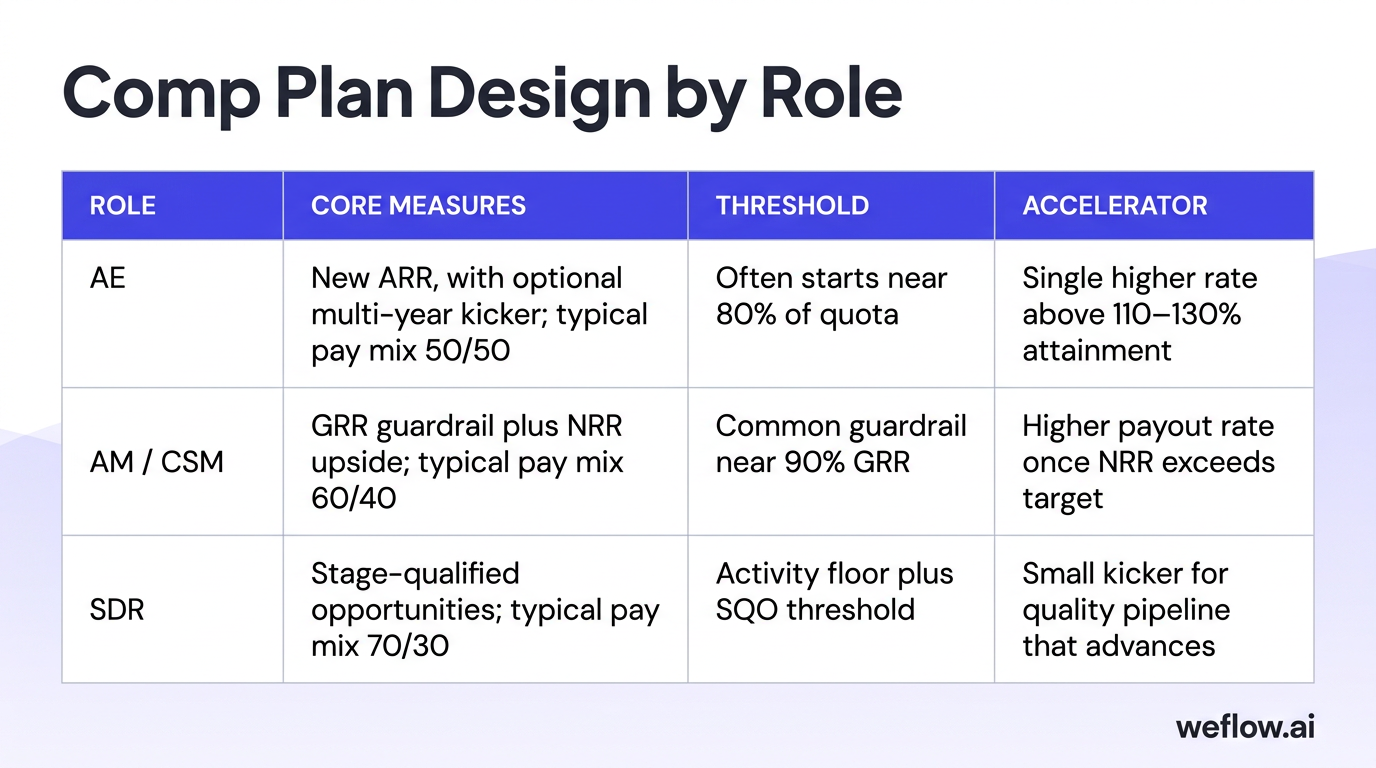
RoleCore measuresThresholdAcceleratorAENew ARR, with optional multi-year kicker; typical pay mix 50/50Often starts near 80% of quotaSingle higher rate above 110–130% attainmentAM / CSMGRR guardrail plus NRR upside; typical pay mix 60/40Common guardrail near 90% GRRHigher payout rate once NRR exceeds targetSDRStage-qualified opportunities; typical pay mix 70/30Activity floor plus SQO thresholdSmall kicker for quality pipeline that advances
Pay on post-discount figures whenever possible. If commission pays on pre-discount ARR while Finance books less, you create margin problems and reward behavior the business doesn’t actually want.
Design predictable payout curves and accelerators
The payout curve should be easy to calculate without side rules buried in policy.
Model total compensation costs across scenarios
Before launch, Finance and RevOps should test the plan at 70%, 100%, and 120% attainment. That shows whether the payout curve stays affordable when performance moves.
This is where RevOps and Finance should work as one team. If RevOps designs payout logic without a cost model, or Finance models cost without field reality, commission overruns show up late and trust breaks fast.
Performance tracking: monitor metrics that signal revenue health
Once the plan is live, the job shifts from design to monitoring. Your dashboards should tell you early whether the model is holding or whether headcount, territory quality, pipeline creation, or manager capacity is drifting.
Activity data quality matters here. Weflow, a Salesforce-native revenue AI platform, writes meeting, email, and call activity back to Salesforce so RevOps teams can track activity completeness, response patterns, and selling load with less manual cleanup. That matters because planning dashboards are only as good as the activity sync and Salesforce write-back behind them.
Track quota attainment and rep productivity trends
These are the metrics most likely to come up in quarterly board reviews because they explain whether the engine is scaling or just getting bigger.
Callout: Tracking rep tenure against productivity is one of the fastest ways to spot enablement gaps. If reps with six to nine months of tenure still perform like early-ramp hires, the issue is usually onboarding quality, manager coaching load, territory design, or pipeline support—not just rep talent.
These metrics answer the questions boards usually ask: Is the mature team hitting? Are new hires ramping on time? Are we hiring fast enough to support the plan? Are productivity gains real, or are they coming from a small number of outlier reps?
Compare compensation against industry benchmarks
Benchmarking helps you check whether your plan is competitive enough to hire and retain talent. Use these ranges as a baseline, then adjust for geography, market conditions, deal complexity, and company stage.
Role / segmentBase salaryOTEQuota rangeSMB AE$55,000–$75,000$100,000–$130,000$400,000–$600,000Mid-market AE$70,000–$90,000$150,000–$180,000$700,000–$1,000,000Enterprise AE$90,000–$140,000$200,000–$300,000+$1,200,000–$2,000,000+Sales manager$100,000–$130,000$180,000–$240,000+Team quota: $2,000,000–$5,000,000+VP of Sales, $1M–$5M ARR company$160,000–$180,000$250,000–$300,000Equity: 0.5%–1.0%VP of Sales, $5M–$20M ARR company$180,000–$200,000$300,000–$400,000Equity: 0.3%–0.7%VP of Sales, $20M–$50M ARR company$200,000–$225,000$350,000–$450,000Equity: 0.15%–0.4%VP of Sales, $50M–$100M ARR company$225,000–$250,000+$400,000–$500,000+Equity: 0.05%–0.2%
Benchmark data moves with geography and market conditions, so don’t use it as a hard rule. Use it to pressure-test whether your OTEs, quotas, and pay mixes are close enough to market to support hiring and retention.
FAQ
How often should we update sales territories?
Twice a year is the right default for most B2B teams because it gives you room to rebalance for headcount and performance without resetting the field every quarter. If you change territories more often, publish a change log and keep strategic account exceptions tightly controlled.
What is a healthy pipeline coverage ratio?
Most teams plan around 3–4x pipeline-to-quota coverage, but the right number depends on segment win rate and sales cycle length. Lower win rates, longer cycles, and weaker stage hygiene usually mean you need to be closer to the high end of that range.
How do we handle quotas for reps on leave?
Pause quota for the full calendar days the rep is out, and resume the ramp curve exactly where it stopped when the rep returns. Keep the leave rule separate from any draw or earnings guarantee so quota math and payroll policy don’t get mixed together.
What is the ideal manager-to-rep ratio?
A 1:6 ratio is a strong operating benchmark because it gives managers enough time for deal inspection, coaching, and onboarding support. Once teams push much beyond that, ramp slows, forecast inspection gets thinner, and rep churn risk usually goes up.
.webp)

.webp)
.webp)
.webp)
.avif)

.webp)
.webp)

.webp)
.webp)