
Your CRO wants another AE. Or wants proof the AEs you have are maxed out before signing off on one. Either way the question lands on you, and you can't answer it: nobody can say how many meetings a week each rep runs, how many emails went out, how many came back, or how any of that compares across the team.
That gap isn't a missing report. It's the capture layer underneath the report. Teams that rely on reps logging through the Salesforce Outlook add-in or Gmail extension get 24 to 52% of their activity into the CRM, and the gap isn't random: the reps selling the most log the least. So the capacity number you'd build today would be wrong in the direction that matters most, which is why headcount still gets argued on feel. Fixing that starts with Salesforce data capture, not with a better dashboard.
This guide builds a capacity model that survives the meeting: the metrics per role, a benchmark derived from your own closed-won history instead of the "eight meetings a week" rule you inherited, the cross-team comparison Salesforce won't give you, and an honest read on what the model still can't see.
What a defensible rep capacity model looks like
A rep capacity model is three activity metrics per rep, read side by side against a benchmark derived from your own history: meetings per week, emails sent, replies received.
That's it. Not a health score, not a composite index. Three counts a CRO can follow and a rep can recognize.
"Defensible" means two things can be interrogated in the room, not one:
- The number. Where the benchmark came from, which cohort of deals it was derived from, and where each rep sits against it.
- The completeness of the data behind it. What percentage of real activity reached Salesforce, measured, not assumed.
Most capacity conversations die on the second one. A VP asks "do we actually capture all the meetings?", the honest answer is "probably not", and the model is finished as an argument.
| Metric | What it tells you about capacity | Where it has to come from in Salesforce |
| Meetings per week, per rep | The hard ceiling. Customer conversations are the scarcest thing a rep produces | Event records owned by the rep, mapped to the opportunity, not just the account |
| Emails sent | Effort and coverage across the book. On its own it says nothing about whether anyone answered | EmailMessage records with direction preserved |
| Replies received | Whether the activity is producing real conversations. This is the metric that separates busy from booked | EmailMessage records, inbound, matched back to the thread |
Why your Salesforce activity data can't answer the capacity question
The capacity question defaults to opinion because all three inputs the model needs are broken by how most orgs capture and store activity. Complete activity, email direction, and comparison across the team: pick your setup and you're usually missing at least two.
Ask a room of RevOps practitioners how they capture activity and the split lands roughly at 35% on a third-party tool, 30% on Einstein Activity Capture, 30% on the Salesforce Outlook or Gmail add-in, and 5% on something else. Two thirds of Salesforce orgs are therefore running on the two methods with the weakest capture and the least reporting flexibility.
You want to make sure that you can actually trust your metrics, trust the visibility, trust your reporting. And this is fundamentally a data capture problem, which has been around for a long time.
— Janis Zech, CEO and Co-founder of Weflow
Manual logging captures only 24–52% of rep activity
Where activity logging depends on a rep clicking "log to Salesforce" in an Outlook add-in or Gmail extension, only 24 to 52% of activities reach the CRM. Up to three quarters of the interaction record is missing.
Look at the mechanics and the number stops being surprising. The rep has to find the record, attribute the email to it, and click log. On a custom object that's four clicks per email. Thirty or forty emails a week, which plenty of people send in a day.
Then there's the bias, which is the part that kills a capacity model. The gap isn't spread evenly:
- The busiest weeks are the worst-logged weeks.
- Your top closers are your worst loggers, because logging is the thing that gets dropped when the week fills up.
- Add-ins force periodic reauthentication, and there's no central view of who has quietly stopped.
Reps, they get in there, they do their data entry when they have time. And if they are selling a lot, they don't have a lot of time.
So a leaderboard built on manual logging ranks reps by admin compliance and calls it capacity. Your highest performer looks underworked. That's not a reporting error you can filter your way out of.
Sales engagement tools log to Task and lose reply rate
Sales engagement platforms write activity to the Salesforce Task object rather than to EmailMessage, which discards the from and to information. Sent and received collapse into one undifferentiated count, so reply rate cannot be calculated at all.
This is the objection I hear most from teams with full Outreach or Salesloft coverage: everything is logged, so what's missing? Direction is missing. And direction is the whole signal.
| Where activity lands | What you can report | What you can't |
| Task object (sales engagement platforms) | Volume: touches per rep, per account, per sequence | Sent vs received, reply rate, response time, whether a real conversation exists |
| EmailMessage object | Sent and received separately, replies counted per rep and per opportunity, response rate inside a time window | Sequence-level attribution, which is what the engagement platform is for |
The Salesforce add-in flow makes it worse in the same direction. It's built for outgoing mail: an incoming reply can only be logged after the fact by opening the thread. So the replies are exactly the part that goes missing, and replies are the strongest evidence a customer conversation is actually happening.
The Salesforce role hierarchy blocks cross-team rep comparison
Salesforce reporting is bound to the role hierarchy, so the comparison a capacity model needs, all enterprise reps globally, or AEs beside AMs and CSMs, isn't buildable natively.
You're stuck with the Salesforce hierarchy. I want to look at all enterprise reps globally and compare them.
Ten enterprise AEs reporting into four regional managers in three hierarchies don't roll into one view. You get four views, four averages, and no basis for saying who is full.
This one is structural, not a skills gap. Every RevOps leader hits it, and the usual workarounds (a flattened custom field, a nightly export into a sheet, a warehouse) are all maintenance you now own forever.
What you need before you build the capacity model
Before you build any report, the data has to pass three tests. If it fails, Steps 1 and 2 are the work, and the model comes after.
- Near-complete capture. You can state, with a number, what share of real meetings and emails reach Salesforce, and it's high enough that the gap doesn't swing the ranking.
- Activity stored as native records, with direction preserved. Emails on EmailMessage, meetings on Event, permanently, so reports and flows can read them. Activity that isn't a real record can't be reported on or automated against, and teams find that out only after they try.
- Per-rep attribution that doesn't depend on the hierarchy. Every activity carries an owner you can group and compare freely by role, segment, and region.
Then the practical basics:
- Admin access to Salesforce reporting, plus someone who can read counts out of your Google Workspace or Microsoft admin console.
- Enough closed-won history to derive a benchmark from. One full sales cycle is thin. Four quarters is comfortable.
- Clarity on which roles you're measuring. AEs alone is a smaller job than AEs, AMs, CSMs and SDRs side by side.
How to build a rep capacity model in six steps
The order matters, because each step is meaningless without the one before it. Denominator first, metrics second, benchmark third, comparison fourth, presentation last. A team with three people can start Step 1 this week.
Step 1: audit how much activity actually reaches Salesforce
Measure your capture rate before you trust a single number built on it. This takes an afternoon, not a project.
- Pick three to five reps across roles, including one of your top closers and one of your busiest calendars. Pick a two-week window that has already closed.
- Get the true denominator. From your Google Workspace or Microsoft admin, count external meetings on those calendars and emails sent and received with external domains in that window.
- Count what Salesforce holds for the same owners over the same window: Events, EmailMessages, Tasks.
- Divide, per rep. Never as a team total, because the team total hides the bias you're looking for.
What a gap looks like in practice: a rep with 14 external meetings on the calendar and six Events in Salesforce. That rep isn't at 43% capacity, they're at 43% capture. Two very different conversations.
If you're on Einstein Activity Capture, Step 3 will return close to nothing, and that is your answer.
What did the team do? What has the team booked for next week? With Einstein Activity Capture, I was trying to report on how many meetings we have. I got on a call with Salesforce support, who was just as confused as I was. I also learned that activities are just temporarily stored on Salesforce's side. It's actually not even my own data.
Step 2: fix capture so activity lands as native records
If the audit fails, the fix is automated capture that writes emails, meetings and contacts into native Salesforce objects with no rep behavior required. Anything that depends on rep clicks rebuilds the problem you just measured.
These are the acceptance criteria to hold a capture layer to, whoever you buy from:
- Capture runs server-side from the mail and calendar system, enrolled centrally by an admin. Nothing for reps to install, connect, or reauthenticate.
- Email lands on EmailMessage with direction intact, meetings on Event. Sent and received stay separable.
- Records are written permanently into native objects, so your reports, your flows, and your own AI can read them.
- Activity maps to the opportunity, not just the account, and a rep can see and correct a wrong mapping.
- Contacts get created automatically from threads and invites, with opportunity contact roles set.
- Exclusion rules exist at the domain and thread level, so personal mail never lands in the CRM.
- Exactly one capture layer owns the write.
That last one is not a detail. Two tools writing to the same org is the fastest way to build a capacity model that's inflated instead of incomplete, which I'll come back to in the pitfalls.
Step 3: define capacity metrics for each customer-facing role
Meetings per week, emails sent and replies received are the spine for everyone. What "full" looks like is not, so define the metric set per role rather than running one team-wide leaderboard.
Activity goals have always been normal for SDRs. Applying the same discipline to AEs, AMs and CSMs is the part most teams have never done.
| Role | Primary capacity read | Secondary read | The trap |
| AE | Customer meetings per week | Replies received against emails sent, per open opportunity | Counting internal meetings as capacity. Filter to external attendees or the number is fiction |
| AM | Coverage: accounts in the book touched inside the window | Meetings per week, reply rate per account | Peak volume looks healthy while a third of the book has had no contact all quarter |
| CSM | Accounts with no activity in the last N days | Meetings per week, reply rate | Reactive load spikes around renewals and escalations, so a single-week snapshot misleads |
| SDR | Replies received | Emails sent, meetings booked and held | Send volume as the headline. It's the one activity metric that's trivially gameable |
Step 4: benchmark from your own closed-won history
Derive the benchmark from the activity profile of your own won deals and your own best-performing periods. The eight-meetings-a-week rule is a heuristic somebody's conference talk turned into a law, and it will not survive a CRO who asks where the number came from.
RevOps has been here before with 3x pipeline coverage. Some businesses hit the annual number on less than 1x, some need 5x, and a borrowed multiple tells a leader nothing about their own motion. Same failure, different metric.
How to derive yours:
- Take closed-won opportunities from the last four quarters, grouped by creation date rather than close date, so you're reading cohorts that were opened to the same standard.
- For each won deal, count the meetings and the email exchanges that happened on it across its life. Split by funnel: new logo, expansion and renewal have genuinely different activity shapes and averaging them together produces a number that fits nobody.
- Convert to a weekly rate per rep. For the periods where reps carried a full book and hit their number, what was the meetings-per-week rate they actually ran?
- Set the benchmark as a band, not a point. Your honest output is a range with the reply rate that came with it, not a single integer.
- Re-derive it once a quarter. It moves when your motion, your segment mix, or your admin load moves.
The last point deserves emphasis, because it's the one your CRO will push on. The ceiling on meetings per week is set largely by non-selling work, so it isn't a constant.
The typical AE spends thirty, thirty five percent on just selling. And the rest is preparing meetings, administrative work, preparing meetings, following up on meetings, feeding the CRM, updating CRM.
— Janis Zech, CEO and Co-founder of Weflow
Which is why a benchmark set two years ago, before automated capture and AI-written CRM fields took hours back off each rep's week, may now be measuring a constraint you've already removed.
Step 5: build the cross-role, cross-region comparison view
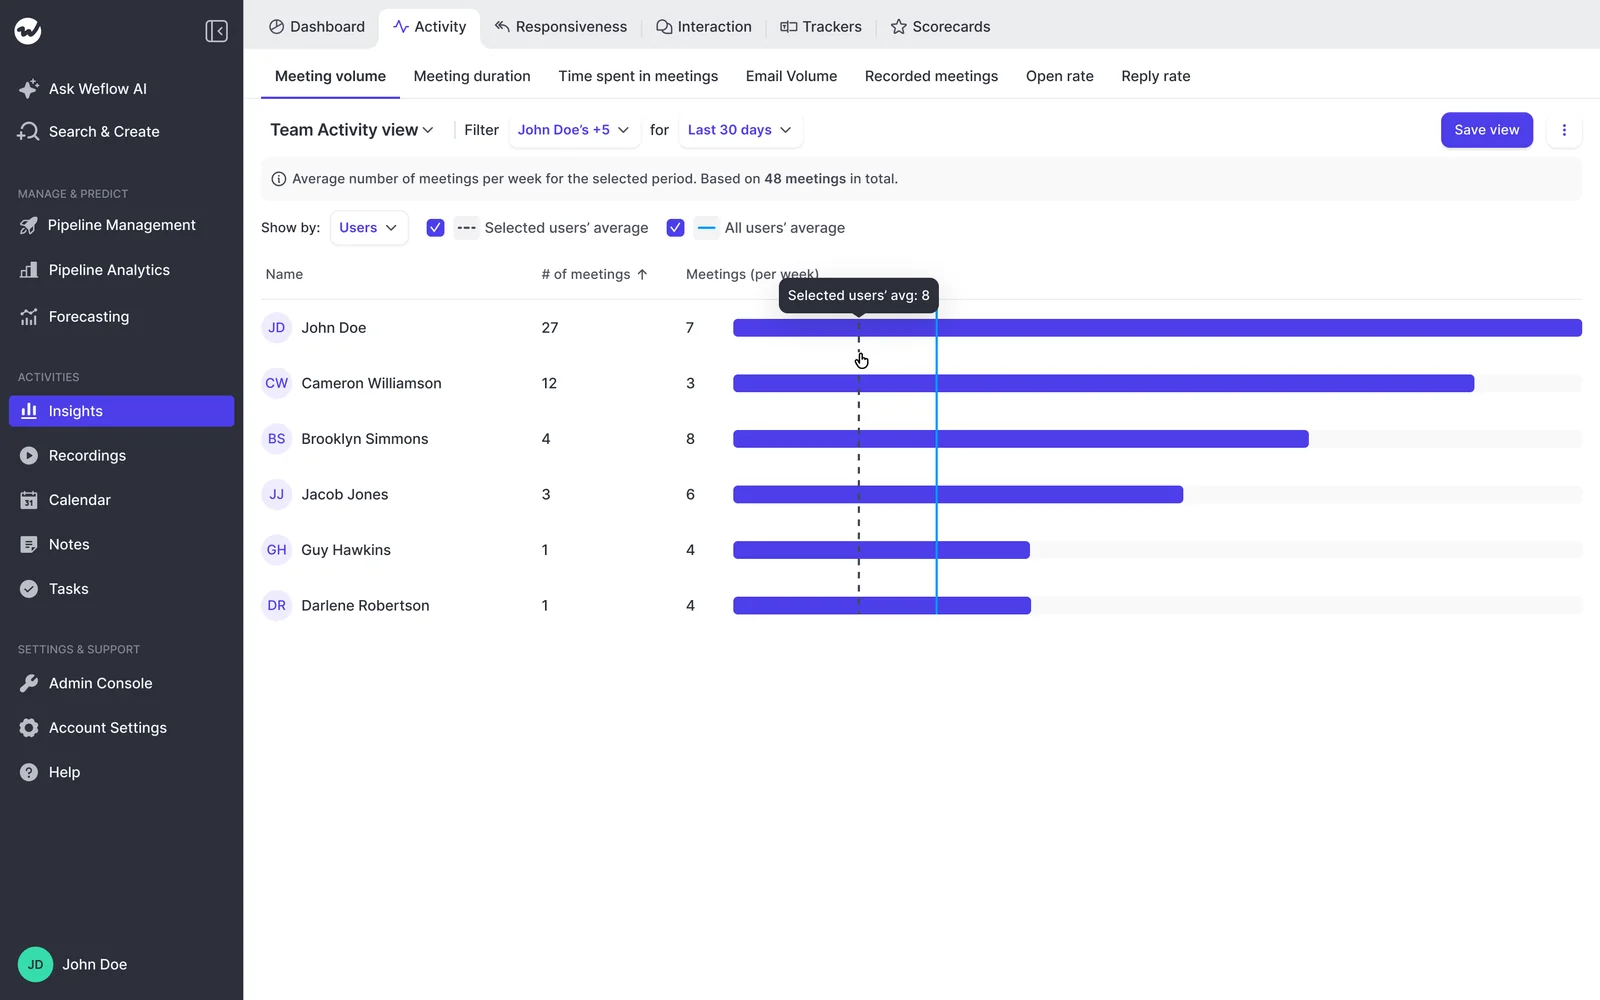
Capacity only becomes readable when reps sit next to each other against the benchmark, which means building the view off the captured activity records rather than inside the role hierarchy.
The columns that carry the argument:
- Rep, role, segment, region.
- Meetings per week, on a rolling four-week average so one quiet week doesn't distort it.
- Emails sent and replies received, with reply rate.
- Days since last activity on the largest open opportunity.
- Open opportunity count, as the denominator for everything else.
Then read the outliers, which is where the value actually is:
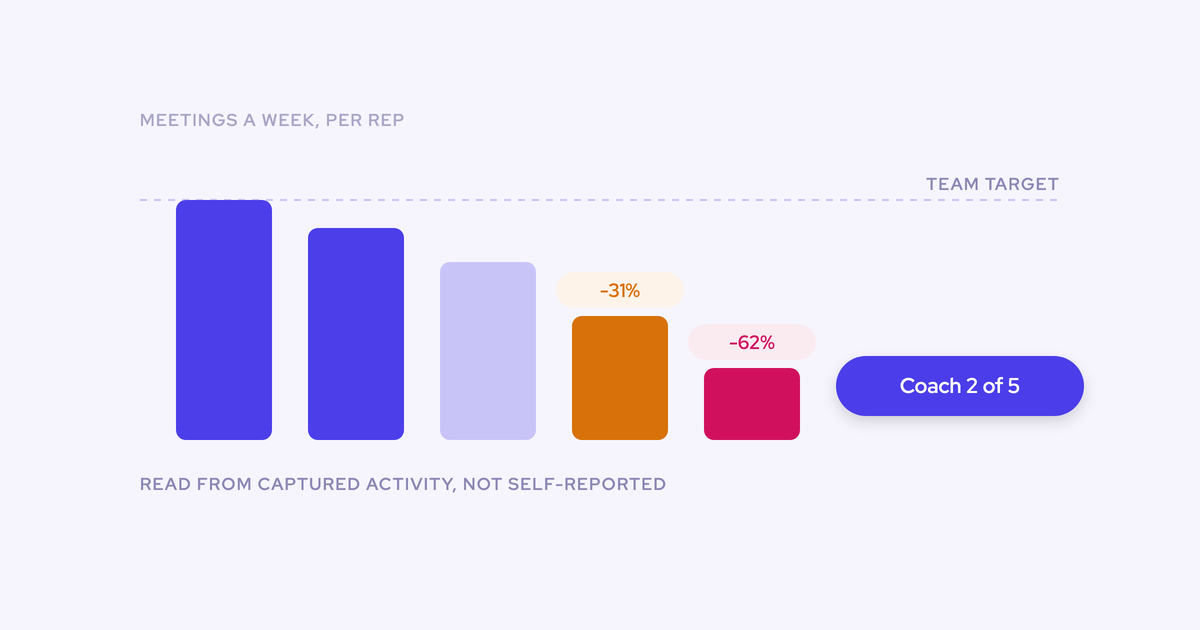
- High meetings, low replies: busy, not connected. A coaching conversation about who they're meeting.
- At benchmark, concentrated in a few accounts: a coverage problem hiding inside a healthy-looking number.
- Below benchmark on everything, full pipeline: not a capacity case. That's a rep who needs help this month, spotted before the number is missed rather than after.
- Above benchmark on everything, attainment flat: quality problem. Go look at the calls.
This is also the view that answers the headcount question directly, because it shows whether the team's aggregate meeting capacity has any room left in it.
Step 6: present a capacity number your CRO can interrogate
Defensibility comes from showing the chain, not the conclusion. Three things on the slide, in this order:
- Capture completeness, with the method. "We captured 96% of external meetings and emails in the audit window, measured against calendar and mail server counts for five reps." This pre-empts the challenge that ends most of these meetings.
- The benchmark and its derivation. Which cohort, which funnel, which periods. Say out loud that it's a band and that you re-derive it quarterly.
- Where each rep sits, and the blind spots. Name what the model can't see, phone calls and messaging, before someone else does.
Then make the ask in capacity terms rather than headcount terms: at this benchmark, this segment needs more meeting capacity than the current team can run, and here is the gap. The conversation moves off "we feel maxed out" and onto arithmetic.
Common pitfalls that turn capacity into a vanity metric
The model fails in three predictable ways, and none of them are technical. Two of them make the number wrong. The third makes the data itself go bad.
Optimizing meeting volume without spot-checking content
Activity volume is a proxy, and proxies get gamed the moment they get managed. Read the aggregate on two dimensions: volume of inbound and outbound exchanges per rep, and periodic checks on what was actually said in them.
That doesn't mean reviewing every call. It means a manager sampling a handful of meetings from the reps at the top and the bottom of the volume ranking each month.
The tell that you skipped this: meetings per week climbs, reply rate flattens, win rate doesn't move. You've optimized a number instead of a motion.
Turning the capacity leaderboard into rep surveillance
How you introduce this decides whether the data stays honest. Reps who read the model as an activity scoreboard start managing the scoreboard, and every count you built the model on gets quietly less true.
The framing that works is that the same data starts both conversations: capacity planning with leadership, and coaching with the rep.
| Say | Don't say |
| "This is how we prove you're at capacity and get you help" | "This is how we track your activity" |
| "Nothing here is manually logged, so nobody is being judged on admin compliance" | "Make sure your activity is logged before Friday" |
| "We derived the benchmark from what our own winning reps ran" | "Industry standard is eight meetings a week" |
One customer put the adoption test better than any pitch deck does.
The goal here is not to add another tool for you to learn, but to make your lives much easier.
Double-counting activity from two capture tools running in parallel
Two capture layers writing to the same Salesforce org duplicate meetings and emails, so the same rep shows a different meeting count in different views and nobody knows which one is real.
The most common cause is specific and fixable: Einstein Activity Capture with event sync left bidirectional, running alongside another capture tool. The event gets written to Salesforce, pushed back out to the calendar, and written again. Setting the Einstein event sync to one direction, from the calendar into Salesforce, stops the loop without switching Einstein off.
Two things to know before you go looking:
- Removing the Einstein permission from users does not stop it.
- Duplicates already written are not cleaned up automatically, so they keep distorting your activity metrics until you deal with them.
The same collision happens on email when a sequencing platform and a capture tool both read the same mail tenant. If you're mid-migration, the two tools have to be told about each other. If you're not, switch the old one off, which is the cleaner end state anyway.
How Weflow makes rep capacity measurable in Salesforce
Weflow is the Revenue AI Orchestration platform for sales, customer success, and RevOps teams. For the capacity model specifically, the part that matters is the layer underneath it: Weflow Activity & Contact Capture supplies the denominator, the direction, and the cross-role comparison as a switch-on capability rather than a build.
That's the honest scope of the claim. Weflow doesn't hand you a capacity number. It makes the one you build trustworthy.
Complete capture of emails, meetings, and contacts into Salesforce
Weflow Activity & Contact Capture auto-syncs emails, meetings and contacts from Outlook or Google into native Salesforce objects, deployed centrally through OAuth with nothing for reps to install.
The evidence for the denominator is the part worth reading, not the description:
- United Fintech saw a 3x increase in captured activities after switching, and validated them manually as real interactions that had previously been slipping through the cracks.
- Lendz Financial now captures virtually 100% of relevant emails in Salesforce, while Weflow respects their custom setup and logging settings.
- United Fintech had capture running in under an hour, rolled out centrally. HolidayCheck installed the managed package and started syncing in less than an hour too.
Historical backfill matters more than it sounds for this job. Weflow can sync back up to 24 months of history as an add-on, and Lendz had several months of email backfilled, which means your Step 4 benchmark can be derived from real history on day one rather than after two quarters of waiting.
Now, we have full transparency into the performance of each sales rep and KAM, allowing us to track activity-related KPIs and make data-driven decisions to improve sales strategies.
— Irina Smirnova, Senior Sales Operations Manager, Blacklane
Capture also stays accurate on the mapping, which is where fully automated tools quietly break. Weflow pairs server-side capture with a browser and Outlook extension where a rep can see and correct which Salesforce record an activity landed on. Once an account carries three open opportunities, that correction is the difference between opportunity-level activity data and noise.
Reply rate and activity metrics without custom fields
Because email lands on the EmailMessage object with direction preserved, sent versus replies received per rep is computable, and the response-rate view exists without anyone building a field.
Out of the box you get:
- Meeting volume per rep, by week, as a table or a trend line, with a team average line to read against.
- Email responsiveness: the share of incoming emails replied to inside 24 hours, per rep.
- Average meeting duration and total time spent in meetings.
- Interaction and talk ratio, and longest monologue, from recorded calls.
- Computed fields Salesforce doesn't have: a rolling four-week activity timeline, days inactive, last and next meeting, per-contact engagement, activity velocity.
Two consequences a RevOps leader should care about. First, none of those computed fields are typed by a rep, so they can't be gamed. Second, the records are native, so the same data feeds your own reports, your flows and your alerts. It isn't sitting in a vendor cloud where your automations can't reach it, and it doesn't arrive as a package of custom fields your successor inherits as tech debt.

Where Weflow doesn't help: phone calls and messaging channels
Weflow does not capture VoIP or phone calls, and it does not capture messaging: SMS, WhatsApp, iMessage, LinkedIn. If a large share of your reps' customer contact happens on those channels, any activity-based capacity read, ours included, has a real hole in it.
The obstacle on messaging is consent and device ownership rather than integration. A personal phone carries a rep's private life, and asking for access to it is a different conversation than connecting a corporate mailbox. Being on a texting basis with a buyer is one of the better signals in enterprise sales, and nobody can measure it today.
What to do about it: name the blind spot on the slide, and never benchmark a phone-heavy rep against a meeting-heavy one. Two motions, two models.
And one more thing worth saying plainly. If you've already audited your capture and it comes back high, you don't have a capture problem. Build the model on what you have. Switching tools to answer this question would be work you don't need to do.
Frequently asked questions about measuring rep capacity
How many meetings per week should an AE have?
The eight-meetings-a-week rule is an inherited heuristic, not a benchmark for your business. Derive your own from the activity profile of your closed-won cohorts per role and per funnel, and treat it as a band rather than a number. It's also moving: the ceiling on customer meetings is set mostly by the non-selling work around each one, so as capture and CRM updates get automated, the same rep can carry more.
Do I need a data warehouse to measure rep capacity?
No, as long as activity is captured into native Salesforce objects with direction preserved. A warehouse only becomes necessary when the data isn't stored where reporting can reach it, which is exactly the situation Einstein Activity Capture creates. The warehouse is a workaround for a capture problem, not a requirement of the model.
Can Einstein Activity Capture feed a rep capacity model?
Not reliably. Activities aren't stored as your own reportable Salesforce records, so you can't report on them or build automations off them, and it doesn't create contacts automatically. It also depends on opportunity contact roles to attribute activity to an opportunity, which most orgs don't maintain, and it only maps cleanly when an account has exactly one opportunity. If you run it alongside another capture tool with event sync left bidirectional, you'll get duplicate meetings on top of all that.
Can I measure capacity if my reps mostly sell by phone?
Partially, and you should say so out loud. Email-and-meeting capture, from any vendor, misses VoIP calls and messaging channels, so a phone-heavy motion gets an incomplete read. Measure what is capturable, state the blind spot in the model, and keep phone-heavy and meeting-heavy reps in separate benchmark groups so you're not comparing two different jobs.
How fast can capacity measurement be set up, and what does it cost?
Weflow Activity & Contact Capture is $19 per user per month, billed annually, with a 10-user minimum. Technical setup runs 30 to 45 minutes with a Salesforce admin and your Google Workspace or Microsoft admin, and both United Fintech and HolidayCheck had capture live in under an hour, rolled out centrally with nothing for reps to do. There's a 14-day free trial with implementation included, so you can run the Step 1 audit against your own Salesforce before committing to anything.
See how Weflow captures activity, updates Salesforce fields from calls, and rolls up your forecast. Book a 30-minute demo.