Pipeline Cohort Analysis by Creation Quarter: What It Shows That Close-Date Reporting Hides
Learn what pipeline cohort analysis by creation quarter reveals that close-date reporting hides.


Close rates jump between quarters. When the CRO asks why, nobody can say whether the business changed or the data did. Your close-date report shows when deals were supposed to land, but it can't show where conversion broke.
Pipeline cohort analysis by creation quarter answers that question. You group opportunities by the quarter they were created and track how much of each group closes as it ages. That tells you whether a quarter's pipeline was created to standard. The method runs in five steps:
- Cohort by creation date.
- Compare cohorts at the same age.
- Read a weak cohort as stuck, slow, or sloppy.
- Cut it by segment, geography, and hiring wave.
- Tighten the opportunity criterion it exposed.
You can build the basic cohort today with a filtered Salesforce report and an export. Comparing cohorts at the same age, or seeing what the pipeline looked like on a past date, needs stored pipeline history. You either build that history or buy it.
Weflow is the Revenue AI Orchestration platform for sales, customer success, and RevOps teams. Weflow Deal Intelligence & Forecasting is one way to get that history, and we'll be specific about what it supplies and what it doesn't.
What is pipeline cohort analysis by creation quarter?
Pipeline cohort analysis by creation quarter groups opportunities by the quarter they were created and tracks how much of each group closes as it ages. It measures the quality of pipeline creation. Close-date reporting measures the timing of closes.
Robert Gimbel ran this analysis as CRO at Camunda. He went back a year, took each quarter's pipeline as its own cohort, and filtered on the date it was created.
"So we would always take quarterly cohorts of pipeline. And we had to travel back a year in time for that, right? But not filtering by close dates in Salesforce terms, but filtering by creation date and see how much of that pipeline did we close."
Why close-date reporting hides where your conversion broke
Close-date reports mix deals created across many quarters. A badly created quarter gets spread thin across future periods and never shows up as one event.
| What you're asking | Close-date view | Creation-cohort view |
|---|---|---|
| The question it answers | How much is set to land in this period | How much of what we created in a quarter turned into revenue |
| What a bad creation quarter looks like | A slightly lower win rate in each of several later quarters, easy to explain away | One row converting well below older rows at the same age |
| What it tells the CRO after a miss | Which deals didn't land when expected | Whether the pipeline behind the miss was created to standard, and in which quarter |
| What it feeds downstream | A blended close rate that goes straight into the forecast and the coverage target | A close rate per creation quarter, so you can see which quarters are dragging the rate down |
That last row is where the damage compounds. Junk opportunities dilute the close rate. The forecast and the coverage target are both derived from that rate, so they now lean optimistic, and nobody sees it until the cohort fails to convert two quarters later.
The root cause is drift in what counts as an opportunity. Whoever opens the deal sets the standard, and pipeline pressure lowers it. Compare two quarters and you're often comparing two different definitions.
"So I think in most sales pipelines, the reality is that that isn't managed very well. And then you look at your close rate or your cohorts, and they're all over the place."
How to run a creation-quarter cohort analysis in five steps
The five steps work as a diagnostic. Each one narrows the question, and you finish with a rule to change, not a chart to present.
Step 1: Group opportunities by the quarter they were created
Filter opportunities on creation date, not close date, and go back about a year. That gives you mature cohorts to compare the young ones against. Each cohort's close rate to date is your starting measure.
- Filter: every opportunity created in the last four to five quarters, whatever its status.
- Group: by the quarter each opportunity was created.
- Calculate: closed-won count and value divided by everything created in that quarter, as of today.
Created Date isn't always the right anchor. A CRM migration or junk stage 0 and 1 records will mislead you, and the section on keeping cohorts comparable covers what to use instead.
Step 2: Compare every cohort's close rate at the same age
Only compare cohorts at the same age. Younger cohorts always show lower close rates because most of their deals are still inside the sales cycle. Set fixed checkpoints, such as day 45, 90, and 180 after each quarter opened, and read each cohort at those points.
| Cohort | Day 45 | Day 90 | Day 180 |
|---|---|---|---|
| Created 4 quarters ago | Rate at day 45 | Rate at day 90 | Rate at day 180 |
| Created 3 quarters ago | Rate at day 45 | Rate at day 90 | Rate at day 180 |
| Created 2 quarters ago | Rate at day 45 | Rate at day 90 | Rate at day 180 |
| Created last quarter | Rate at day 45 | Rate at day 90 | Not reached yet |
| Created this quarter | Rate at day 45 | Not reached yet | Not reached yet |
Read down a column, never across a row. If this quarter's day-45 rate sits in line with the day-45 rates above it, you don't have a crisis. You have a young cohort.
This is the step where history starts to matter. A current-state report shows every cohort as it stands today. It can't tell you where last year's cohorts stood at day 45.
Step 3: Read a weak cohort as stuck, slow, or sloppy
A cohort converting well below its own norm means one of three things. Deals are stuck in a stage, deals are still maturing on a longer cycle, or the quarter's opportunities were opened below standard. Gimbel framed it as three questions:
"And sometimes we had quarters where we said like, oh, normally we close twenty percent, but this one is ailing at below ten percent. What's wrong there? Are we going to make up? Are some deals stuck? Or did we get sloppy in the way we created pipeline in that quarter?"
Each explanation leaves a different trace in the data.
| Signal | Stuck | Slow | Sloppy |
|---|---|---|---|
| What the cohort shows | Open value parked in mid stages, not many losses yet | Rate climbing toward the norm, just later than older cohorts did | Losses and dead deals clustered right after creation |
| Days in stage | Well above your own benchmark for deals that closed won | In line with the long-cycle segments in the cohort | Short time before loss, or deals that never left the first stage |
| Close-date pushes | The same deals pushed again and again | Few pushes; close dates set far out from the start | Close dates set at creation with little basis, then pushed or abandoned |
| Stage conversion | A sharp drop at one specific stage | Normal stage rates, longer gaps between them | Weak conversion out of the first qualified stage |
| What to do next | Review the named deals; re-plan or close them out | Wait and compare again at the next checkpoint | Go to Step 5 and tighten the criterion for opening |
Most weak cohorts are a mix of all three. What you want to know is which one carries most of the missing value, because that decides where you act.
Step 4: Cut cohorts by segment, geography, and hiring wave
Cut the cohort to find where the weakness sits. Segments, geographies, and hiring waves convert at structurally different rates, and a cut separates a systemic pattern from one team or one rep. The first three rows below are the patterns Gimbel found at Camunda.
| Cut | Pattern you'll see | What it means and the fix |
|---|---|---|
| Geography | Markets with a large developer population but low willingness to pay open plenty of opportunities that never convert | The market, not the reps. Raise the bar for opening an opportunity in that geography. |
| Enterprise above roughly 50,000 employees | Cohorts look weak at the usual checkpoints | Timing, not quality. These deals convert but need about two more quarters, so read them at later checkpoints. |
| Hiring wave | Lower close rates in the cohorts new reps created | Expected, and it recovers as they ramp. Plan the dip into the forecast instead of treating it as a quality problem. |
| Lead source | One source opens many opportunities that rarely convert | The source or its handoff rule. Change what that source is allowed to open as an opportunity. |
| Rep | One rep's cohorts trail teammates' at the same age | An individual qualification habit. Coach on creation criteria, not activity volume. |
Step 5: Tighten the opportunity criterion the cohort exposed
The output of the analysis is a changed rule for opening an opportunity. That makes the next cohorts comparable, and it catches inflation at creation instead of two quarters later. A tightened criterion includes:
- One written definition of a qualified opportunity, the same for every team and region.
- Written entry and exit criteria for every stage.
- A higher bar wherever a cut showed opportunities that never convert, such as a specific geography or source.
- A weekly check of every new opportunity against the definition, by the manager and again by RevOps.
The weekly check matters most for new AEs. A thin pipe gets them a hard conversation with their manager and a fat one doesn't, so they open too much. Here's how it sounded in our RevOps Lab conversation on forecasting:
"Or you're bringing in new people, new AEs to the business, and they wanna create their pipeline, they wanna fill their pipe, and they rather take too much than too little, so you need to guide people in the way that you want the business to run."
Get the criterion to hold and the close rate stops moving around. Pipeline creation volume becomes a real forecast input.
"I could rely on very consistent conversion or close rates for these opportunities. I knew if we opened a hundred opportunities, we would close a certain amount of them."
How to keep cohorts comparable from quarter to quarter
Two setup choices decide whether your cohorts compare like with like: the date you anchor them on, and how big each cohort is.
Should cohorts start at Created Date or a qualified date?
Use Created Date unless one of two things is true. If you migrated CRMs, or if stage 0 and 1 records aren't real pipeline, anchor on a qualified date instead. That's often the date a deal reaches stage 2.
| Your situation | Anchor on | Why |
|---|---|---|
| Opportunities only get opened once a deal is qualified | Created Date | Creation and qualification are the same moment |
| You migrated deals into Salesforce from another CRM | Qualified date | Every migrated record carries the migration date, so one cohort swallows years of deals |
| Stage 0 and 1 records aren't counted as pipeline | Qualified date, often stage 2 | Early-stage records inflate "created" and drag every cohort's rate down |
| Some periods see bursts of early-stage opportunities | Qualified date | Created Date overstates new pipeline in exactly those periods |
Salesforce sets Created Date when the record is inserted, and you can't edit it. If you need a qualified date, it has to be its own field, stamped when a deal crosses the stage you've defined.
Quarterly, monthly, or weekly cohorts: matching size to your cycle
Pick a cohort size from your sales-cycle length and how many opportunities each cohort holds. Gimbel ran quarterly cohorts. Jeff Ignacio frames cohorts as weekly, monthly, or quarterly, depending on the business:
"Your pipeline coverage is kind of like light from a star. By the time you see the light, it had already traveled a great distance. Same thing with your pipeline. Your pipeline was generated cohorts ago, right? Whether it's a weekly cohort, monthly cohort, quarterly cohort."
The trade-off is speed against noise:
- Quarterly cohorts hold more opportunities per row, so rates hold still. You see a creation problem a quarter late.
- Monthly cohorts react faster and suit shorter cycles or higher volume, with more noise per row.
- Weekly cohorts only make sense at high volume. At low volume, one deal swings the rate.
- Whatever size you choose, keep it fixed, or the series stops being comparable.
When creation-quarter cohorts work and when they mislead
Cohorts need two conditions. You need enough opportunities per cohort for a rate to mean something, and a process stable enough that quarters are comparable. If either is missing, fix it before you read any cohort.
| Cohorts will tell you something when… | Fix this first when… |
|---|---|
| Each cohort holds enough opportunities that one deal doesn't swing the rate | A quarter rests on about ten material deals, so deal-by-deal judgement beats any rate |
| Stage definitions held steady across the quarters you compare | Stages were redefined in the period you want to compare |
| One definition of an opportunity is enforced at creation | Whoever opens the deal decides what counts |
| Your history covers several cohorts that have matured past your sales cycle | Your cycle is longer than the history you hold |
| You can name the decision the answer would change | The real question is "are we on track this week," which pacing and waterfall views answer better |
Gimbel's precondition is the one most teams skip:
"I think what is crucial, you need patience to build up a strong data foundation. And you also need simplicity in how you set things up. There's no point setting up, I don't know, twenty stage sales process that you change every other year if you can't manage consistently through it."
Common pipeline cohort mistakes and how to avoid them
Most cohort errors come from comparing unlike things. These are the ones that trip teams up the first time:
- Comparing a young cohort to a mature one. This quarter will always look worse than last year's. Compare at fixed checkpoints only.
- Judging cohorts against a borrowed benchmark. A generic 20% close rate or a 3x coverage rule says nothing about your business. Judge each cohort against your own older cohorts at the same age.
- Anchoring on Created Date after a migration. Every migrated deal lands in one cohort. Use a qualified date, or start the series after the migration.
- Changing stage definitions mid-series. Once a stage changes meaning, cohorts on either side of the change aren't comparable. Mark the break and restart the comparison from it.
- Blaming reps for a geography problem. If a market opens opportunities that never convert, coaching won't fix it. Raise the bar for that market.
- Reading enterprise timing as a quality problem. Very large accounts need more time. Read those cohorts at later checkpoints before calling them weak.
- Finding inflation at cohort maturity. By then the forecast and coverage target already absorbed it. Check new opportunities against the criterion every week instead.
What a Salesforce report answers and where snapshots start
Step 1 is free in Salesforce. Steps 2 to 4 need to know what the pipeline looked like on a past date, and standard Salesforce reporting can't show you that.
What a filtered Salesforce opportunity report and export already answer
A filtered opportunity report answers "how much of each quarter's pipeline has closed so far." You can build it in a few minutes:
- Create an opportunity report that includes open and closed opportunities.
- Filter Created Date (or your qualified date field) to the last four to five quarters.
- Group rows by Created Date, by fiscal quarter.
- Add record count, sum of your amount field, and a won count.
- Compare won to total for each quarter, by count and by value.
- Export to Excel for any cuts the report type can't hold.
If your question is "did the pipeline we created a year ago convert like the pipeline we created six months before it," this report answers it. You don't need a tool.
Why same-age comparisons break without opportunity snapshots
Salesforce overwrites fields rather than recording the pipeline over time. Stage history and any field history tracking you turned on are change logs, not a picture of the pipeline on a date. Calculated and roll-up fields aren't history-tracked at all.
Here's where each step runs out:
| Step | Data it needs | Can a standard report supply it? | What's missing without stored history |
|---|---|---|---|
| 1. Group by creation quarter | Created or qualified date, amount, won or lost status | Yes | Nothing for the close rate to date |
| 2. Compare at the same age | Every past cohort's state at day N | Partly: won deals' close dates approximate the won share, if reps keep close dates honest | The rest of the cohort at day N: open value, stage, and amount as they stood then |
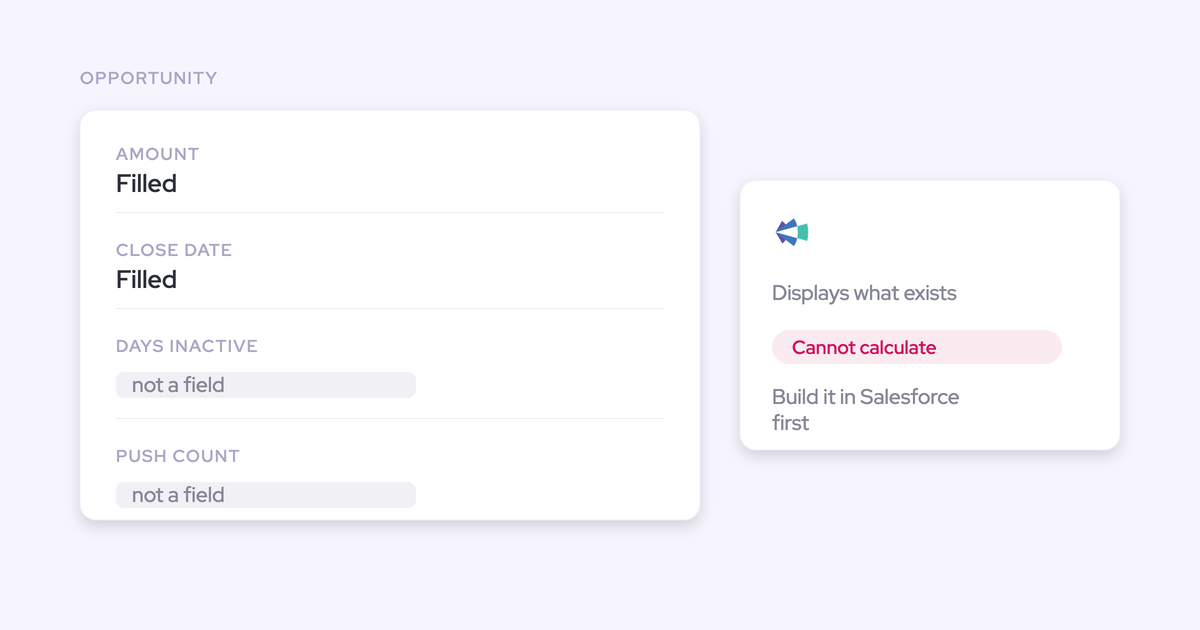
| 3. Stuck, slow, or sloppy | Days in stage, close-date pushes, stage conversion, loss pattern per cohort | Partly: current stage and loss reason | Push counts and time in stage, unless you built custom fields and the automation to fill them |
| 4. Cut by segment, geo, hiring wave | Steps 2 and 3 split by segment, geography, source, rep, and tenure | Splits on current values only | Past values of fields that changed, such as owner or segment after a reassignment |
| 5. Tighten the criterion | New opportunities checked weekly against the rule | Yes, a weekly new-opportunities report | Nothing; this step is process |
The board's quarter-by-quarter trend fails for the same reason. A metric you never stored by quarter can't be trended afterward, and it's too late to start when the board asks.
Warehouse, spreadsheet, or tool: how to build snapshot history
Every path to stored history costs something different, and doing nothing is a legitimate choice if the simple cohort answers your question.
| Path | What you get | What it costs you to run | When it fits |
|---|---|---|---|
| Salesforce report plus export | Creation-quarter close rate to date. No history beyond current state. | Little beyond running the report each cycle | You only need how much of each quarter's pipeline has closed so far |
| Spreadsheet rebuild each cycle | Snapshots you save yourself at each export, stored in files on someone's drive | Your hours every cycle. The answer is a week stale, and a skipped export leaves a permanent gap. | A bridge while you decide, with one named owner |
| Warehouse snapshot build | Snapshots on your schedule, in your warehouse, joinable with any other data | Data engineering to build and maintain, plus BI work for every new view | You already run a warehouse and an analytics team |
| Dedicated pipeline analytics tool | Automatic snapshots plus prebuilt pacing, waterfall, and conversion views. History lives in the vendor's cloud. | A license and a configuration project | You want same-age comparison without owning the plumbing |
| Not bothering | Nothing new | Nothing | The simple cohort answers your question, or cohorts are too small for rates to mean anything |
Snapshotting isn't unique to any one vendor. Clari's Time Series Data Hub snapshots opportunity, account, and activity data, and it tracks historical conversion by stage. Aviso copies your CRM into its own time-series database, on average six to eight quarters back. If you're already running either, you already have the history this method needs.
How Weflow Deal Intelligence & Forecasting supplies the cohort data
Weflow Deal Intelligence & Forecasting gives you the stored history and the history-derived measures that steps 2 to 4 depend on, without a warehouse project or custom field-history builds. It isn't a creation-quarter cohort report, and the limits section below says exactly where it stops.
Where it differs from Clari or Aviso is the platform around it. Weflow is built for Salesforce teams and covers activity capture, conversation intelligence, and forecasting in one platform. Opportunity edits you make in Weflow write straight back to Salesforce, and we publish our seat pricing.
Weflow snapshots opportunities every few hours and imports 12 months
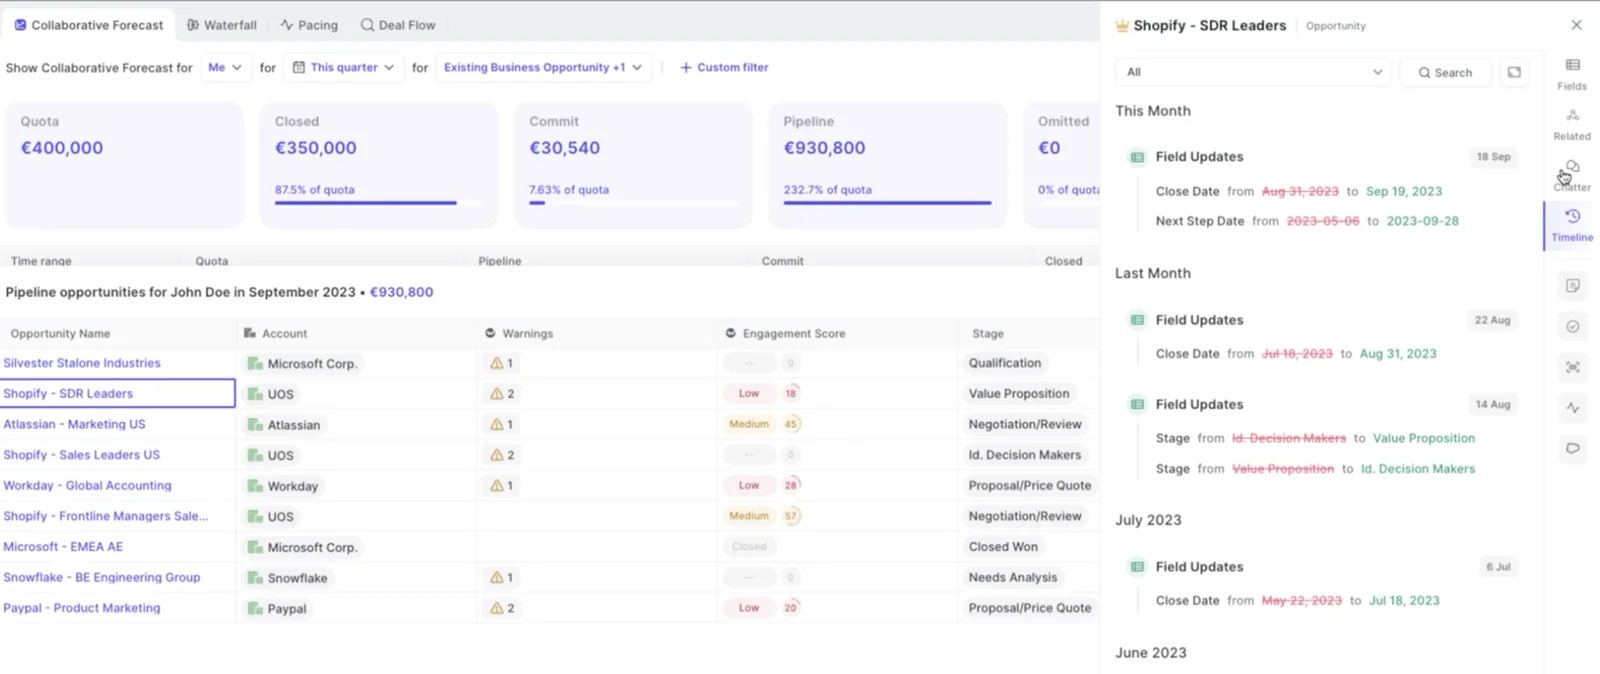
Weflow snapshots every opportunity automatically every few hours. That builds the point-in-time record Salesforce doesn't keep: what each deal's stage, amount, and close date were on any day since you started.
You don't wait four quarters to compare cohorts. Weflow imports 12 months of Salesforce history by default, and more on request where field history allows. The import runs once your forecast configurations exist, because it reads their field mapping, and snapshots build forward from there.
Stage conversion, days in stage, and push counts from your history
Weflow tracks days in stage and close-date push count on every opportunity automatically, with no custom fields or automation to maintain. Those two numbers are the core of the stuck, slow, or sloppy read in Step 3.
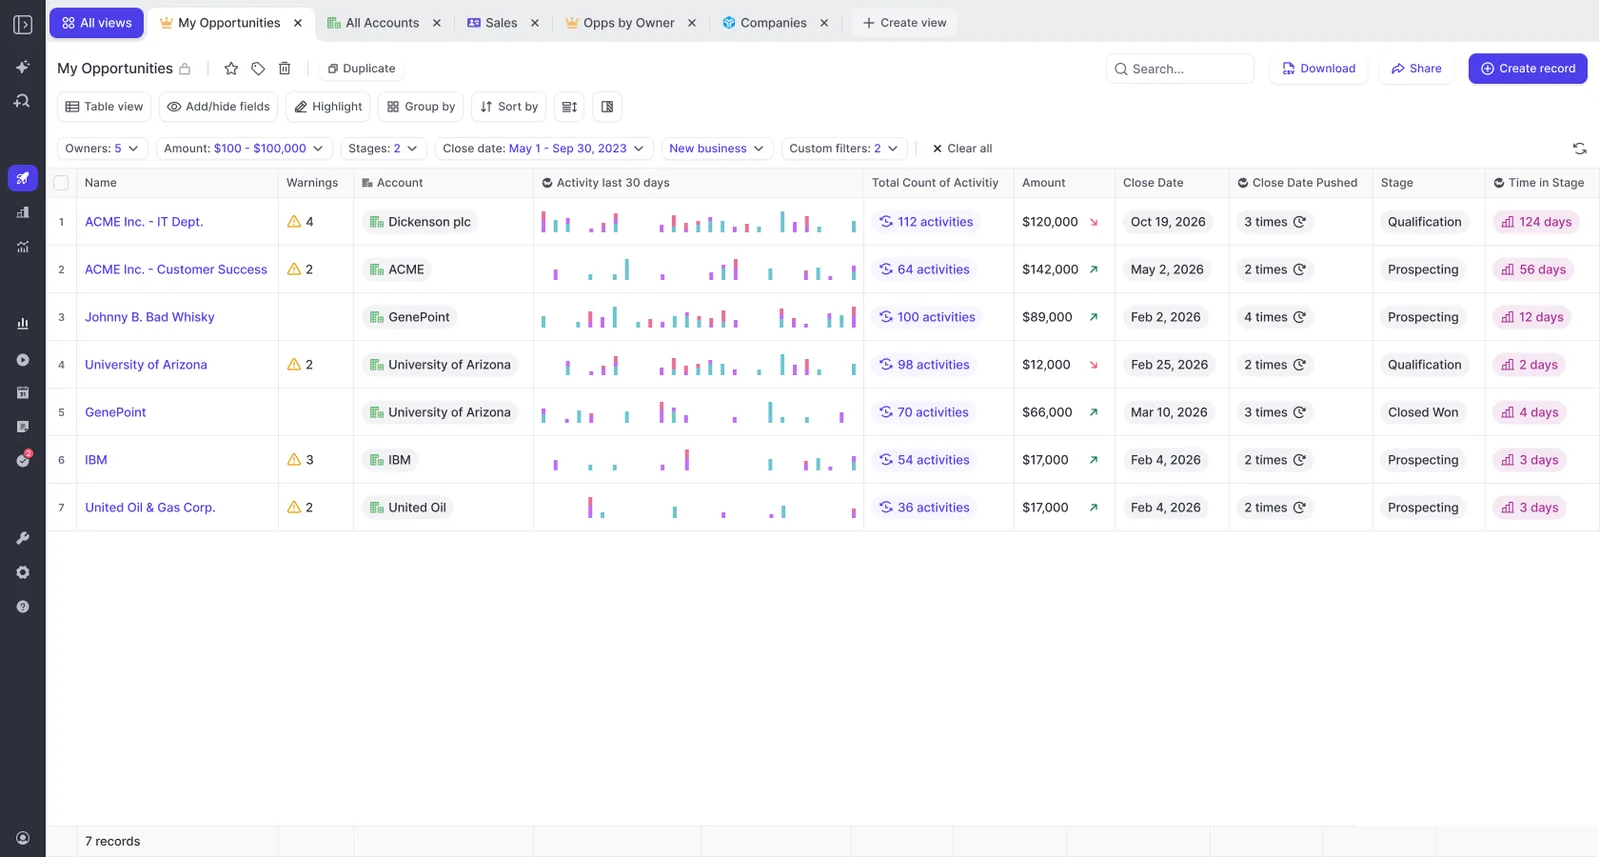
Every measure below comes from your own history, not from probabilities someone typed into Salesforce once:
| Cohort question | Weflow measure that answers it |
|---|---|
| Are deals stuck in a stage? | Days in stage per opportunity, against team benchmarks |
| Are close dates slipping? | Close-date push count per opportunity |
| Where does conversion drop? | Stage conversion by month and by stage |
| Is one team or rep out of line? | Team benchmarks |
| Is the overall rate moving? | Win rate and sales cycle length |
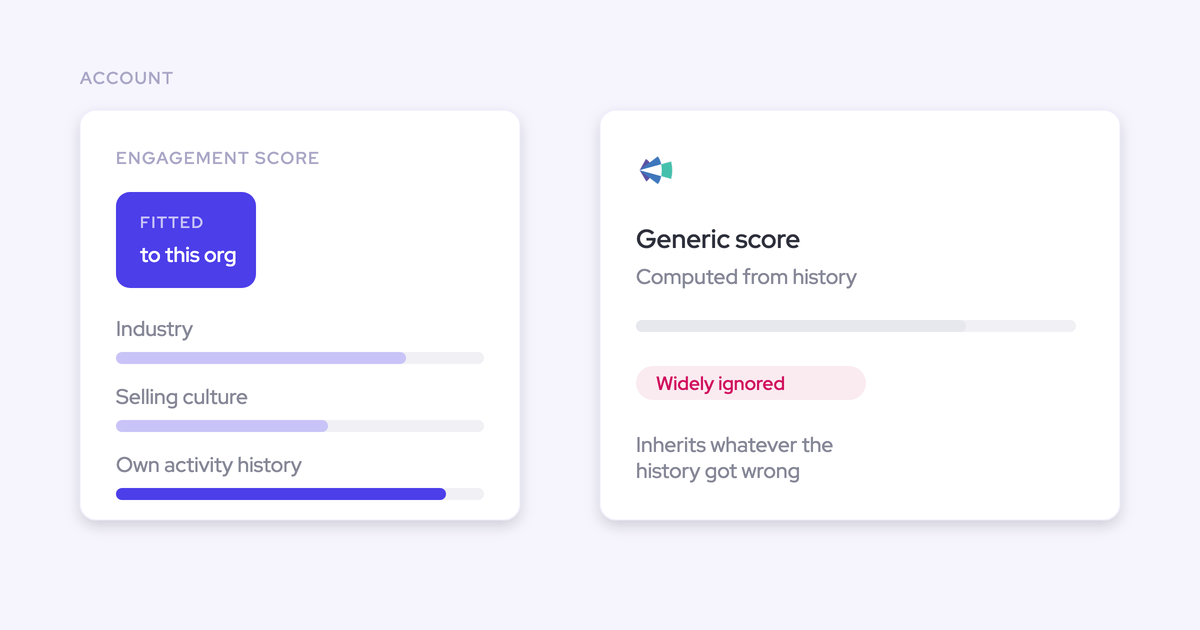
| What rate should the forecast assume? | Weighted-forecast stage win rates, recomputed from a rolling 90- or 180-day window, per rep and team |
The rolling stage win rate follows the same principle as cohorts: rates from your own recent history. It's still a weighting, accurate across many opportunities and quiet about any single deal.
The Weflow waterfall shows where a cohort's pipeline value went
Weflow's pipeline waterfall reconciles starting pipeline to ending pipeline for a period, and every bar drills through to the opportunities behind it. The buckets are:
- Created
- Increased
- Pulled in from a later period
- Pushed out
- Decreased
- Lost
- Won
That's how "this cohort is weak" turns into named deals. You click the pushed-out bar and see which opportunities slipped and who owns them.
What Weflow doesn't do for cohort analysis yet
Weflow supplies the data, not the whole method. These are the walls you'll hit:
- Weflow doesn't group pipeline into a creation-quarter cohort report. The creation-quarter grouping stays in your Salesforce report from Step 1, and Weflow supplies the history and measures beside it.
- There's no setting to date pipeline from a qualified date instead of Created Date. For migrated orgs, we can overwrite the created date in Weflow's copy of the data from a file you supply, as a backend change. Filtering views to qualified stages also narrows what counts as created.
- Weflow doesn't track rep ramp milestones. Job titles sync from Salesforce, but hiring-wave cuts by tenure have to be built outside Weflow.
- Stage conversion isn't drillable to deals the way the waterfall is.
- History for custom fields before rollout depends on Salesforce field history tracking having been on for those fields.
- Snapshot history lives on Weflow's side, not in Salesforce. Forecast submissions and roll-ups live in Weflow too.
Weflow Deal Intelligence & Forecasting pricing and the license you need
Weflow Deal Intelligence & Forecasting costs $39 per user per month, billed annually, with a 10-user minimum. Pipeline analytics come with the Forecasting license, so that's the license this use case needs.
| Product or bundle | Price per user per month | Pipeline analytics for cohort work |
|---|---|---|
| Weflow Deal Intelligence & Forecasting | $39 | Included: snapshots, pipeline analytics, forecasting |
| Revenue AI Foundation | $49 | Not included: Weflow Activity & Contact Capture plus Weflow Conversation Intelligence |
| Revenue AI Business | $59 | Not included: adds Deal Intelligence, without the Forecasting license |
| Revenue AI Enterprise | $79 | Included, alongside every other Weflow product |
Pipeline Management is a separate product and doesn't include analytics, even though the names sound alike. Every plan includes:
- Ask Weflow AI Pro
- Agent Builder Free, with 25 agent actions per month
- Unlimited view-only licenses
- Implementation, at no charge
If you want the full set of pipeline reports this method sits inside, laid out on one page, grab our free AI Pipeline Visibility & Reporting Cheat Sheet.
Frequently asked questions about pipeline cohort analysis
How many quarters of history do you need for cohort analysis?
Start with at least a year, which is how far back Robert Gimbel went for his quarterly cohorts. You need cohorts that have aged past your typical sales cycle to serve as the comparison base. The longer your cycle, the more history you need before the youngest cohorts have anything mature to compare against.
How is cohort analysis different from a pipeline waterfall?
A cohort follows one creation group's conversion over time, so it tells you whether a quarter's pipeline was created to standard. A pipeline waterfall reconciles total pipeline between two dates into created, pushed, pulled in, won, lost, and changed amounts. Use the cohort to judge creation quality and the waterfall to see what moved this period.
Can cohort history estimate how much of today's pipeline will close?
Yes, roughly. Jeff Ignacio's point is that today's pipeline was created cohorts ago, so it carries an expected value you've already observed. Apply each cohort's historical close rate at its current age, and your cycle length, to the value still open. That turns coverage into a forward statement about revenue instead of a static count.
Should new business, expansion, and renewal run as separate cohorts?
Yes. The motions convert at different rates over different cycle lengths, so a blended cohort hides which one moved. One RevOps director we spoke with saw expansions close in about 44 days, against 90 to 180 days for new logos. In Weflow, each forecast configuration gets its own model and history, and renewals forecast in a separate pipeline view.
Does Weflow use our ARR or converted USD amount field?
Yes. A Weflow forecast configuration can point at any standard, custom, or formula field, so it runs on your ARR field or a converted USD amount, with multi-currency support. You can also forecast on opportunity product line items instead of the opportunity.
Where does Weflow store snapshot history, and what if we cancel?
Weflow stores opportunity snapshots on its own side, not in Salesforce, because Salesforce doesn't keep that history. The promise that your data stays in Salesforce after you cancel covers the activity and contact layer, which Weflow Activity & Contact Capture writes to native Salesforce objects. It doesn't cover pipeline history.
How long does Weflow Deal Intelligence & Forecasting take to go live?
Onboarding typically takes two to four weeks, or four to six for a large org, and Weflow doesn't charge for implementation. Forecasting takes longer than capture because you're encoding an operating cadence: who submits, how often, and against which quota. History-based analytics start once your forecast configurations exist and the import has run. For evaluations a short trial can't cover, we offer a three-month paid pilot that's contractually the first three months of a multi-year agreement, with an opt-out at the end.