How to Build Weflow Insights Dashboards for Reps, Managers and Sales Leadership
Learn to build Weflow Insights dashboards for reps, managers, and leadership with pipeline health KPIs.


You can give reps, managers and your CRO each their own board without building three things that drift apart. Every board comes from the same Weflow Insights report library and reaches its audience through profile assignment.
The boards differ in which widgets they show and how they're scoped. They never differ in how a metric is defined.
The library groups reports into four categories: Activity, Responsiveness, Interaction and Trackers, plus saved team views. Activity reports come with capture. Trackers and scorecards come from Weflow Conversation Intelligence.
Leadership needs one more source: the prebuilt pipeline dashboards in Weflow Deal Intelligence & Forecasting, such as the waterfall and coverage. These aren't Insights widgets. A few numbers also need a caveat, and some won't reach Salesforce or Power BI without extra work. We flag each one where it comes up, so none of them surprises your CRO.
What you'll have built: three role boards on one report library
You'll end up with three boards: one for reps, one for managers and one for leadership. All three read the same captured data through the same report definitions.
Weflow is the Revenue AI Orchestration platform for sales, customer success, and RevOps teams. In this setup, that means one set of definitions serving three audiences, so a rep's reply rate and the CRO's reply rate are the same number at different zoom levels.
| Rep board | Manager board | Leadership view | |
|---|---|---|---|
| What it answers | What needs my attention today? | Who's at capacity, and who needs coaching on what? | Where is pipeline moving, is coverage there, and where does conversion break? |
| Where it comes from | An Insights board, plus a locked pipeline template showing only deals that need action | An Insights board | Prebuilt pipeline dashboards (waterfall, coverage, stage conversion), plus an Insights board for outcome metrics |
| Scope | The rep's own activity and deals | The team, with Filter by for one rep at a time | The whole org, cut by team and segment |
| Size at launch | Two to four widgets | Two to four widgets, growing as managers use it | A handful of dashboards and outcome widgets |
| How it gets distributed | Assigned to the rep's profile, such as AE or SDR | Assigned to the manager profile | Assigned to the leadership profile |
| What stays identical | Report definitions, capture data, metric logic | Report definitions, capture data, metric logic | Report definitions, capture data, metric logic |
That bottom row is the whole point. The disagreement problem starts when each audience gets its own build with its own filters and date logic.
What you need in place before building Weflow Insights dashboards
Three things decide whether a board fills on day one: which products you license, which seat each viewer has, and how much history exists.
Which Weflow product unlocks which dashboard widgets
What you can put on a board depends on what you've licensed. Activity insights come with capture, trackers and scorecards need Conversation Intelligence, and pipeline metrics need Deal Intelligence & Forecasting.
| Product or bundle | What it adds to your boards | List price per user per month |
|---|---|---|
| Weflow Activity & Contact Capture | Activity and responsiveness widgets: meeting volume, time in meetings, email volume, reply rate, open rate | $19 |
| Weflow Conversation Intelligence | Trackers, scorecards such as MEDDIC, and interaction metrics like talk ratio and longest monologue | $39 |
| Weflow Deal Intelligence & Forecasting | Deal boards, pipeline templates, warnings, 30+ prebuilt pipeline metrics and dashboards, forecasting | $39 |
| Revenue AI Foundation | Activity & Contact Capture plus Conversation Intelligence | $49 |
| Revenue AI Business | Foundation plus Deal Intelligence | $59 |
| Revenue AI Enterprise | All Weflow products, including Forecasting | $79 |
All plans bill annually with a 10-user minimum. If you're on capture alone today, you can build the rep and manager activity boards now. The leadership layer arrives when you add Deal Intelligence & Forecasting.
Which seat your CRO and executives need to read the boards
It depends on what the exec opens. Our plans include unlimited free view-only licenses for people who only consume dashboards, and seats can move between full and viewer types each quarter.
The boundary is pipeline management and forecasting. A view-only license covers recordings and the insights panel. It doesn't include pipeline management or forecasting.
So plan each exec's seat by what they'll use:
- An exec who reads Insights boards and recordings fits a viewer seat.
- An exec who works the deal boards, pipeline views or the forecast needs a full seat.
Sort this out before you promise anyone a read-only deal board.
How much history your boards show on day one
Your leadership board won't be empty on launch day, but each layer starts from a different point.
- Pipeline and forecasting analytics import up to 12 months of Salesforce history by default.
- Custom fields only have history if Salesforce field history tracking was switched on for them.
- Opportunity snapshots build automatically from go-live, every few hours.
- Emails and meetings can be backfilled into Salesforce for up to 24 months.
- Tracker and scorecard widgets start from go-live, because a call that was never recorded can't be recovered. If you're coming from another recorder, we can import that library during onboarding.
Step 1: Clean the activity data your boards will count
Fix the inputs before anyone reads a number. Three boards that agree with each other can still agree on the wrong figure, and the RevOps leader is the one who has to explain it.
- Switch off meeting-response logging. The Expert Settings of your activity capture configuration include a switch that stops accepted, tentative and declined responses from logging as emails. This protects email volume and touch counts.
- Add compatibility-mode patterns for out-of-office phrases. Weflow doesn't filter auto-replies by default, because they come in every language and every sender words them differently. Add a pattern for each known phrase your market uses. This protects reply rate.
- Filter to inactive users. The default activity view shows active users only, so activity owned by departed reps piles up unnoticed and those accounts look untouched. Select the inactive set and reassign. This protects account coverage and capacity numbers.
- Make sure each meeting lands as one Event. Weflow writes one Event per meeting and attaches the recording to it. A second recorder writing its own meeting record doubles your meeting counts. When a mapping is wrong, fix it from the Outlook or Chrome add-in, which moves both the Event and the recording. This protects meetings per rep and meetings per closed deal.
"If you record a meeting, it's not another meeting. It's the same meeting."
Step 2: Build a rep view that stays empty until something slips
Reps open a view that shows their own activity and only the deals that need them. Everything else is noise they'll learn to ignore within a week.
The rep layer has two parts:
- an Insights board scoped to the rep, with two to four widgets
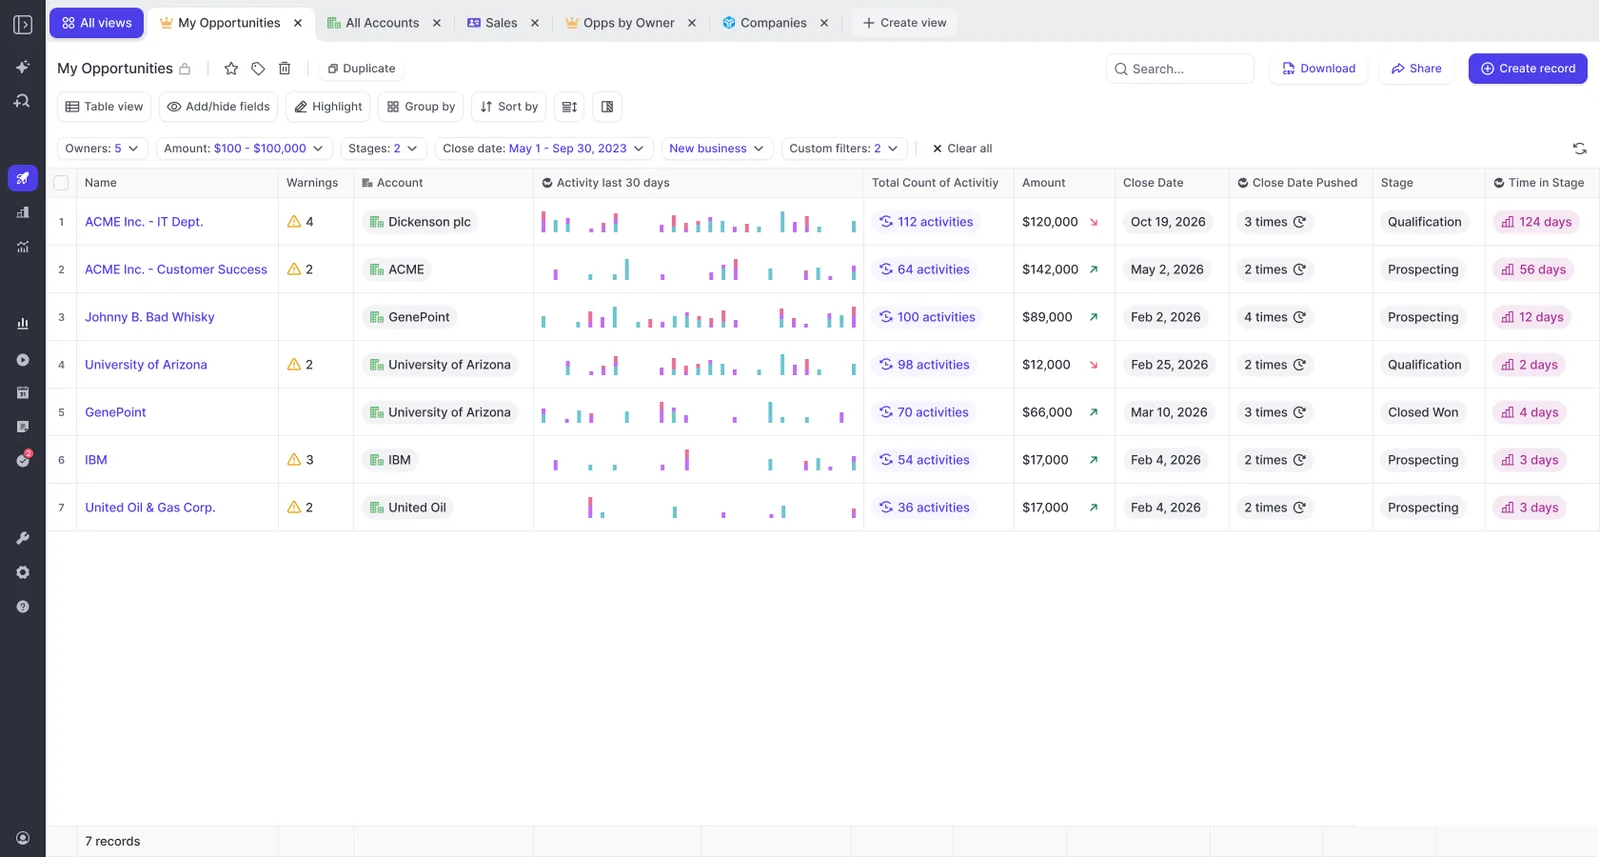
- a locked pipeline template that shows only deals breaking your warning conditions, so it's empty when everything is on track
Build the Insights part first:
- Open Insights and choose Add widget.
- Pick a category: Activity, Responsiveness, Interaction or Trackers, or one of the saved views.
- Pick the report and customize it, including its time window. Each widget keeps its own window.
- Repeat until you have two to four widgets, then choose Save dashboard and name it for the role.
Then build the deal part. Deal warnings live on the deal board and in pipeline views, not as an Insights widget, so this half of the rep layer is a pipeline template.
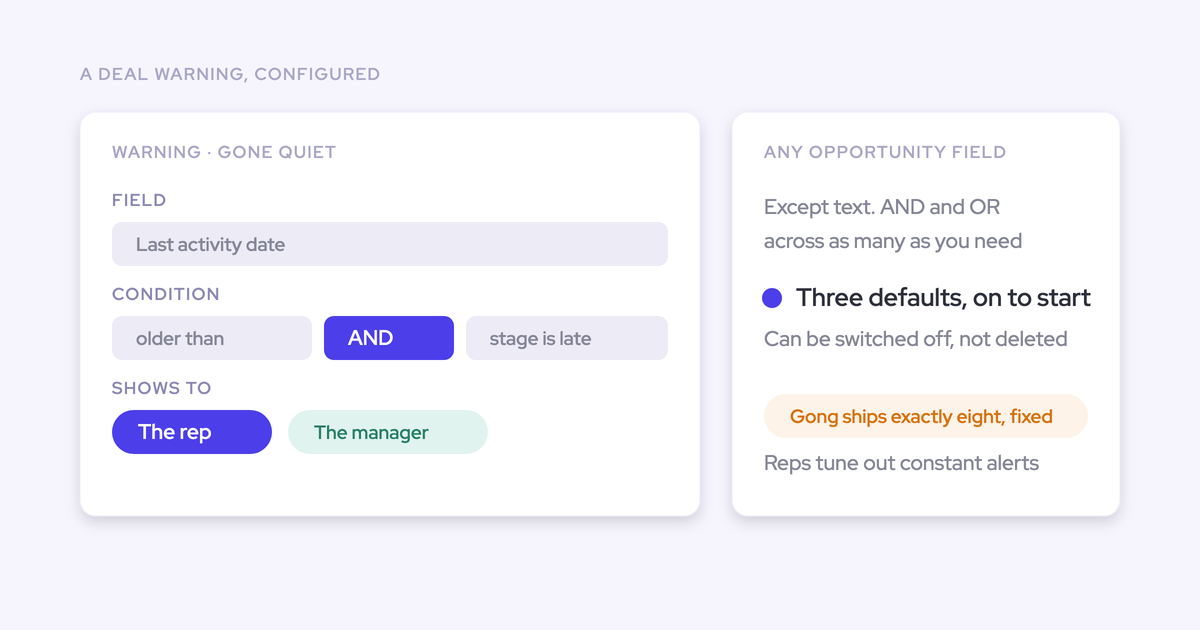
You write warnings as rules against any Salesforce field or any Weflow computed field. Typical rules:
- close date pushed more than twice
- only one contact on the deal
- a missing methodology field
- too many days in the current stage
- no activity for a set number of days
Set the thresholds to your own cycle length. Fourteen days of silence means something on a 60-day cycle and very little on a 12-month one. Filter the view down to the conditions that mean action, add the warnings column, and assign it as a template so reps can't reshape it.
| Widget or view | What the rep learns | Caveat |
|---|---|---|
| Meeting volume | How many customer meetings they ran this period | Counts one Event per meeting, so stacked recorders must be off |
| Email volume and reply rate | Whether outreach is getting answered | Out-of-office replies count unless you've added patterns |
| Time in meetings | How much of the week went to customers | Read from calendar slots, so overruns and unscheduled time don't count |
| Deals needing attention (pipeline template) | Which deals broke a warning rule | Lives in pipeline views, not Insights |
The same warnings also show up inside the forecast submission screen, at the moment a rep picks which deals to commit. That's what keeps an unhealthy deal out of the number instead of flagging it after the forecast is already wrong.
HolidayCheck cut past-due opportunities by about 75% and inactive opportunities by more than 60% after putting this visibility in front of reps.
"The visibility alone changed behavior. Reps come into meetings already aware of what's overdue or inactive. They're more proactive now, because they can actually see what needs attention."
— Bastian Stosic, Head of Media Sales Operations at HolidayCheck
Step 3: Build the manager board for team comparison and coaching
The manager board puts every rep side by side on the same measures, so capacity and coaching conversations start from evidence instead of feel. One Filter by switch then turns the whole board into a 1:1 view.
- Start a new board and add the team activity view or team stats saved view for per-rep volume.
- Add Meeting Volume, Time spent in Meetings, Email Volume, Reply Rate and Open Rate.
- Add a Trackers widget for the keywords your team cares about, such as competitors, pricing or objections.
- Add a Scorecards widget, such as MEDDIC, so methodology adherence sits next to activity.
- Save the board under a manager name.
- In a 1:1, pick one rep in Filter by at the top. Every widget re-reads for that rep, instead of you filtering panel by panel.
One board can mix activity with outcome. Meeting volume and reply rate can sit beside win rate, ACV and sales cycle length, which is the activity-to-outcome join that standard reports struggle to produce.
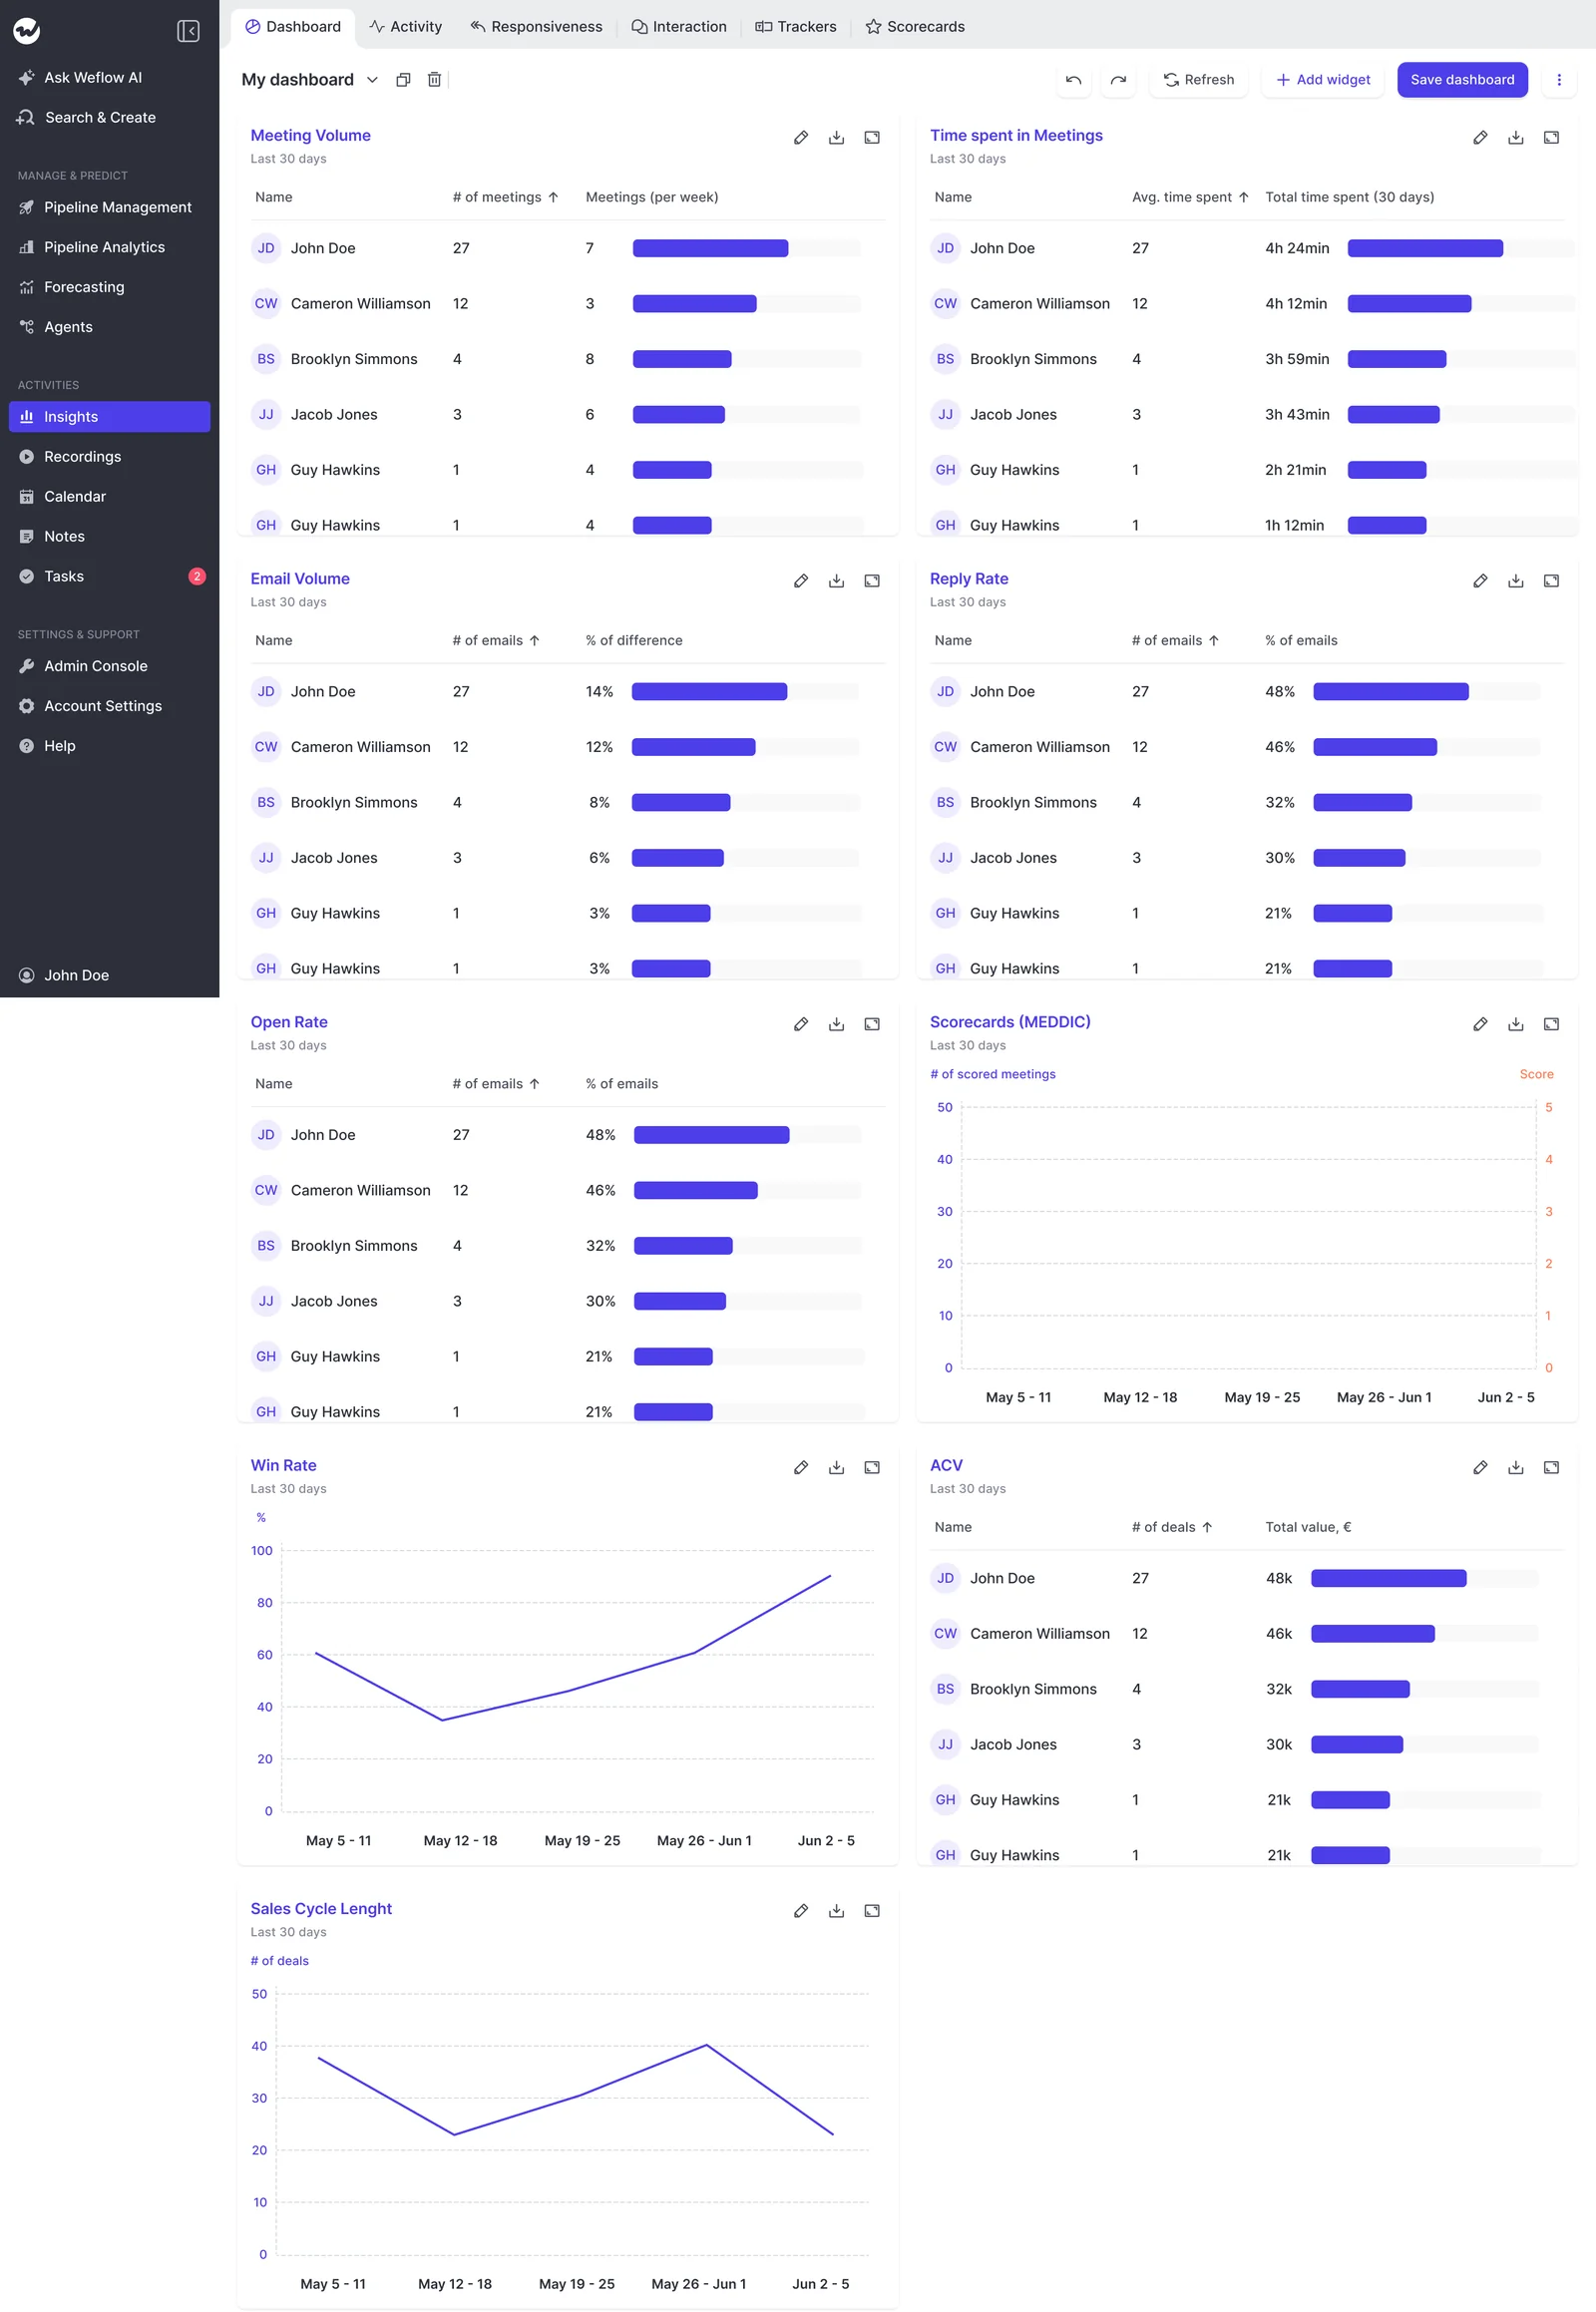
Before managers start drawing conclusions, tell them what each number actually measures.
| Metric | What it really measures | What to tell the manager |
|---|---|---|
| Reply rate | Replies from matched contacts, including out-of-office auto-replies | A rep sending high volume collects more auto-replies and can look more engaged than they are |
| Open rate | Opens on mail sent through the Weflow add-in only | Mail sent any other way is captured but not tracked. A low open rate points at subject lines |
| Time in meetings | Scheduled calendar slots | It understates field-heavy reps. A post-meeting voice note in the mobile app lands as an activity |
| Responsiveness | Whether a received email got a reply within 24 hours, read from the thread | Slow responsiveness points at workload or prioritization, not effort |
| Trackers and scorecards | Recorded calls only | Reps who never signed in to Weflow aren't being recorded, so their rows look thin |
"Now, we have full transparency into the performance of each sales rep and KAM, allowing us to track activity-related KPIs and make data-driven decisions to improve sales strategies."
— Irina Smirnova, Senior Sales Operations Manager at Blacklane
Step 4: Build the leadership view from pipeline dashboards and Insights
Yes, this can become the C-suite board, as long as you know it reads from two sources. The pipeline movement comes from Weflow's prebuilt pipeline dashboards, and the outcome metrics come from an Insights board built on the same library your managers use.
"I would love this application to be the dashboard we leverage for our C suite."
Keep the two sources distinct when you brief your CRO. The waterfall is a Deal Intelligence & Forecasting dashboard, not an Insights widget.
| View | Where it lives | What it answers |
|---|---|---|
| Pipeline waterfall | Prebuilt pipeline dashboard | Why a quarter that opened strong ended thin: created, increased, pulled in, pushed out, lost, decreased and won, each drilling to the deals behind it |
| Pipeline coverage | Prebuilt pipeline dashboard | Whether there's enough pipeline against target |
| Stage conversion | Prebuilt pipeline dashboard | Where deals fall out, by month and by stage |
| Deals at risk | Prebuilt pipeline dashboard | Which deals carry warnings into the period |
| Team benchmarks and pacing | Prebuilt pipeline dashboard | How each team tracks against the others and against the period |
| Out-quarter pipeline | Prebuilt pipeline dashboard | What's being built for future quarters, by target quarter, segment and stage |
| Win rate, ACV, sales cycle length | Insights board | Outcome trends on the same definitions managers see |
| MEDDIC scorecards | Insights board | Whether the methodology is actually showing up in calls |
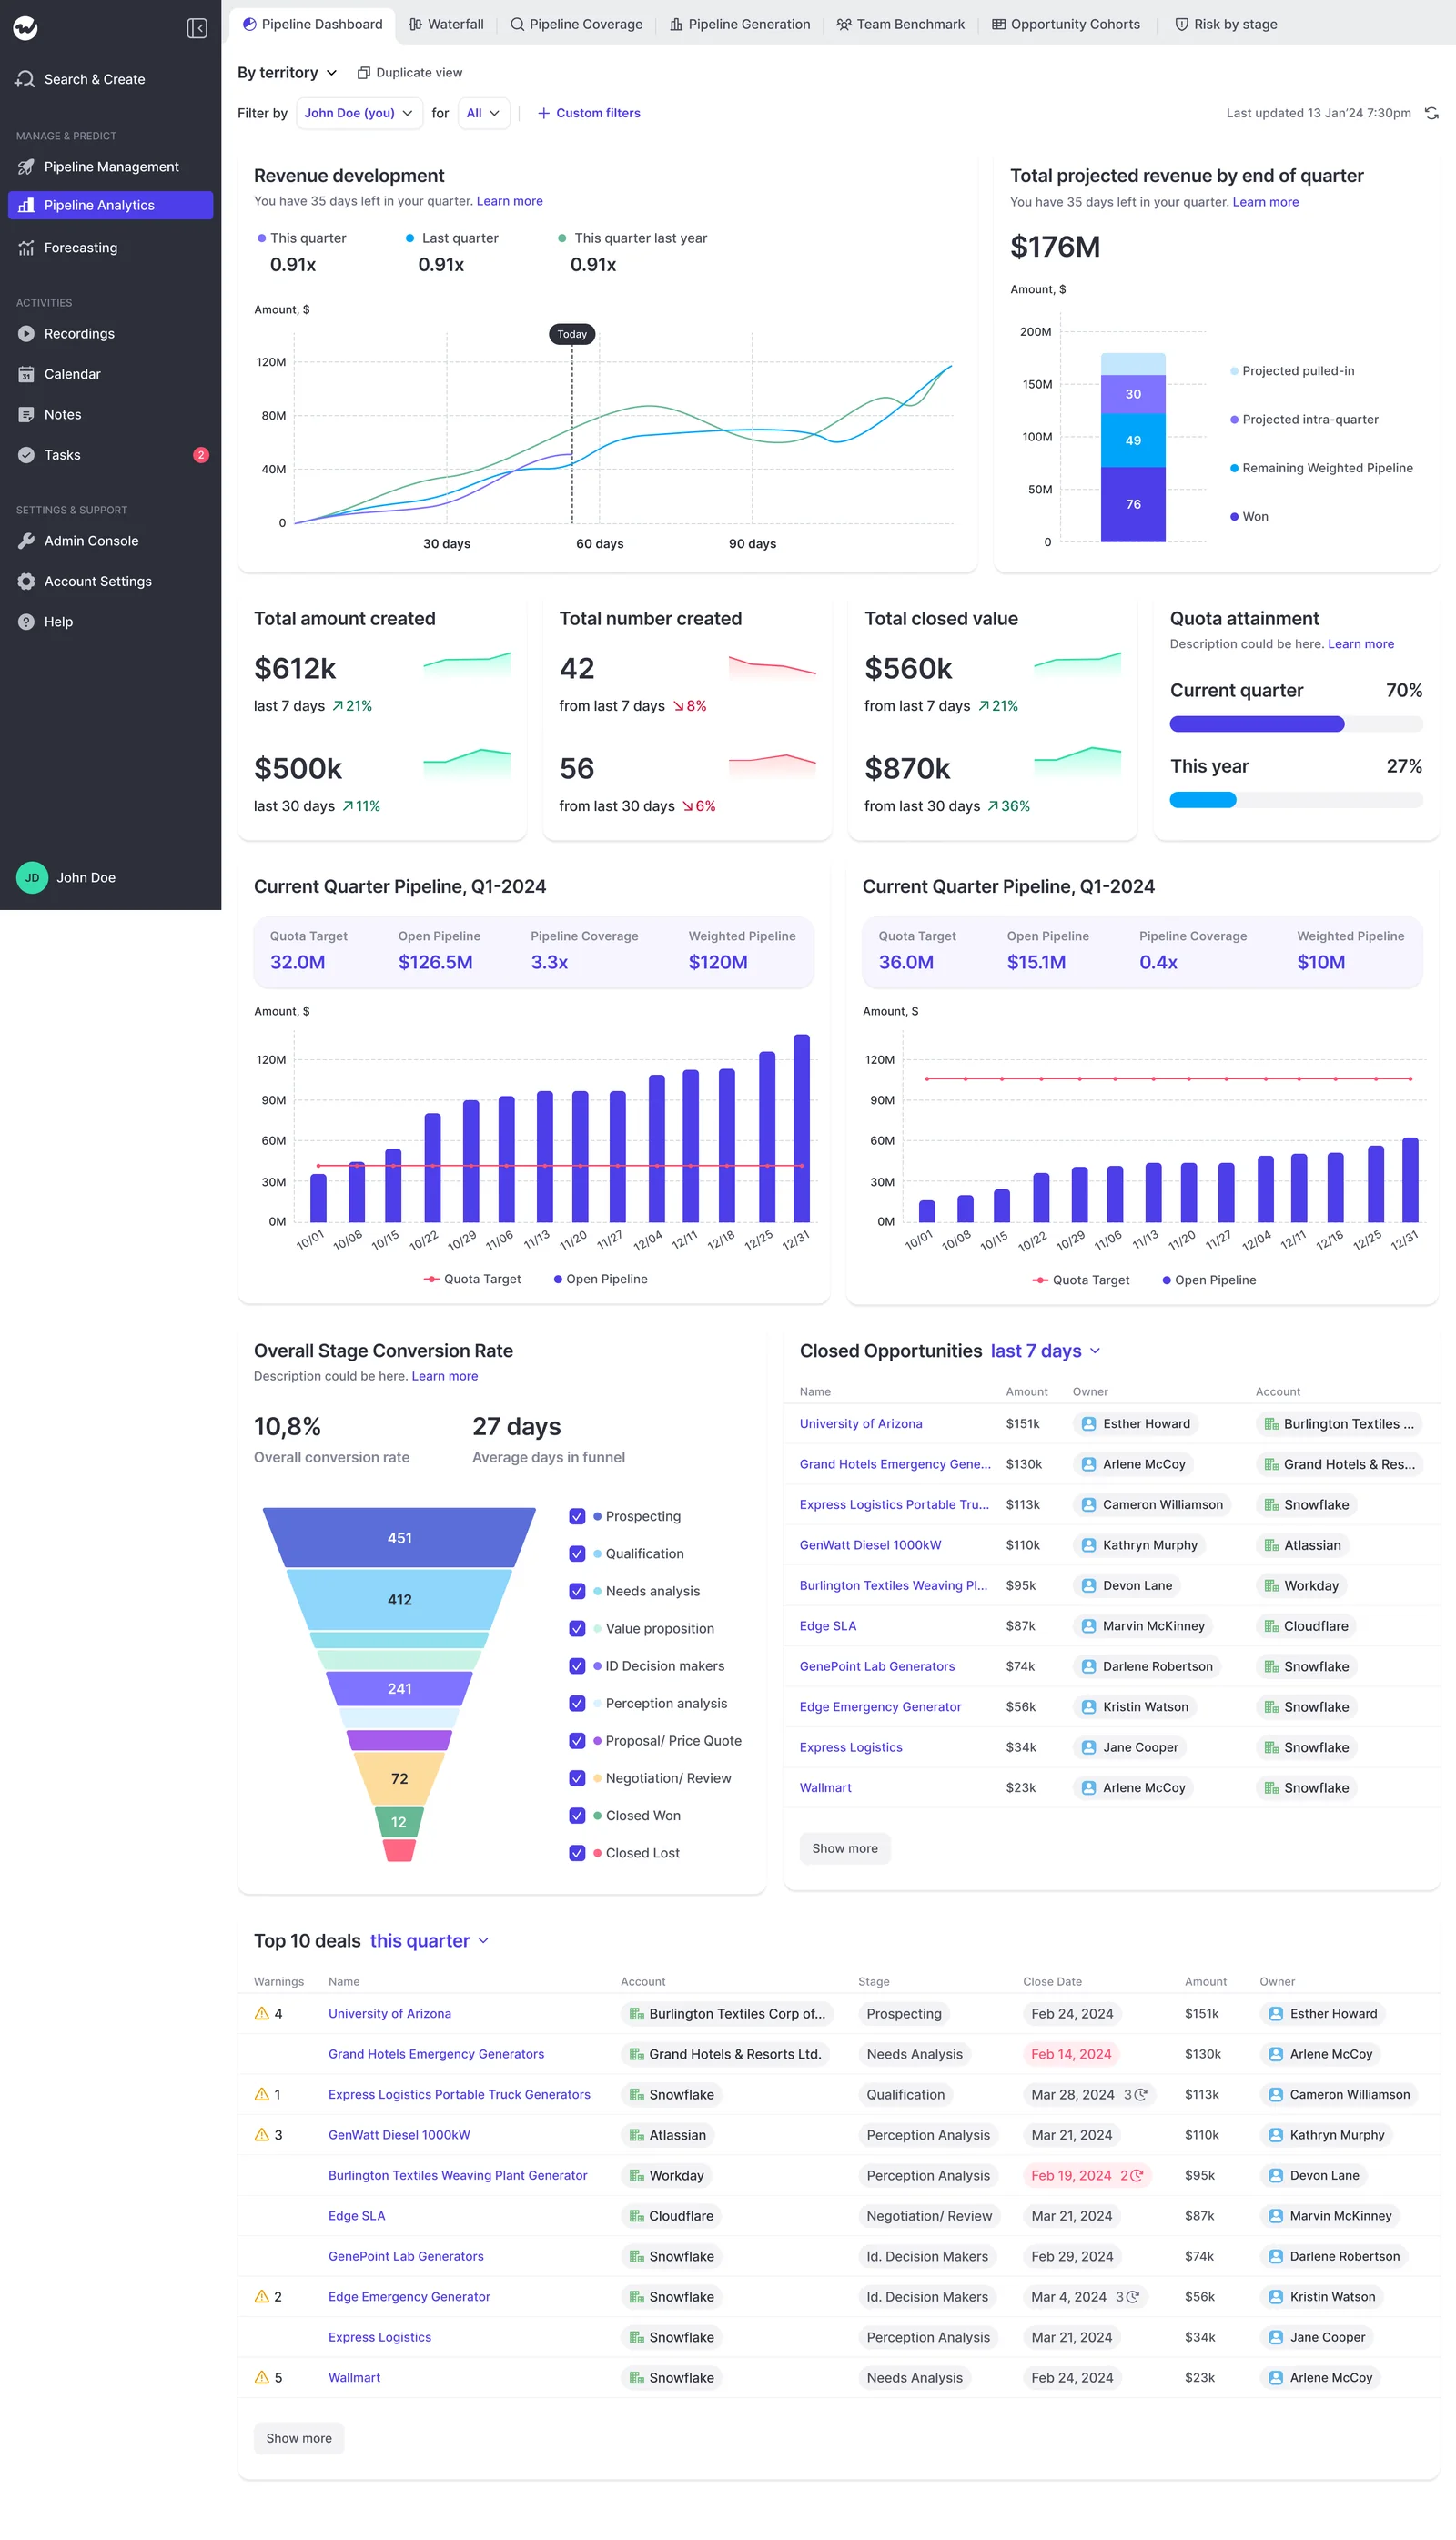
The waterfall works because Weflow snapshots opportunities every few hours. That snapshot history exposes sandbagging and chronic slippage that a live pipeline report hides.
Two limits to know before your first exec review:
- Stage conversion isn't drillable to the underlying deals yet, the way the waterfall is.
- Segment cuts only work on fields Weflow can group by. Formula and roll-up fields display fine but can't be used for grouping or filtering.
Which leadership numbers can reach your Salesforce or Power BI pack
Most numbers have a route out of Weflow, and a few need work first. Here's each one, so you know before you promise the CRO a board slide.
| Number | Can it leave Weflow? | Route or workaround |
|---|---|---|
| Activity reports | Yes | The Analytics package puts them inside Salesforce as an app, using no Salesforce API calls |
| Per-rep pipeline metrics | Yes | The MCP connector returns them to Claude or ChatGPT. Per-rep breakdowns cap at 25 owners |
| Deal edits made in Weflow | Yes | They write straight back to Salesforce |
| Deal warnings and AI Playbook scores | Not by default | These are Weflow fields, marked with a W. An agent has to write them to a Salesforce field you create |
| Forecast submissions and roll-up | Not into Salesforce | They live in Weflow. Pull them out through the public API |
| Individual Insights widgets | Yes | Each widget has its own download control |
The Analytics package is the cleanest route for activity reporting, because the reports sit in Salesforce next to everything else your org already trusts.
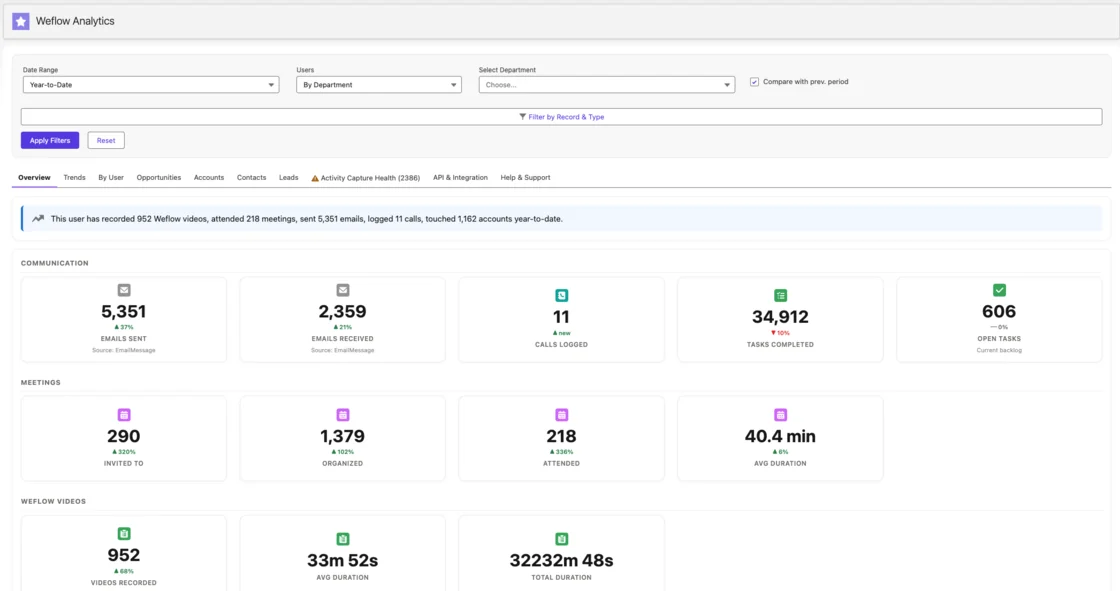
If your board pack has to live in Power BI, treat Insights as the operating view and Power BI as the board artifact. Weflow feeds the data. The deck stays where your board expects it.
Step 5: Assign each board to a profile in the Weflow admin console
You build each board once and assign it to a profile. Every user in that role opens Insights and lands on their board, instead of an empty state and an Add widget button.
- Save each board under a name that says who it's for, such as "AE board" or "Manager board".
- Open the Weflow admin console. It lists every dashboard with the profiles it's assigned to, who created it and when it was last edited.
- Assign each board org-wide or to a named profile, such as SDR.
- Assign the pipeline templates per team. A template locks the field set, so users see the columns you chose and can only duplicate the view to build their own.
Maintenance is where this pays back. When a definition changes, you revise the board centrally and every user in the role sees the new version. Nobody rebuilds anything, and the creator and last-edited columns tell you who touched what.
Step 6: Roll out one role's board at a time
Launch in data-foundation order: activity and conversation views first, pipeline and leadership views once Deal Intelligence & Forecasting is in use. A team tired of new tools accepts one change at a time.
- Phase 1, rep and manager activity boards. First, capture is live and the Step 1 settings are in place. Capture is mostly configuration and asks nothing of reps.
- Phase 2, tracker and scorecard widgets. First, every licensed user has signed in once, so the notetaker joins their meetings.
- Phase 3, the rep deal-attention view. First, activity is mapping to the right opportunities, because warnings are computed from that activity.
- Phase 4, the leadership view and forecasting. First, sales leadership has agreed the forecast cadence. Forecasting is a leadership motion, and it lands best when several weeks of clean data already exist.
KORE Wireless ran a five-phase version of this: Activity Capture, Conversation Intelligence, Coaching, Deal Intelligence, then Forecasting.
Start each role with two to four reports. That's a legitimate starting point, not a compromise.
"It's fine if you only have, like, three or four, you know, or maybe just two, like, basic reports to get started with, and then you work your way, you know, up from there."
Name one internal owner for board maintenance before Phase 1. Templates, trackers and scorecards go stale without one, and stale boards lose trust faster than missing ones.
Common mistakes that make role dashboards disagree again
The old problem comes back through build habits, not through the tool. These are the ones we see most:
- Building a separate board per audience with different filters. Each build makes its own date and owner choices, and the numbers split. Build from the same widgets and change only scope.
- Letting people reshape shared views. A view everyone can edit stops being a shared reference. Lock pipeline templates per team and revise boards centrally.
- Cramming in widgets. The more a board shows, the less anyone reads any part of it. Hold each role to two to four widgets until people ask for more.
- Assigning licenses without sign-ins. A user with a license who never signed in shows as external, and the notetaker won't join their meetings. Their activity still flows, so tracker and scorecard widgets look empty for no obvious reason. Make the first sign-in part of rollout.
- Promising W-field numbers in the board pack. Deal warnings and AI Playbook scores don't reach Salesforce or BI until an agent writes them to a field you create. Build that before the deck depends on it.
How to answer "why not just build this in Salesforce?"
Salesforce reports can't give you snapshot history, cross-object deal boards or the join between activity and outcome. That's your answer when a stakeholder says this looks like a prettier report.
"this page doesn't seem more useful than a Salesforce report"
Salesforce does give you Pipeline Inspection, which shows new, won, lost and changed amounts over a period. Credit it. Anything beyond that view becomes a custom build.
| What leadership asks | Standard Salesforce report | Weflow boards |
|---|---|---|
| How did pipeline move between two dates? | Pipeline Inspection covers one view. Other movement views are custom builds | Waterfall from snapshots every few hours, drillable to deals |
| How did a calculated field change over time? | Salesforce doesn't history-track calculated or roll-up fields | Snapshot history covers it |
| Can I see opportunity, account and contact fields in one view? | Bound to one report type | Deal board columns from all three objects, editable back to Salesforce |
| Does activity predict winning? | Time-between and percentage measures hit report limits | Activity widgets beside win rate, ACV and cycle length on one board |
The vibe-coding argument deserves a fair hearing too. A RevOps lead can turn one Salesforce history report into a full pipeline dashboard in an afternoon.
"That only took maybe an hour and a half to do something my previous company would have taken weeks to build."
The dashboard is the fast part. The slow part is underneath it: reading every mailbox and calendar, deciding which opportunity each meeting belongs to when three are open, and keeping one Event per meeting.
Teams that build most of their stack in-house still buy that capture and mapping layer. Point your skeptic at it.
Choosing your two to four reports per role? Grab our Free RevOps Reports & Dashboard Cheat Sheets as a reference for picking them.
FAQ about Weflow Insights dashboards by role
Can reps or managers edit a board assigned to their profile?
Pipeline templates are locked: users see the admin's field set and can only duplicate the view to make their own. For Insights, the assigned board is the one RevOps revises centrally, and anyone can still build their own personal boards in the same workspace.
Can I download Insights widgets for the board deck?
Yes. Every Insights widget has its own download control next to edit and expand. For activity reporting that needs to live in Salesforce, the Analytics package gives you the reports there, with no API cost.
How do I separate customer success activity from sales outreach?
Give each function its own board and assign it to that function's profile. Then use Filter by to scope the sales board to sellers only, so CS activity never blends into prospecting counts. Inside Salesforce, the Analytics package overview can also be filtered by department.
How do I group a board by a team defined in a formula field?
Group by the object the formula reads from. Weflow can show a formula or roll-up field as a column, but it can't group or filter on it. If your sales team is derived from the opportunity owner, group by owner title instead.
Can Claude or ChatGPT read the same pipeline metrics as leadership?
Yes, through Weflow's read-only MCP connector. An admin switches it on per workspace, and a separate toggle decides whether assistants see full transcripts or AI summaries only.
For each rep in scope, the connector returns:
- weighted and unweighted pipeline
- closed-won amount and count
- win rate and average deal size
- average sales cycle length and coverage ratio
- gap to forecast, plus the opportunity IDs behind the numbers
Requests scope to "me" or "team" for a close-date period, and per-rep breakdowns cap at 25 owners. If no hierarchy is configured, "team" resolves to every active user in the company. Weflow computes these metrics from its own forecast configuration, not from your Salesforce forecast setup.
How many Insights dashboards can one Weflow workspace hold?
A workspace holds several Insights boards. One board per role plus a few personal ones is a normal setup.