
Why your sales forecast keeps blindsiding you: it's the inputs, not the math


You called the number in week one. Coverage looked fine, the commit list looked solid, and then week five arrived and deals started sliding out one at a time. By the time it was undeniable, there was no quarter left to build replacement pipeline in.
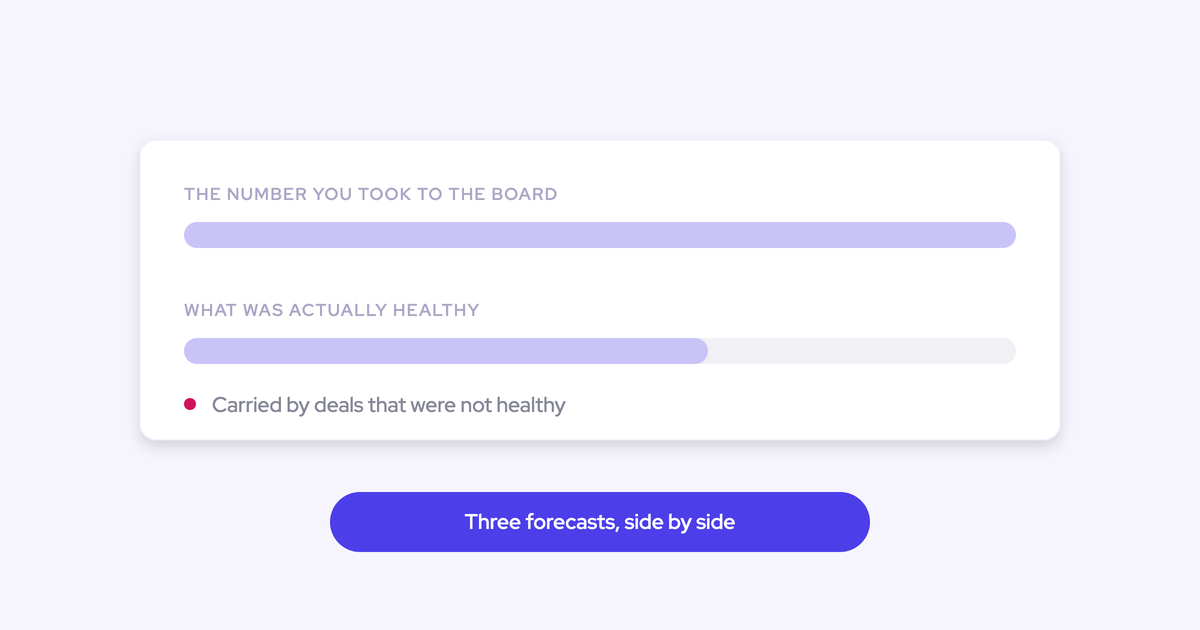
That miss wasn't an arithmetic failure. It happened because unhealthy deals carried their full dollar value into the number, and nothing in your process surfaced that while there was still time to act.
You've already tried both available fixes: haircut the number by feel, and ask the team to be more honest. Both happen downstream of the inputs, which is why neither changed the result. What follows is where the inflation actually enters, why it stays invisible until week six, and what a forecast built on independent reads and early deal warnings looks like instead, which is the discipline we built Weflow Deal Intelligence & Forecasting around.
Why forecasts miss: the inputs, not the math
A sales forecast misses because unhealthy deals carry their full dollar value into the number, not because the calculation is wrong.
Take a pipeline of a hundred deals where half are stalled. It still reports at full value. Every method that reads that pipeline inherits the inflation: the weighted view, the rep roll-up, the AI prediction. Change the math and you get a different wrong answer.
"It's not necessarily the math in the number. A lot of what I've seen in my experience, and a lot of what was proven to be true, is the inputs that take place before the output."
Which is why the haircut never works twice. Adjusting the number down treats the symptom and leaves the bad pipeline sitting exactly where it was. Next quarter the same deals inflate the same call, and you haircut again.
Why the miss surfaces in week six, not week one
The rot is there on day one. What's missing is anything that shows it to you before the deals start slipping, so the first visible symptom lands in the one part of the quarter where you can't do anything about it.
Coverage that looks healthy is hiding unworked deals
Coverage measures pipeline dollars. It says nothing about pipeline health, which is why a quarter covered three times over can be uncovered by week six.
"We've all lived through this reality where your pipeline coverage looks pretty good, and then in week five, six, seven, it starts to slip and stall. And suddenly, your pipeline coverage evaporates."
The cause is almost never that too little pipeline got created. It's that nobody inspected the deals inside the ratio. The signals that would have warned you weeks earlier sit on the opportunity:
- engagement dropping across the buying committee
- no next step and no next meeting booked
- one contact on a six-figure deal
- a close date already pushed twice
- days in stage well past what your own closed-won deals took
And the ratio itself lies at volume. Four times coverage assembled from a hundred and fifty open opportunities isn't coverage, it's a queue no rep can work. Read coverage next to deal count per rep, win rate and cycle length, or don't read it at all. The 3x rule you inherited from a conference talk was never tested against your win rate.
Salesforce keeps no record of what the pipeline looked like
Salesforce overwrites the field and keeps no snapshot, so after the quarter drifts, the evidence of what changed no longer exists.
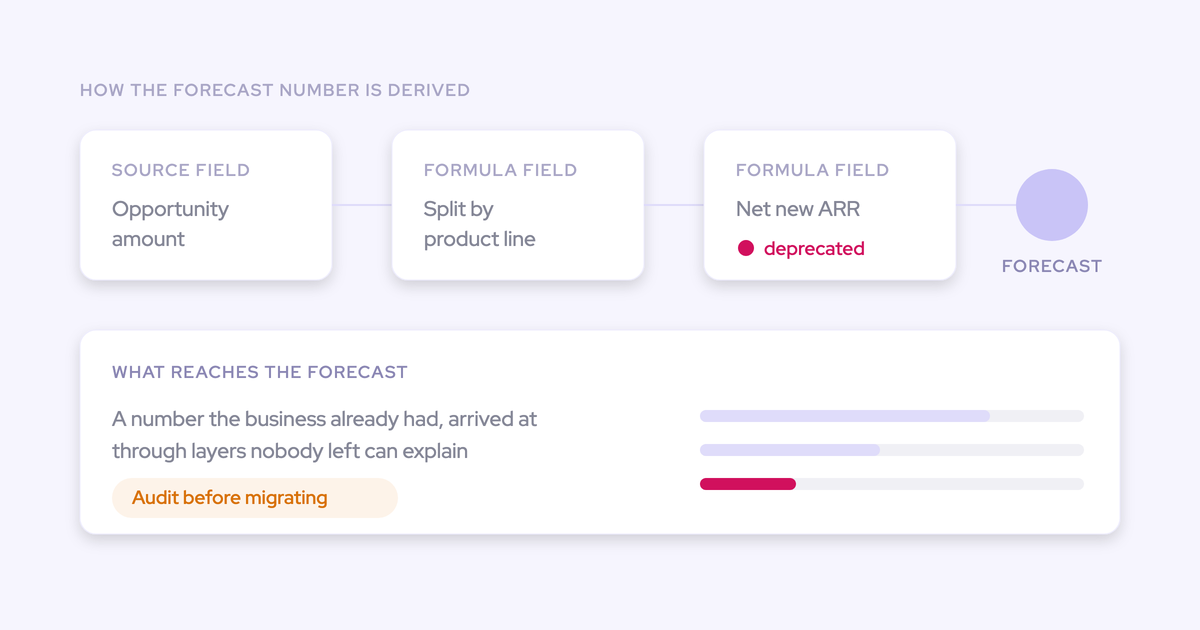
It gets worse in two specific ways. Field history only exists if someone enabled tracking on that field in advance, and calculated and roll-up fields can't be history-tracked at all, which is usually exactly the custom ARR or booking field you forecast on.
So when a leader asks the obvious question, how are we doing at day 35 compared with day 35 of the last three quarters, the honest answer is that it can't be investigated. Teams either drop the question or stand up a warehouse and pay to snapshot opportunity data into it. A management question turns into a data engineering project with a bill attached.
What inflates the forecast before the math ever runs
Four mechanisms put fiction into the number, and each one is rational for the person doing it. That's what makes them durable.
Reps open thin deals and never close dead ones
A thin pipe earns a rep a difficult conversation with their manager. A fat one doesn't. So deals that don't meet the criteria get opened anyway, and new AEs do it most.
Nobody closes anything lost either, so dead opportunities sit there with a close date that keeps moving forward.
The real damage lands two quarters later. Your historical close rate has been diluted by deals that were never real, and your average sales cycle has stretched because it's measuring corpses. The benchmark you use to judge whether a live deal is late is now wrong in the direction of optimism. This is not a character problem, it's the incentive working exactly as designed.
Commit means whatever each manager decides it means
Commit is the one category the board acts on, and in most orgs it carries no checkable information.
"Now you talk to a sales leader, what's your commit? They'll tell you, well, it's ninety percent, eighty percent. And then you find out that only fifty or sixty percent of those deals won. Okay. Well, something's wrong with your commit process then."
The stage is your process. The forecast category is your judgment. Judgment is fine, as long as it's evidenced from the deal rather than asserted by the rep, and as long as last quarter's commit gets measured against what actually landed. Without that, hiring and board guidance get set against a private opinion and then reset in the final two weeks.
The CRM fields behind the number were never maintained
The forecast is assembled from fields nobody kept current. Open ten opportunities in your commit list right now and you'll find some version of this:
- next step blank, or a next step dated last month
- close date pushed four times with no reason recorded
- last logged activity a meeting six weeks ago, and half the team never logged theirs at all
- methodology fields empty on deals sitting in late stage
Everyone in the chain knows the inputs are fiction. You can't fix it by asking reps to try harder, because you've tried that, twice. Manual entry was never going to produce this data.
The roll-up lives in spreadsheets nobody can audit
The real forecasting incumbent isn't a vendor. It's the sheet.
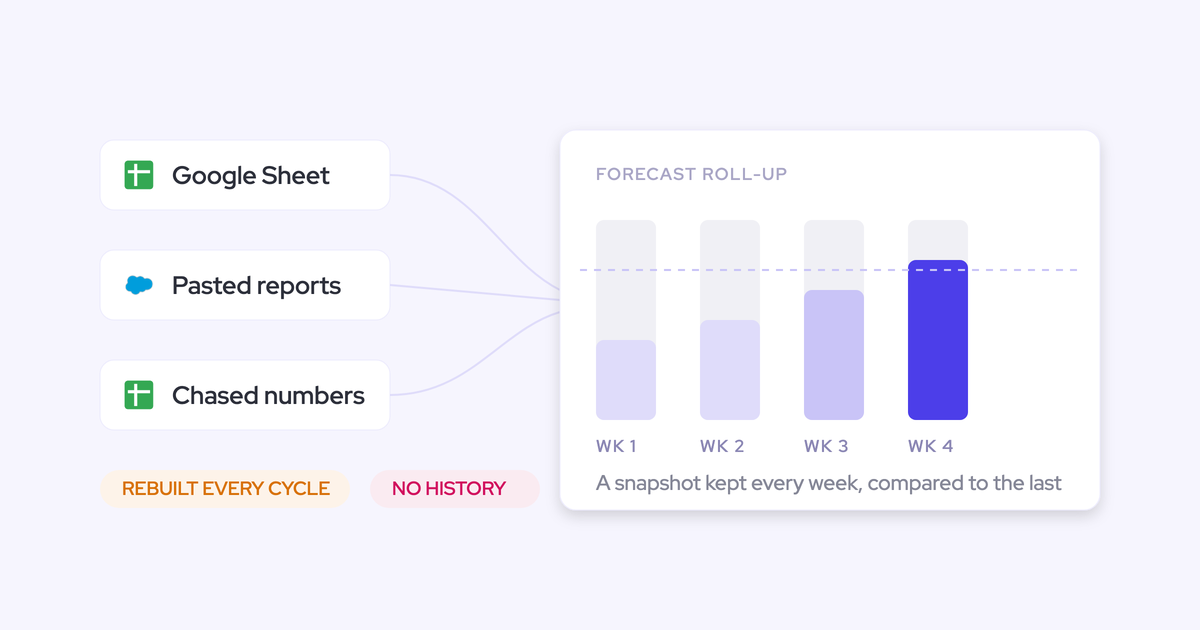
Companies with thousands of sellers pull Salesforce reports, paste them into Google Sheets, and spend the week chasing managers for numbers that are stale by the time they arrive. Ten reps means ten sheets that can't be rolled up, and someone in RevOps takes a manual snapshot every Monday just to see what moved.
"I want to eliminate the Excel. I want real-time visible forecasting dashboards that we're interacting in."
Three things break in a spreadsheet forecast, every time:
- Reps don't submit their own numbers, so what you have is a manager forecast wearing a team's name.
- A deal-by-deal call is unmanageable at scale. Fifty reps holding ten to fifty deals each doesn't fit in a sheet.
- You can't inspect what's slipping, because the context that would tell you lives somewhere else.
And it's expensive. That one-hour forecast call is four days of work: ops pulls the pre-read, reps chase updates, managers prep, the recap goes out midweek. Multiply those hours by everyone dragged into them. Then the number is still wrong.
What happens next: gut haircuts and finance's shadow forecast
When you know the number is a mood rather than a measurement, you compensate. You trim it by feel, your manager trimmed theirs by feel, and the number that reaches the board is two people's instincts stacked on each other.
The board notices. Not the first quarter, but by the third.
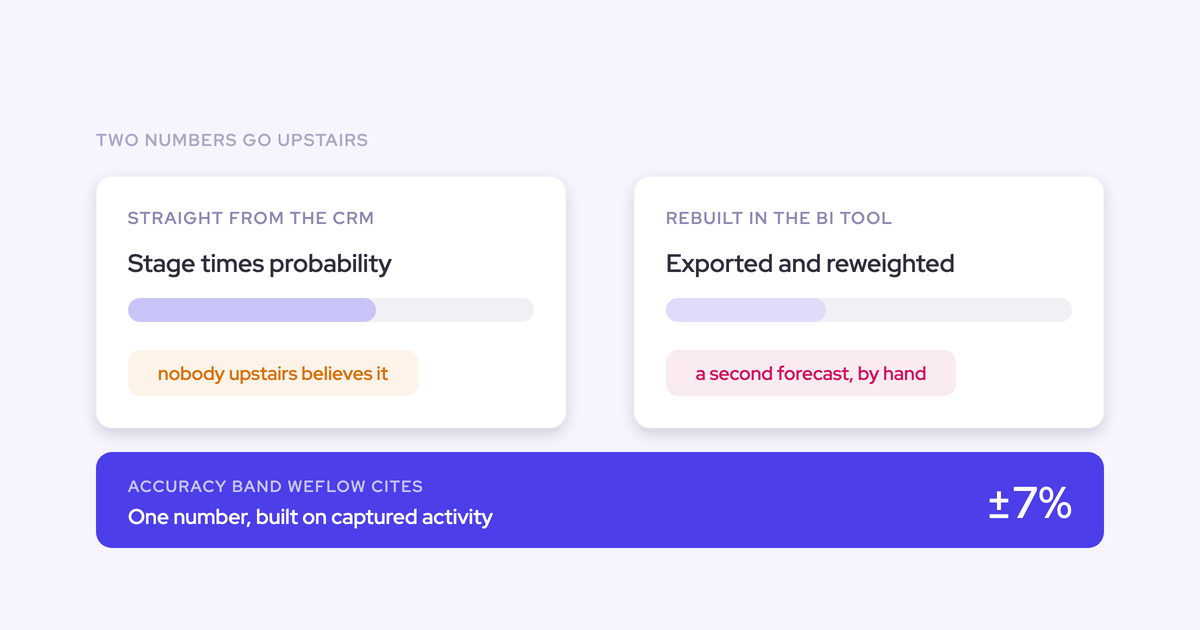
Then finance quietly starts building its own. Pipeline gets exported, weighted averages get applied, a second number goes upstairs, and sometimes finance turns out to be the more accurate of the two. Now two forecasts run in parallel, nobody can say which one is real, and the sales organization has lost the authority to speak about its own business.
That's the part no better roll-up wins back. Missing the number is survivable. Missing it and having no way to walk it down, no way to say it was the enterprise segment, or conversion at discovery, or three deals that were dead in week two, is what costs you standing. The model was never what anyone stopped trusting. It was the data underneath it.
What it takes to see the miss coming
Removing the blindside means intervening upstream of the number instead of adjusting the number afterwards. Four things do the work, whoever you run them with.
A second opinion that owes nothing to the rep
You need a projection that was never asked to be optimistic: built from pipeline signals, deal behavior and your own historical conversion, sitting next to the rep's call.
The value isn't in either number. It's in the gap. A rep whose submission sits far above what the pipeline mathematically supports is telling you something, and so is a rep whose call hasn't moved all quarter. That gap is an agenda item you can argue with evidence, which is the alternative to haircutting by feel.
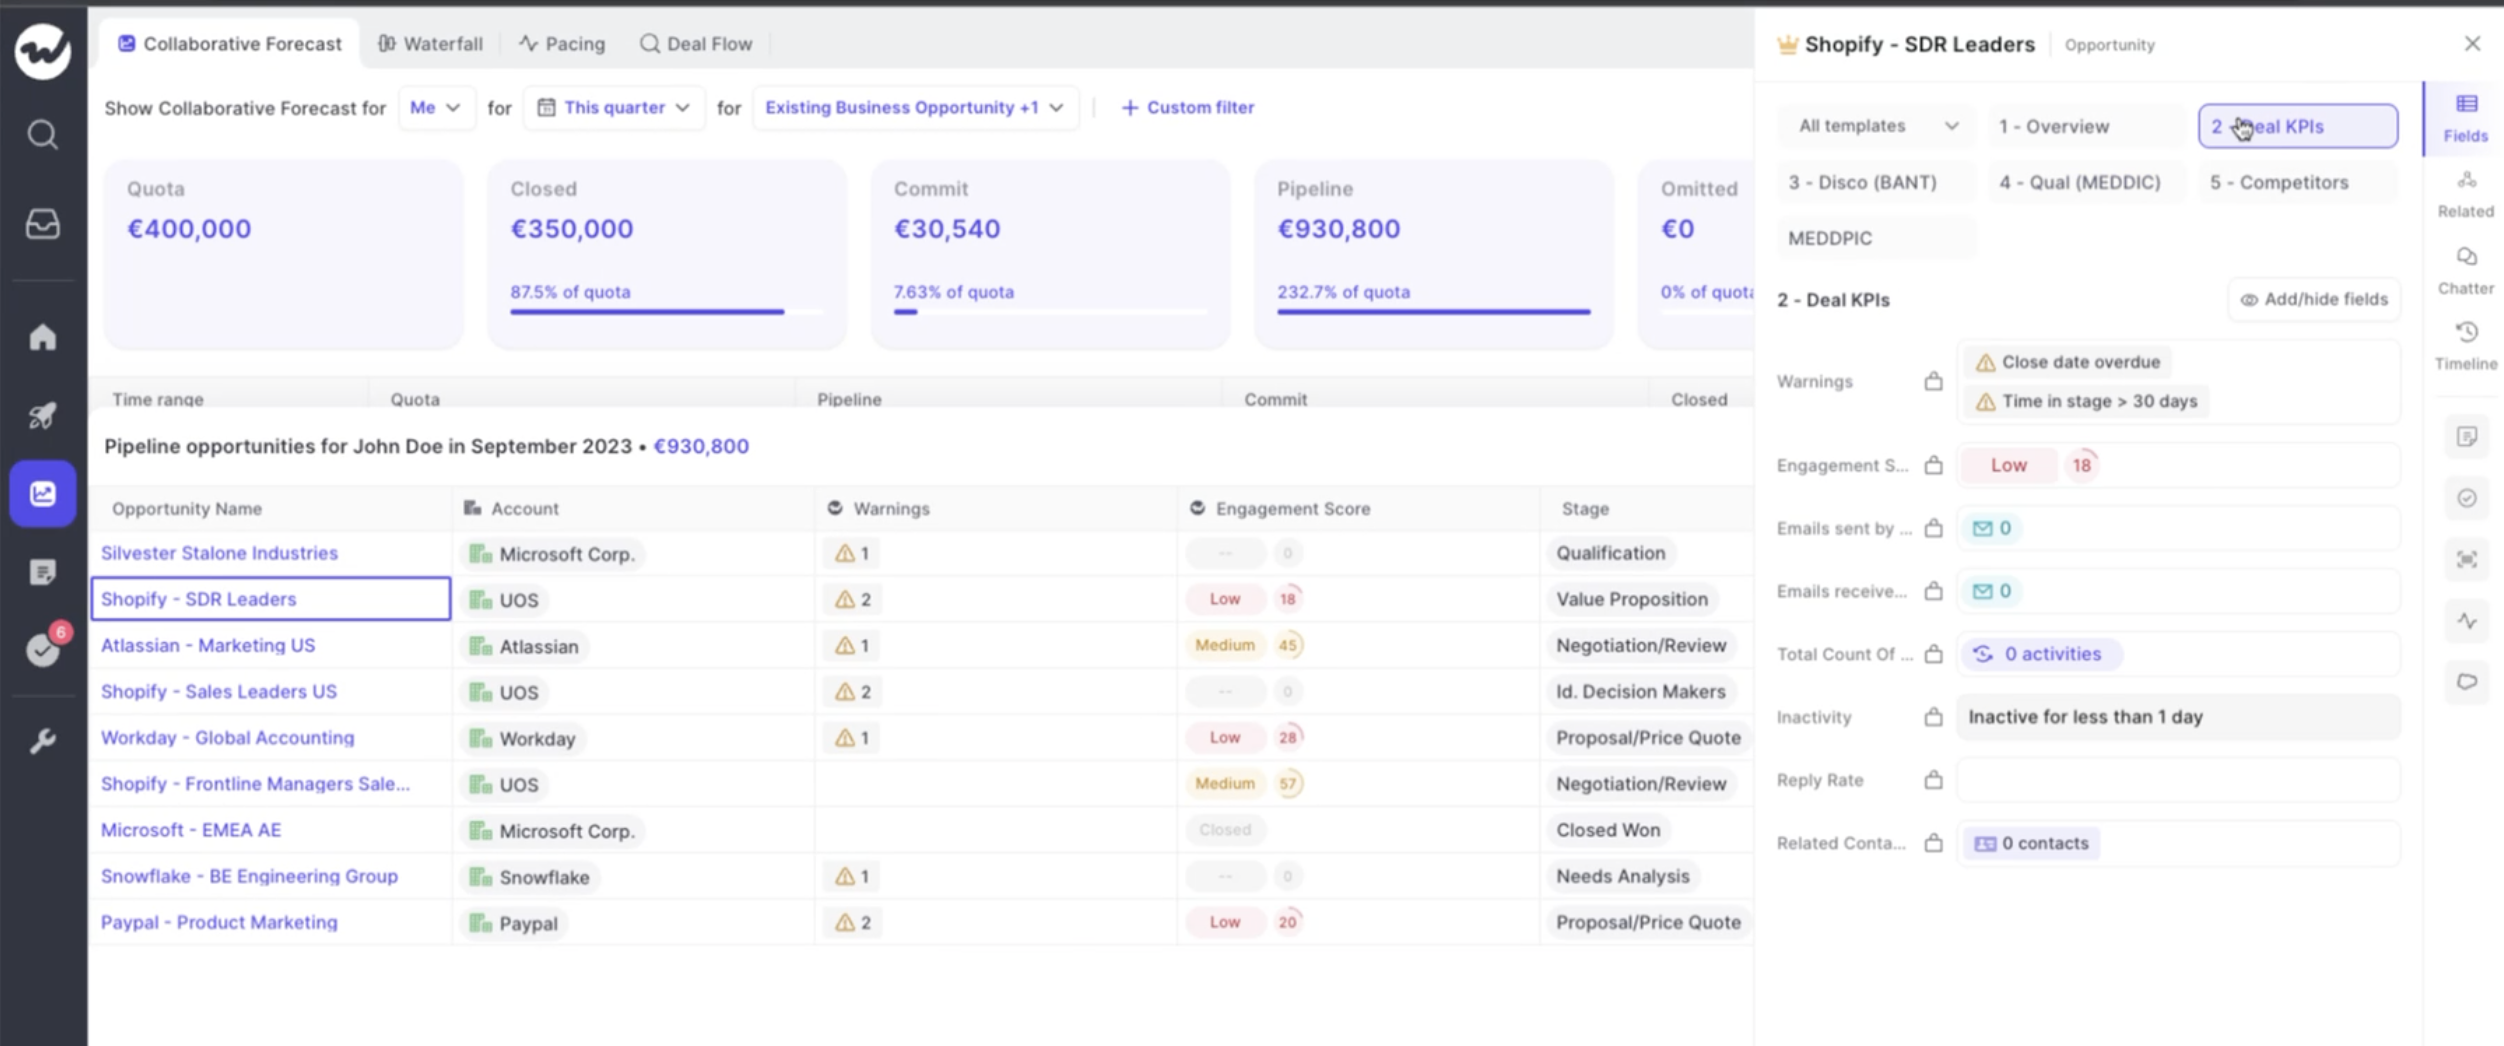
Deal warnings before unhealthy pipeline enters the number
A warning in a report after the number is submitted changes nothing. The intervention point is the moment a rep decides this deal goes into commit.
Warnings only work when they encode your slippage patterns and your cycle length. Silence for 14 days is a red flag in a 60-day cycle and noise in a 12-month one. The triggers worth defining are usually:
- close date pushed more than twice
- only one contact on the opportunity
- no activity for a set number of days
- days in current stage beyond your closed-won benchmark
- a missing methodology field on a late-stage deal
Weflow computes those signals from captured activity rather than typed fields, so they can't be gamed by a rep updating a picklist, and it surfaces them inside the forecast submission screen. IDnow reduced slipped deals by 60% working this way.
A pipeline history that answers where the quarter went
You need snapshots of the opportunity records, taken on a schedule, so starting pipeline can be reconciled to ending pipeline. Weflow snapshots opportunity data every few hours and builds a waterfall from it:
- newly created
- amounts increased
- moved into the period
- moved out of the period
- amounts decreased
- won
- lost
The two buckets that matter most are the two a live pipeline report can't show you: moved out and decreased. Those are the early warning that the quarter is drifting.
Each bucket has to drill through to the actual deals, or it names a problem without naming the deals causing it. Snapshot history is also what exposes chronic slippage and sandbagging, where a stable-looking total is churning underneath with the same deals pushed every quarter.
Forecast accuracy tracked as a metric, not an anecdote
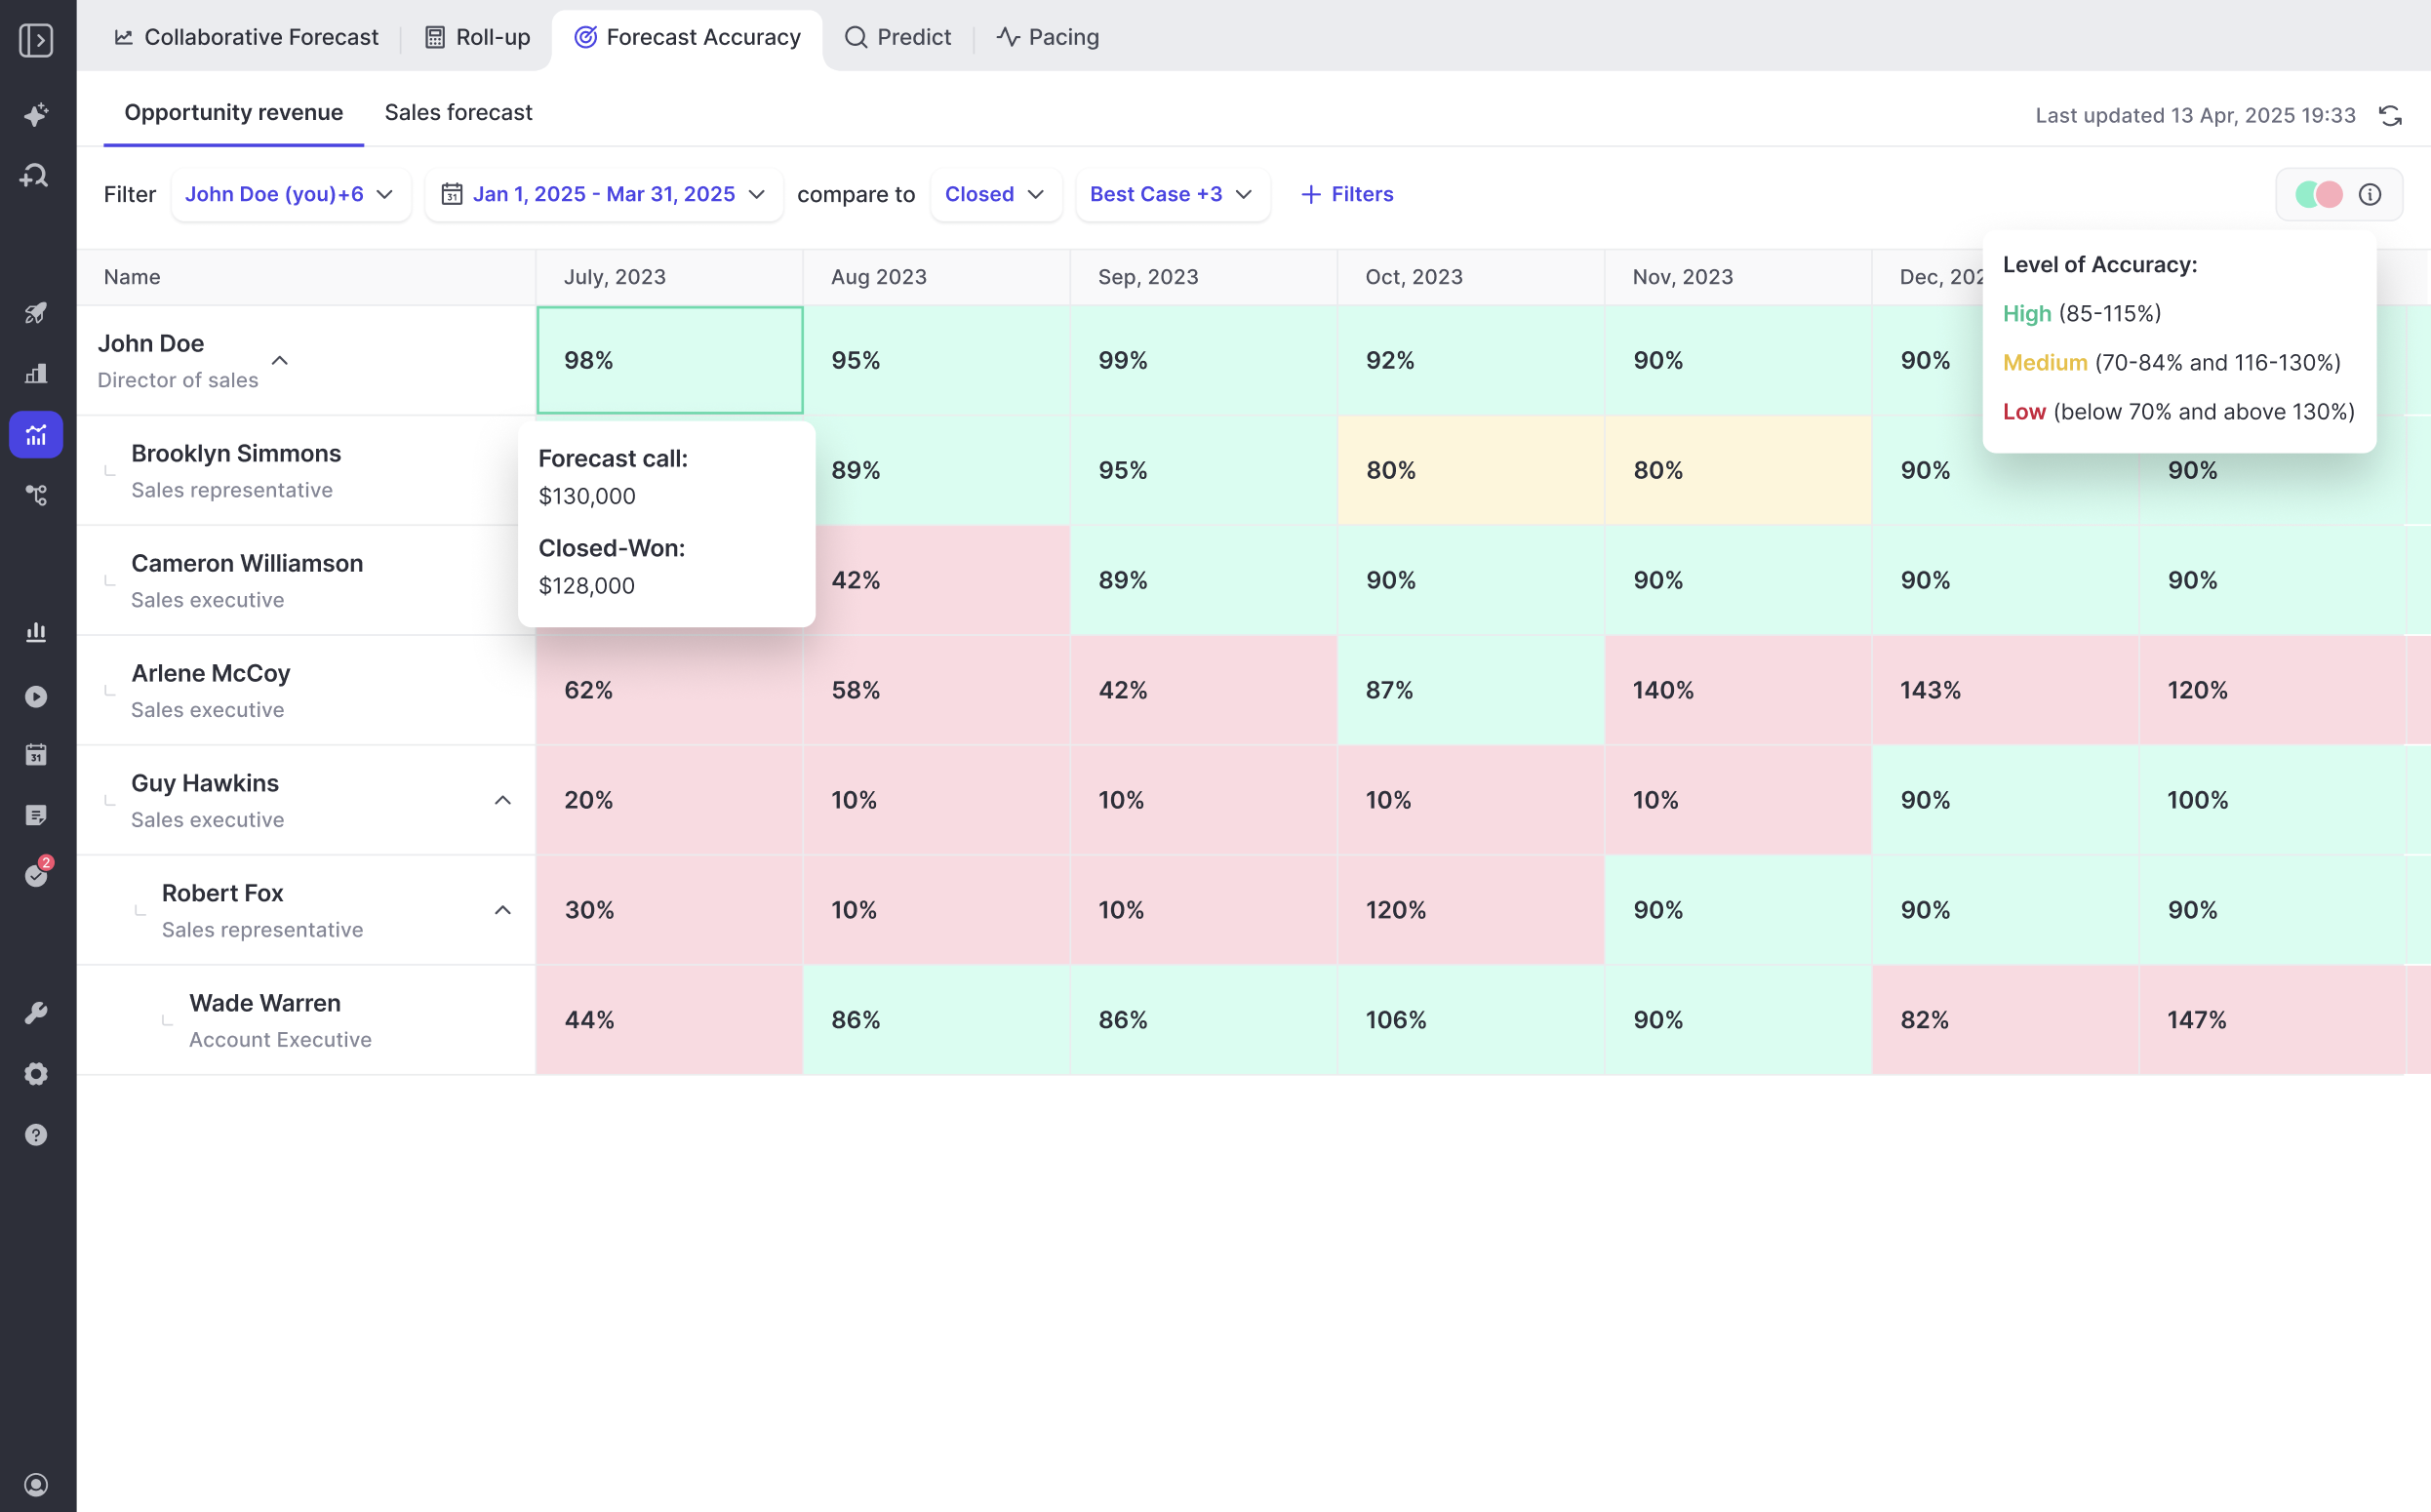
Right now the number a rep called on Monday and the number that closed live in different places, so a rep can miss by thirty percent three quarters running and it never shows up anywhere a manager can act on it.
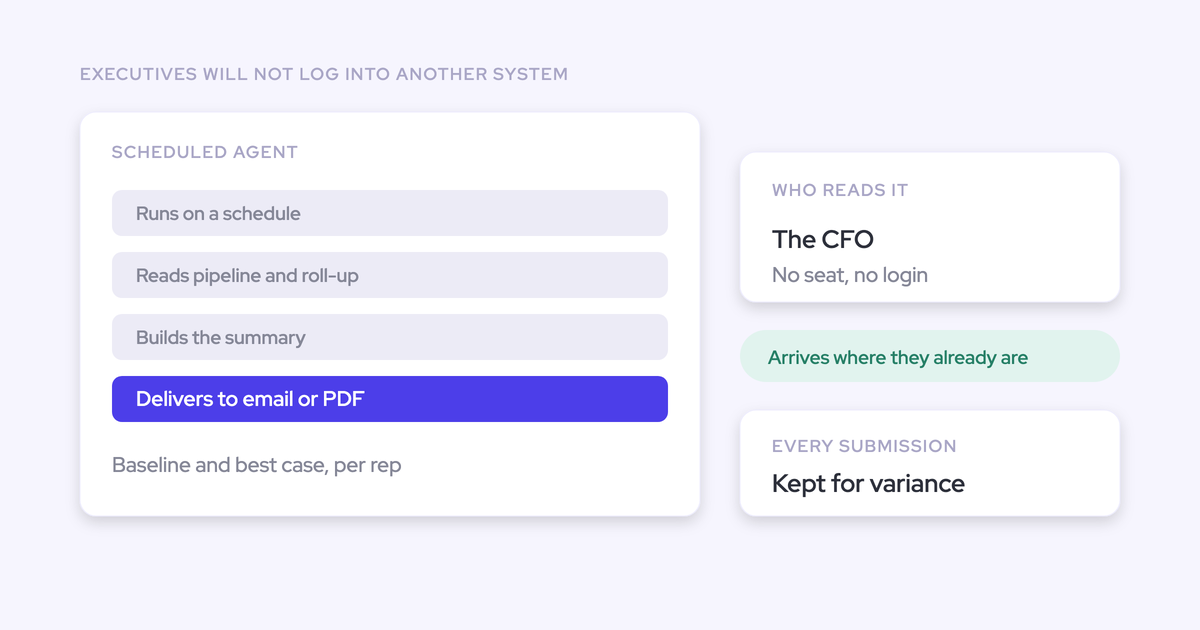
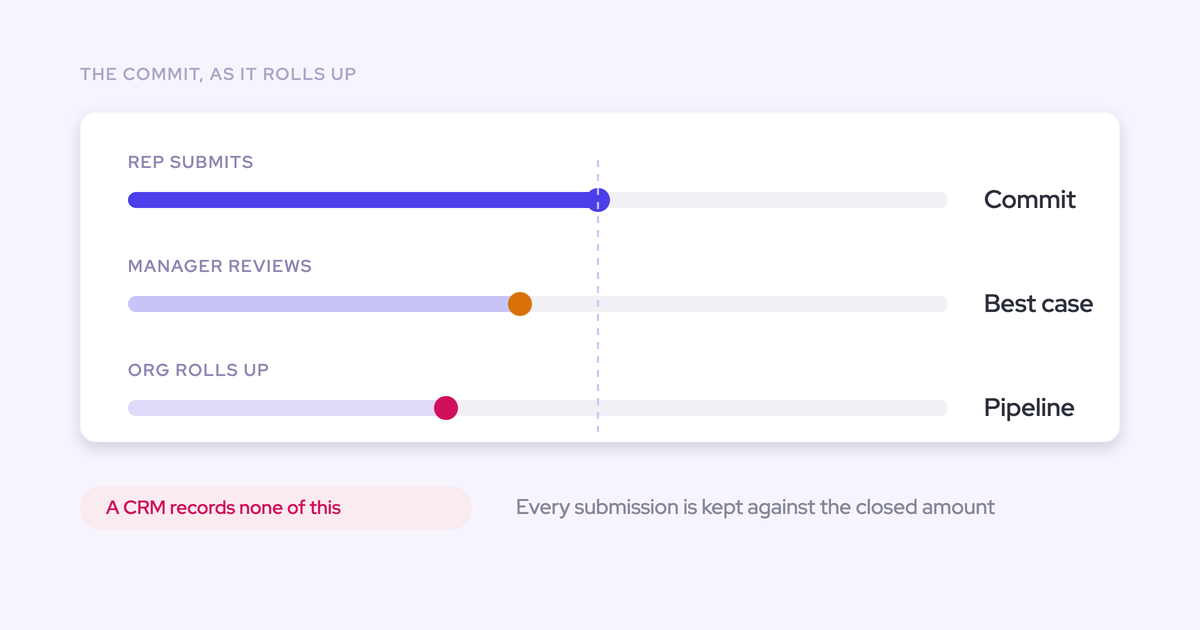
Store every submission against the final closed amount and you get variance per rep, per manager and per segment across consecutive quarters. The coaching conversation stops being an argument about opinions and becomes a track record.
One practice worth copying: lock every team leader's week-four call, publish it somewhere everyone can see, and score it at quarter end. Celebrate the teams that called it right, and don't publicly punish the ones that missed, because public punishment teaches people to protect themselves instead of forecasting honestly.
Why the best forecasting tool won't fix a missing cadence
Everything above assumes an operating cadence underneath it. If you don't have one, buying software will not create one.
"If you don't run an operating cadence, the best tool in the world won't help you. You have to look at forecasting as a holistic process that has various ingredients to make it successful."
A working weekly rhythm is unglamorous and fixed:
- reps update their pipeline by a set day, every week
- managers run deal reviews with their pod on a set day
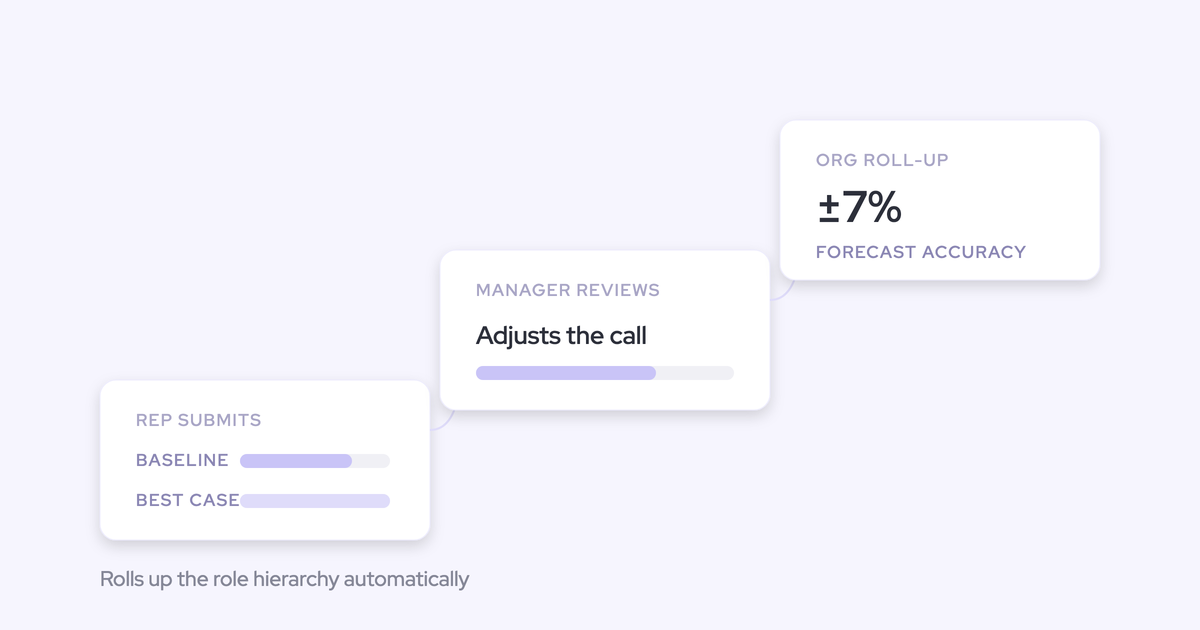
- reps submit a baseline and a best case, not one committed number
- managers review and adjust the roll-up
- the forecast call happens on the same day, with the same agenda and the same people
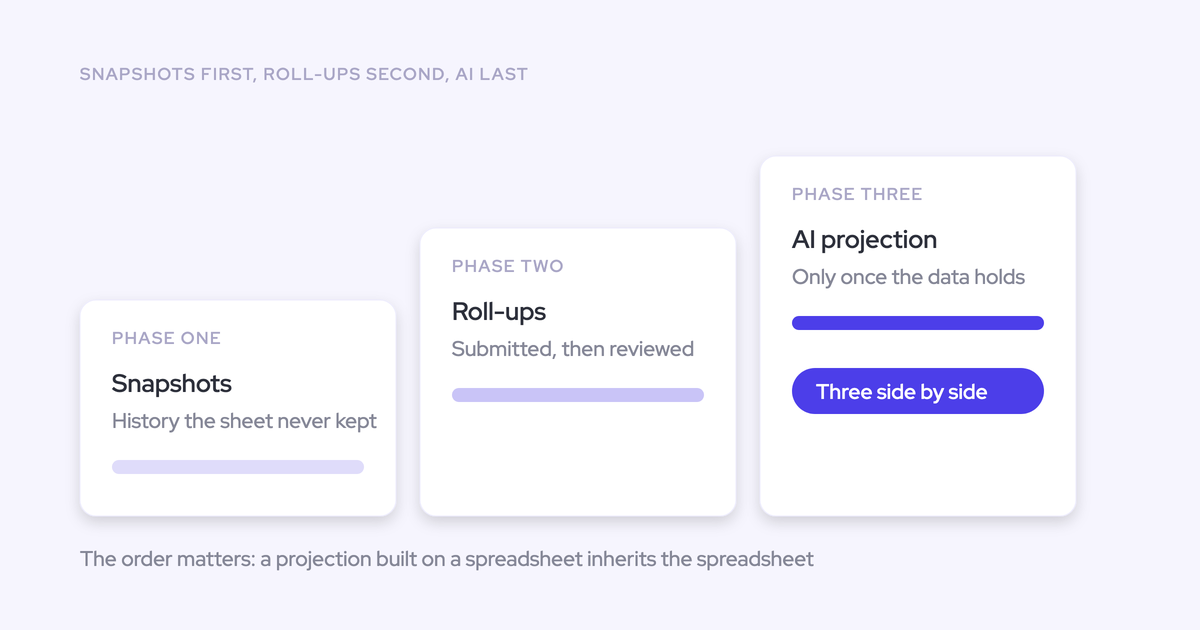
We say this to prospects before we show them anything, and we'd rather lose the deal than sell forecasting into a vacuum. Plenty of teams that ask us for better forecast accuracy don't have an accuracy problem yet, they have no baseline at all, because the deal records the forecast reads are missing the activity, the contacts and the conversation context that would make them assessable. If that's you, the data foundation comes first and forecasting comes last. Rolling it out in the other order is how forecasting tools end up shelved in year one.
How Weflow puts three forecasts side by side
Weflow is the Revenue AI Orchestration platform for sales, customer success, and RevOps teams. On the forecasting side, it runs three reads on the same pipeline in parallel rather than producing one number and hoping you believe it.
| Forecast | What it reads | What it tells you |
|---|---|---|
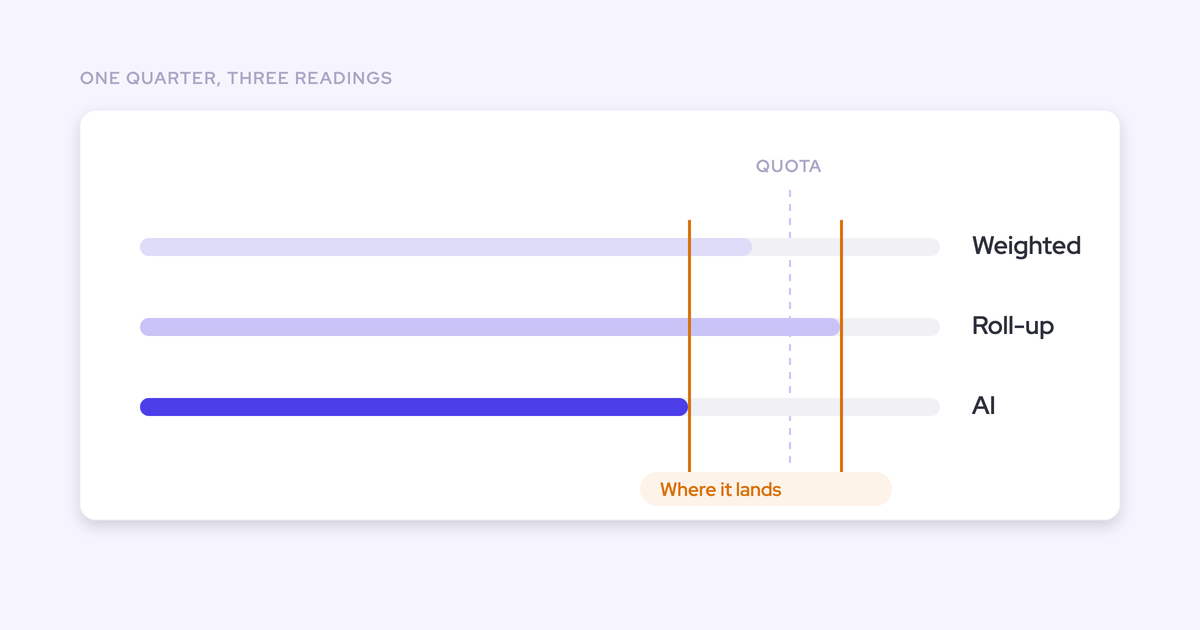
| Weighted forecast | Historic close rates by stage, applied to open pipeline | What your pipeline mathematically implies today |
| Rep and manager roll-up | A baseline and a best case per rep, tied to named opportunities, every version retained, manager overrides logged next to the original | What the people closest to the deals believe, and whether their call ever moved |
| AI projection | More than fifty deal-level signals and up to two years of history: velocity, communication cadence, whether a next meeting is booked, methodology health, seasonality, rep performance | A landing range built on how the deals are actually being worked |
The gaps between the three are the forecast call. Where they converge you have a credible corridor to take into a board conversation. Where they diverge you have a named rep, a named deal and a reason to inspect it.
The AI projection is worth one paragraph on its own, because it isn't stage probability with a new label. It reads deal behavior, so a large deal that's being poorly worked gets projected down even while it sits in a late stage with a confident close date. That's the read no rep and no weighting scheme will give you.

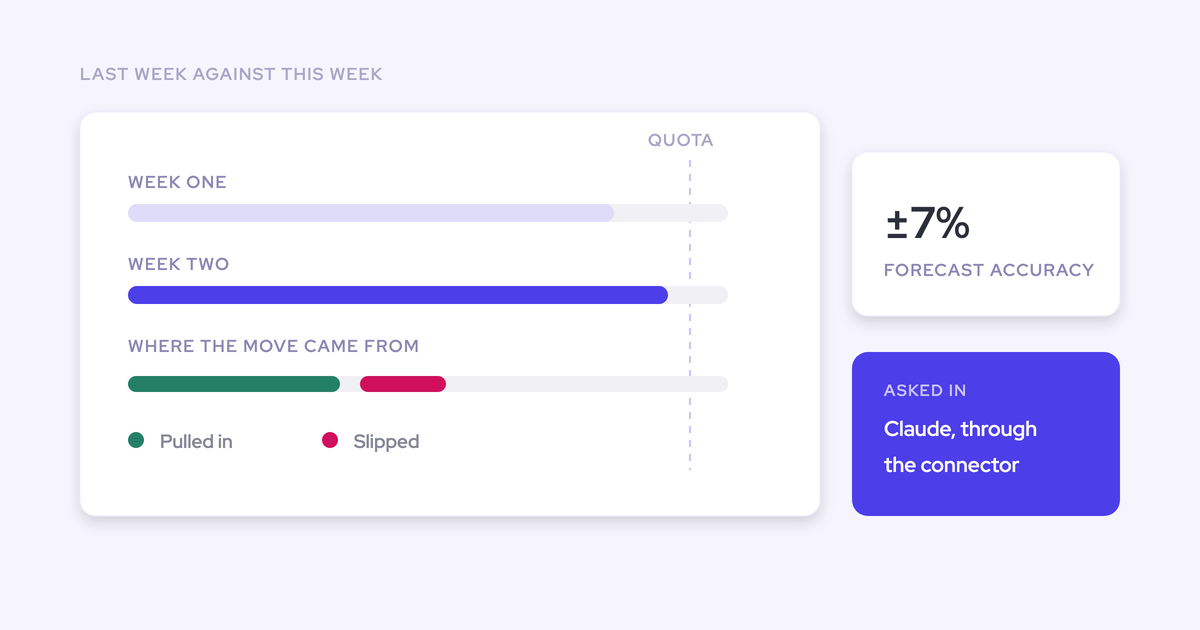
Around those three: warnings fire inside the submission screen, snapshots build the waterfall automatically, and every submission gets scored against what actually closed. Zeotap forecasts within about ±7% running this process.
"It's no longer third-party hearsay from reps or sales leaders. It's now proof in front of us – AI summaries that tell us we're not talking to the economic buyer, that we're single-threaded, whatever it might be."
— Scott Jones, SVP of GTM Revenue Intelligence & Enablement at KORE Wireless
One limit to know up front: everything else Weflow captures lands in native Salesforce objects, but forecast submissions, targets and roll-up data live in the Weflow application rather than as fields on the Salesforce record. If your rule is that reps only ever open Salesforce, the roll-up won't fit. The weighted forecast and the AI projection still will, because both run off CRM data with no rep input at all.
FAQ
Does fixing forecast accuracy mean replacing our forecasting tool?
Usually not first. What gets displaced first is the manual assembly: the Monday export, the ten rep sheets, the RevOps snapshot taken by hand to see what moved. Most teams we talk to are locked into a renewal anyway, and no CFO approves two forecasting contracts at once, so they start on the inputs layer (capture, conversation data, deal signals) and move the roll-up at renewal when they actually have the leverage.
How long until the forecast actually gets more accurate?
Longer than a trial, and we say so. Activity capture and conversation intelligence prove out inside a 14-day trial because they act on meetings and emails that are already happening. Forecasting needs enough forecast cycles to compare predicted against actual, which is closer to three months.
Weflow imports up to 12 months of historical Salesforce data by default and snapshots build automatically from day one, so pacing and waterfall views populate fast. Accuracy is still a quarter-shaped answer. One caveat: historical accuracy on custom fields depends on Salesforce field history tracking having been switched on before now.
What do reps have to do differently?
Less typing, not more. Emails, meetings and contacts sync automatically, and the deal signals are computed from that captured activity rather than from fields a rep maintains.
The one real change is the submission: a baseline and a best case on a fixed rhythm, selected as named opportunities rather than typed as a total. That's what makes the forecast review runnable deal by deal instead of a debate about a number.
Where does the data come from if our CRM is already unreliable?
From what actually happened rather than what someone remembered to log. Weflow Activity & Contact Capture writes emails, meetings and contacts into native Salesforce objects, and Weflow Conversation Intelligence extracts structured answers from calls into the Salesforce fields you nominate, including methodology fields.
This is also the honest reason forecasting comes last in a rollout. An AI prediction is only as good as the data foundation under it, and we learned that the hard way: we shipped a prediction forecast before we had automated Salesforce data capture, and it wasn't accurate enough.
How is an AI forecast projection different from stage probability?
Stage probability is a static number attached to a process step. Every deal in stage four carries the same 60%, whether it had a meeting yesterday or went dark in March.
A projection reads the deal: velocity over recent weeks, whether a next meeting is booked, engagement across the committee, methodology health, plus your own conversion history. It moves when the deal moves, and it returns a range rather than a single figure, which is why leaders actually argue with it instead of ignoring it.
Does this work for renewals and expansion, or just new business?
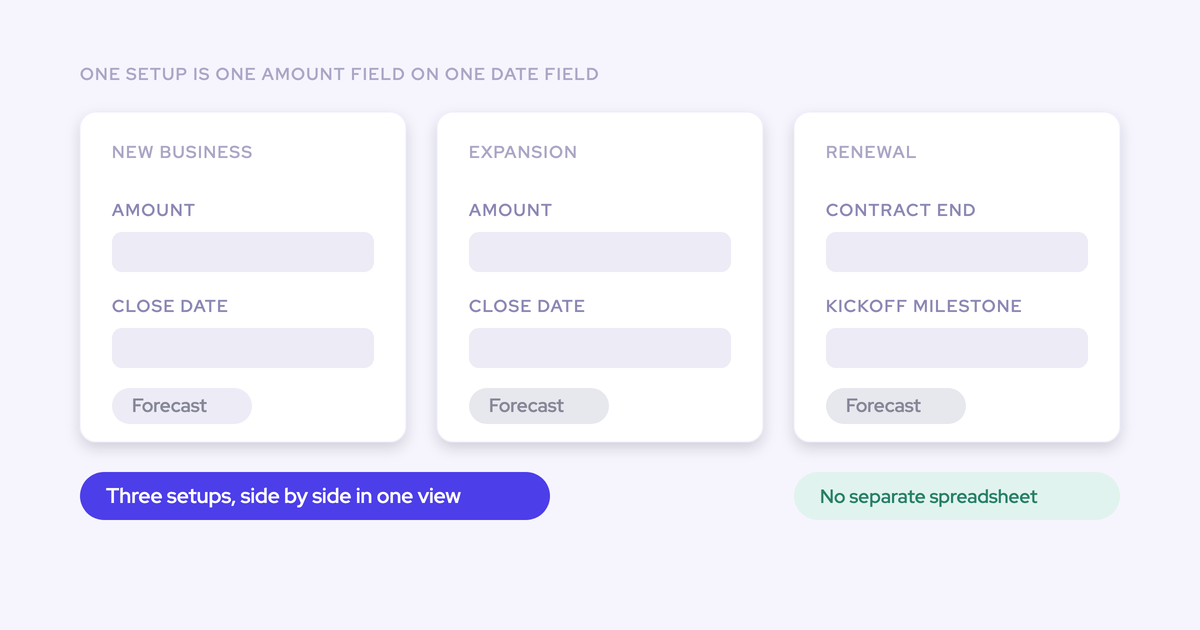
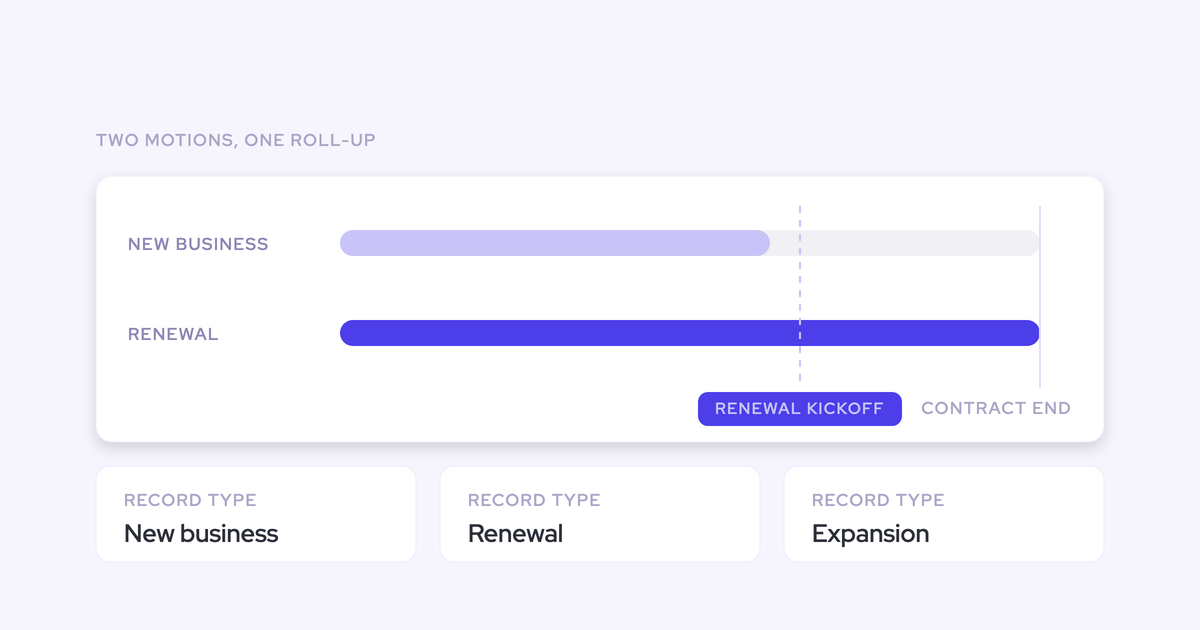
Renewals and expansion run as forecasts of their own. Weflow supports parallel forecast setups per motion, each with its own stages, cadence, quota and roll-up, plus a combined view, so when the quarter misses you can say which motion missed.
Renewals are indexed on the contract end date rather than a close date, with a configurable renewal kickoff milestone firing ahead of expiry, which is the fix for renewals becoming somebody's problem three weeks out.
Two honest notes. Booking-based SaaS models fit this cleanly; consumption forecasting is a harder problem and a weaker fit, because the usage doesn't sit on the opportunity. And a forecast setup places the full opportunity amount in the single period its date field falls into, so if you recognize one deal across two quarters, that split won't reproduce here.
If you're rebuilding the discipline rather than shopping for a tool, start with the process: The Ultimate Sales Forecasting Guide covers the cadence, the submission model and the accuracy metric, free.