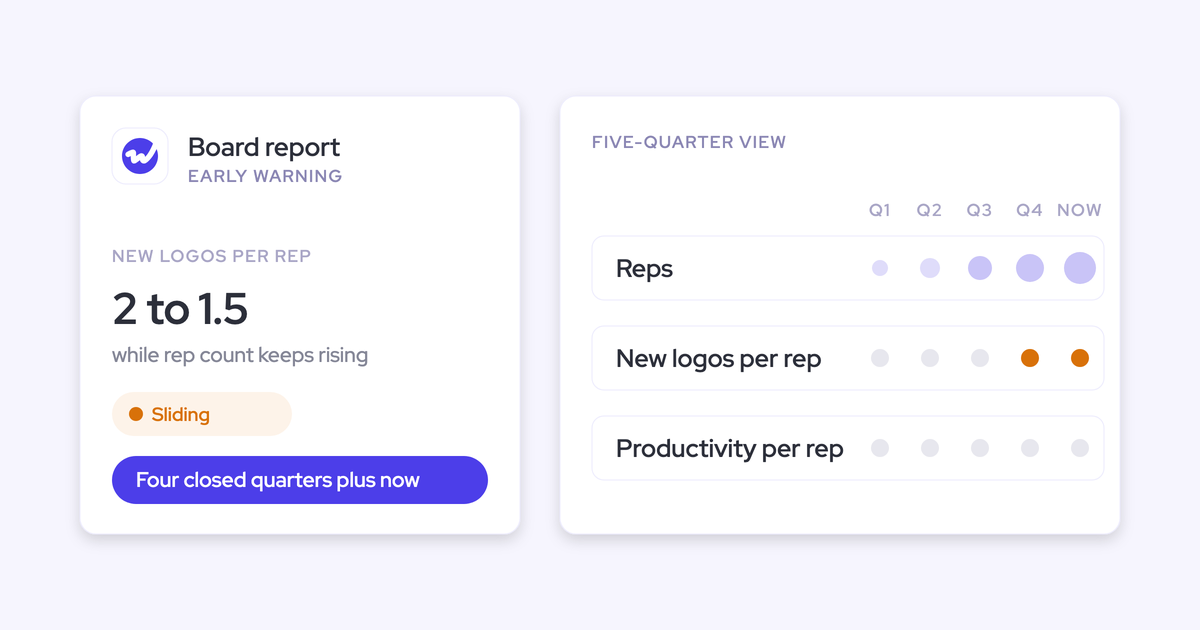

Any single quarter can be explained away, whether it's a slipped deal, a late signature or a one-off. That's why the sales section of your board pack works best when it puts three operating metrics on a five-quarter trend:
- Productivity per rep
- New logos per rep
- The split between new and existing business
Read together, they answer the question your board is really asking: is growth coming from a sales model that works, or just from adding heads?
Boards used to ask whether you hit the number. Now they want to know whether growth is efficient. A five-quarter line can answer that. As John McMahon told us on the RevOps Lab podcast, a trend like this is very hard to argue with.
The catch? You can only trend what you've stored, so your history starts this quarter, not the week the board asks for it.
A trend also only earns its place when you can open up the deals and reps that moved it, the way data-driven deal reviews in Weflow do, instead of relying on context that lives in reps' heads.
What is the five-quarter board report?
The five-quarter board report tracks a small set of go-to-market operating metrics across your last four closed quarters plus the one in progress.
Instead of judging any single quarter, the board reads the direction of the line to decide whether the sales model is working.
The structure comes from John McMahon, a board member at Snowflake and MongoDB and a five-time CRO. Here's how he put it:
"I like to see a five quarter report. So I like to see, you know, here's the last four quarters, and then here's what we're tracking for this quarter, or when it closes at the end of the quarter and you go to the board meeting, you can see the last five quarters. And those trends are really hard to argue with. Something's happening or something's not happening. You just can't lie. You can't get away from it. There's a story there."
McMahon's full set includes a few supporting metrics too (more on those below), but three carry the headline: productivity per rep, new logos per rep and the new vs existing split.
Why net new ARR and GRR leave your board asking why
Net new ARR, bookings and GRR usually lead the board pack because your CRM records them anyway. But they're lagging numbers. They tell the board what happened, not whether it'll happen again.
"You have your kind of lagging indicators that often I think are the number one metrics discussed in the board meeting. Right? Like, net new ARR, MRR, GRR, but they don't tell you why."
That's why board meetings so often turn into a debate about whether this quarter was a one-off. The lagging numbers can't settle it, but the operating metrics behind them can.
| What the board sees today (lagging) | What explains it (operating metrics) |
|---|---|
| Net new ARR | Productivity per rep, read beside headcount by ramp stage |
| Bookings against plan | New logos per rep and ASP on new business |
| GRR | Churn, trended beside the new vs existing split |
| Quarter attainment | Actual ramp time and the count of ramped reps |
Investors now reward efficient, predictable growth over growth at any cost, and quota attainment keeps sliding. As one revenue leader told us on a call, it's dropped:
"from the mid-50s historically to around forty percent now"
When attainment falls and headcount rises, bookings alone can't tell the board whether the model is working, and adding more metrics won't help either.
"Only measure what you can make a decision around. You don't need five hundred thousand dashboards."
The three operating metrics that carry the five-quarter report
Each metric answers a different board question. Together, they separate growth your sales model produced from growth you bought with headcount.
Productivity per rep: The one number that integrates everything
If you only track one metric, make it productivity per rep. It rolls hiring quality, ramp time, territory design and management coverage into a single line, and it tells you how the quarter is going before the bookings land.
"Obviously, productivity per rep is the most important metric of any metric, you know, that RevOps or any CRO or CEO could have, because if productivity per rep goes up, chances are almost everything on the financial statement's going to look good. It means that you probably made the quarter, probably beat the quarter. Productivity per rep goes down, chances are everything on the financial statement's going to look bad. You're going to have a bad quarter, bad board meeting. It's not gonna be very pleasant."
— John McMahon, board member at Snowflake and MongoDB, five-time CRO
A rising line means each rep is producing more, so new hires are adding leverage. A falling one means something in hiring, ramp, territory or management has broken, even if total bookings still look fine.
The aggregate is what the board sees. The version you'll actually act on breaks productivity per rep by region and second-line manager, which turns the metric into a resourcing decision.
New logos per rep: Your early warning that scaling is breaking
This metric tells the board whether new hires are going to pay off. If your rep count keeps climbing while new logos per rep flattens or slides, the new reps aren't producing the way the plan assumed.
McMahon's example is a slide from two new logos per rep toward one and a half. Treat that as the shape to watch, not a benchmark, because the direction matters more than the level.
In a subscription business, the damage compounds. New accounts are where future renewal and expansion revenue comes from, so fewer new logos per rep hurts next year's expansion as well as this year's bookings.
New vs existing business split: Spotting the drift off new accounts
Tracking how customers and dollars split between new and existing business shows whether your team is drifting away from new accounts.
You can hit the quarter on your existing base while the new-logo engine quietly stalls, and you won't feel it until a year later.
"And as a CRO, your lifeblood is the new accounts. If you don't get a constant flow of new accounts, chances are later in the year or next year, you're gonna probably not have your job."
— John McMahon, board member at Snowflake and MongoDB, five-time CRO
Track the split in both customer count and dollars. Dollars alone can hide the drift, since a few large expansions can mask a shrinking flow of new customers.
The supporting metrics that sit behind the three headline numbers
McMahon's full five-quarter set adds four supporting metrics, and each one explains why a headline number moved.
| Supporting metric | What it explains | Headline metric it backs |
|---|---|---|
| Headcount by ramp stage (hired, onboarded, ramping, ramped, attrition) | Whether you have the capacity the plan assumed | Productivity per rep, new logos per rep |
| Actual ramp time | How long new heads take to produce, against the plan | Productivity per rep |
| ASP on new and on existing business | Whether new deals are shrinking while expansion holds up | New vs existing split |
| Churn | Whether the base you're living off is holding | New vs existing split |
Headcount comes first, because no amount of productivity can make up for missing heads. McMahon opened every Monday revenue meeting with it:
"If I don't know that, even though I'm constantly trying to increase productivity, if I don't have the heads, I can continue to increase productivity, I'm still gonna miss the number."
— John McMahon, board member at Snowflake and MongoDB, five-time CRO
What your five-quarter trend looks like when scaling breaks
When scaling breaks, you'll see the pattern across five lines at once.
| Metric | Healthy five-quarter line | Scaling-is-breaking line |
|---|---|---|
| Rep count | Rising, with ramped reps rising behind it | Rising, with ramped reps lagging |
| New logos per rep | Flat or rising as heads are added | Sliding, as in McMahon's two toward one and a half |
| Existing share of dollars | Stable | Climbing quarter after quarter |
| New-business ASP | Stable or rising | Dropping |
| Productivity per rep | Flat or rising | Falling |
You can explain away any one of these lines on its own, but not all five together.
Together, they tell the board that this year's bookings are coming from the existing base and extra heads, while the new-logo engine underneath weakens.
The hit to next year's number is already locked in, but you've got a few quarters of warning, and that's exactly why the trend is worth showing.
How to present a bad five-quarter trend to your board
When the trend looks bad, share it early, keep the metrics fixed and let the narrative do the work. Changing the metrics to fit the story, or saving the bad news for the meeting, is how you lose the room.
- Keep the metric set identical every meeting, so the board can check your story against history.
- Change the narrative instead: the strategy you're arguing and the numbers you call out to support it.
- Surface the problem in the pre-read and in the written state-of-the-union summary that names the three to five issues you want advice on.
- Bring the cause and the intervention with the number, so a bad line arrives as a plan.
- Make sure nothing in the room is a surprise to anyone who's been engaged between meetings.
"you may have a different narrative for every meeting, depending on what story you want to tell or what strategy you're employing and how the numbers support that. And you can do that with narrative and the different things that you call out, but the metrics should largely be the same and consistently reported every meeting."
Good board members already know most of what's in the pack before it lands, which is why McMahon says he's mostly quiet in the room:
"But for the most part, I'm fairly quiet because I know what's going on, so none of this stuff is really a surprise to me because I've been involved in the company."
— John McMahon, board member at Snowflake and MongoDB, five-time CRO
So if the trend shocks your board, your operating cadence broke down long before the meeting started.
Which sales motions the five-quarter view fits
The five-quarter view works best for subscription businesses, where new logos feed future expansion. Other motions need a few adjustments:
| Motion or situation | How the five-quarter view applies | What to adjust or add |
|---|---|---|
| Enterprise subscription | Fits as described. Productivity is ARR produced per ramped rep | Read productivity with tenure so a strong half of the team doesn't hide the rest |
| Transactional / SMB | Fits, but the output number moves fast | Add the activity funnel behind productivity: prospect meetings, opportunities created, close rate. Keep that detail in operating reviews, not the board pack |
| Consumption-based | Fits, with bookings still setting the goal line | Track how much of each quarterly booking cohort realizes by month twelve |
| Multi-region | Fits only if every region uses one set of definitions | Lock definitions globally before you trend anything |
| Inconsistent history | Doesn't fit yet | Start the baseline this quarter and label reconstructed points |
Boards question bookings most often in consumption businesses, but bookings still matter there:
"I think it's a common misconception in consumption based models that bookings are sort of irrelevant or it just comes down to revenue because you're kinda booking a made up number, but that's not really the case, because that does inform essentially your forecast and understanding how much revenue do we expect and how do we track towards this."
For example, Socure aims for roughly ninety percent realization by month twelve per cohort, which gives a consumption board a trend it can hold bookings against.
You can only trend what you stored, so start now
If nobody captured a metric quarter by quarter, you can't trend it. When the board asks for five quarters of new logos per ramped rep and the history isn't there, there's not much you can do that week.
That's why this needs to be a standing habit, not a quarterly export. Your CRM records bookings anyway, but ramped-rep counts, the new vs existing split and per-rep productivity only exist historically if someone stored them at each quarter-end.
How to start a baseline without five quarters of history
Capture this quarter as your first point, rebuild only the history you can defend, and be upfront with the board about which points are rebuilt. Here's how:
- Lock your definitions of ramped rep, new logo and productivity per rep before you measure anything.
- Capture this quarter-end as the first point and freeze it.
- Reconstruct earlier quarters from closed-won records and HR headcount data, but only where the definitions held at the time.
- Label every reconstructed point in the pack, so nobody mistakes it for a frozen figure.
- Repeat the capture at every quarter-end on a fixed date, so the trend builds itself.
"One of the steps that I always skipped early on in my career that I wish I could go back and fix was not baselining things."
Your baseline may look thin at first, but a thin, honest baseline beats a full, contestable one. In four quarters, you'll have the real thing.
Should you freeze each quarter's numbers or keep them live?
Freeze the quarter-end figures the board saw, since those are what auditors and investors reconcile against, and use the live CRM for drill-down.
| Question | Frozen quarter-end snapshot | Live CRM view |
|---|---|---|
| What it is | The numbers as presented, fixed on a date | The current state of every record |
| Use | The five-quarter trend and the record of what you told the board | Drilling into which deals, reps and regions moved a number |
| Risk | Ages if definitions change later | Shifts as deals get reclassified, so last quarter's number changes |
| Who relies on it | The board, auditors, investors, diligence teams | The CRO, RevOps and frontline managers |
You'll want both: the frozen figure is your history, and the live view is how you explain it.
If you're picking the metrics to baseline this quarter, our B2B SaaS Metrics & Benchmarks Cheat Sheet lays out the definitions in one place.
How to run the five-quarter report across regions and teams
For the report to roll up to one number, every region needs to use the same definitions, the trend needs to drill down to where action happens, and every input needs a named owner.
Lock one definition of ramped rep and new logo
If regions define commit, stage, ramped or new logo differently, the trend won't roll up and anyone can contest it. Start by locking these:
- A ramped rep is defined by one tenure or attainment threshold, applied in every region.
- A new logo is a first contract with a customer that has never bought before, not a new subsidiary of an existing one unless you decide so globally.
- Commit means the same evidence threshold in every business unit.
- Each stage has the same entry criteria everywhere.
- Productivity per rep uses the same denominator, ramped reps, in every cut.
Drill from the board trend to region and second-line manager
If you can't trace a board metric down to a region and a second-line manager, it won't lead to action. Here's how to walk it down in four steps:
- Board trend: Productivity per rep is down two quarters running.
- Region: One region accounts for most of the decline.
- Second-line manager: Inside that region, one manager's teams carry it, often the ones with the most ramping reps.
- Initiative: A named fix with an owner, such as ramp support or a territory change, that you report back on next quarter.
This is also where you answer the board's slipping-deal questions about slipping deals. If the answer lives in reps' heads, the board has to wait while you go back to the team. If the activity and conversations are on the deal record, you can answer right there in the room.
Agree who owns each input across RevOps, finance and HR
Here's who typically owns each input:
| Input | Source system | Owner |
|---|---|---|
| Headcount by ramp stage, attrition | HR system | HR and talent acquisition |
| Actual ramp time | HR start dates plus CRM bookings | RevOps |
| Bookings, new logos, ASP | CRM | RevOps |
| Churn | CRM | RevOps with customer success |
| Reconciliation to the financials | Finance systems | Finance |
| Definitions and final assembly | The board pack | RevOps, signed off by the CRO |
Where Weflow feeds the inputs behind your five-quarter report
The five-quarter method usually breaks on its inputs: records typed in by reps, numbers exported by hand each cycle, and a board version that drifts from the CRM version. That's where Weflow comes in.
Weflow is the Revenue AI Orchestration platform for sales, customer success and RevOps teams. It's built for Salesforce, and everything it captures lands in your own Salesforce instance, not a vendor cloud.
That way, your reporting reads the same data your board numbers came from, so the two versions are less likely to drift apart.
Read rep capacity from Weflow Activity & Contact Capture
Productivity per rep tells you that output moved, and capacity tells you why. Weflow Activity & Contact Capture shows meetings per week, emails sent and replies received for each rep, compared across the team.
It's all calculated from captured activity, not from what reps remembered to log.
It's the view you want before approving your next hire. If productivity is falling and reps are well below the team's meeting average, you've got a pipeline or territory problem. If they're full, you've got a capacity problem.
"Are they at capacity? This is one crucial question. And what does it actually mean to be at capacity? Right? There's a rule of eight meetings per week. Is this still true if AI automates a lot of the repetitive workflows?"

Pull per-rep attainment into an AI assistant with Weflow's MCP connector
Weflow's MCP connector returns forecast data for a close-date period you choose, scoped to your own deals or your team hierarchy, with a per-rep breakdown for up to 25 owners. So instead of waiting for an export, you can just ask your AI assistant for attainment by rep.
- Where your org has configured targets in Weflow, they come back alongside the actuals, so gap to target resolves in one question.
- Since release 3.30, the connector also returns manager forecasts and manager targets.
- A question across a large org returns aggregate answers, and a question narrowed to a team returns the per-rep view.
For example, a CRO might ask:
Show me closed-won against target for each rep on my team for deals closing this quarter, and flag who's below half of target.
Send the Monday-morning board PDF with Weflow Agent Builder
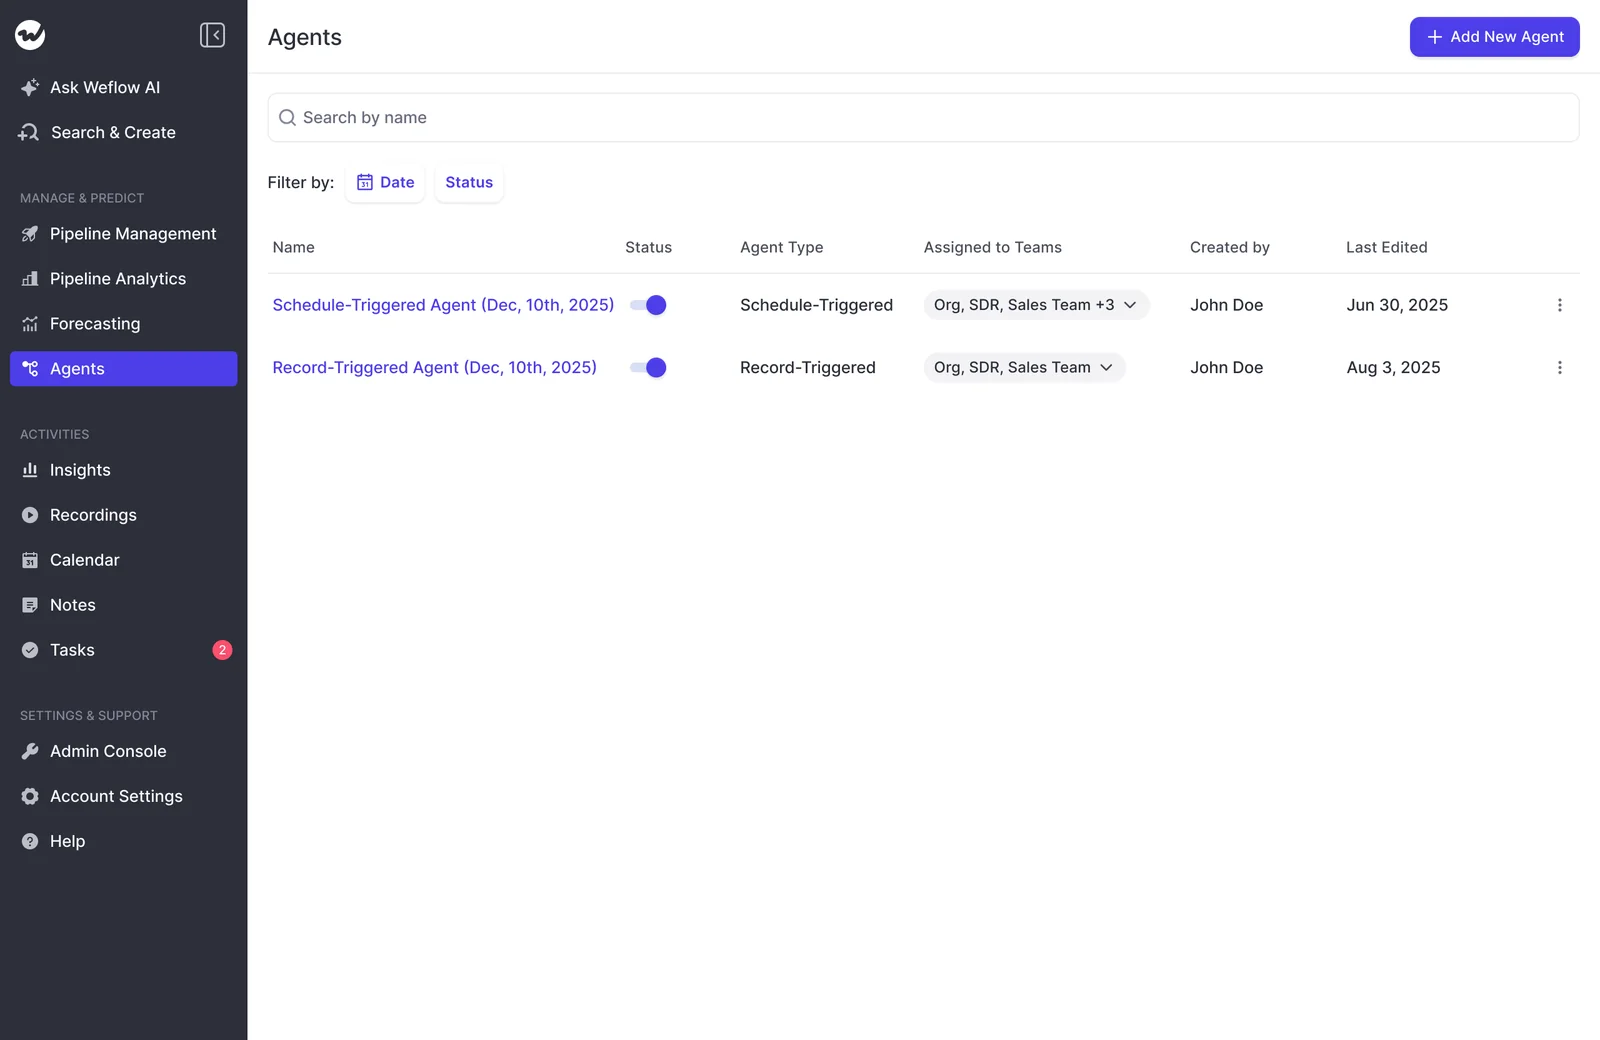
Most executives won't log into yet another tool to check on the business, so Weflow Agent Builder brings the report to them as a scheduled flow in four stages:
- Schedule: A trigger set to a day, time and timezone.
- Lookup: Reads Salesforce accounts, contacts, leads or opportunities live, with field-level filters, so a change made a minute ago is in the run.
- Prompt: An agent step runs your prompt over those records and the activities, emails, calls and transcripts attached to them.
- Delivery: Emails the result and attaches a PDF report.
A quick tip: Send it to yourself for a cycle and fine-tune the prompt before you add your CEO to the recipient list. You rarely get a second chance at a first impression with a technical executive.
What Weflow doesn't do for your board pack
Here's where you'll still need something else:
- Weflow doesn't freeze and store quarterly board-pack snapshots. Kluster does: it freezes packs as snapshots and keeps past packs for audit and due diligence.
- Some Clari customers use Clari's dashboards as the view they take into the board meeting. Weflow's output is the inbox report and the assistant answer, not a board-meeting dashboard.
- Headcount by ramp stage comes from your HR system, not Weflow.
- The five-quarter table itself is most likely still assembled in your BI tool or a sheet.
- Weflow has no read-only admin role. A CRO who wants a full view across the workspace gets full admin rights.
- Team-scope MCP queries follow your configured reporting hierarchy. With no hierarchy configured, they resolve to every active user in the company.
Common mistakes that undermine the five-quarter board report
Most five-quarter reports fall apart for one of three reasons: too many metrics, shifting definitions or hand-built history. Here's what to watch out for:
- Adding metrics instead of insight: The CRO gets surface area and still can't say what's happening.
- Changing the metric set to fit the story: The board loses the ability to check you against history, and stops trusting the story.
- Counting all heads instead of ramped reps: Productivity and new logos per rep fall every time you hire, and the trend reads as decline when it's ramp.
- Blending new and existing ASP: Healthy expansion hides shrinking new deals, which is the exact drift the report exists to catch.
- Rebuilding from exports each quarter: Definitions shift between cycles and the trend stops being comparable.
- Not snapshotting quarter-end: Last quarter's number changes after the meeting, and you can't show what you reported.
- Letting the board meeting be the surprise: Bad news in the room costs more credibility than the bad news itself.
McMahon sums up the first mistake well:
"they just keep getting more and more metrics and metrics and metrics, but they don't understand the insights of what those metrics really mean, and do I really need all these metrics?"
— John McMahon, board member at Snowflake and MongoDB, five-time CRO
FAQ: The five-quarter board report
How does the five-quarter report sit alongside NRR, marketing and CS sections?
The five-quarter metrics sit inside the sales section and answer questions about efficiency and team health.
Marketing keeps its own section on pipeline volume, quality and efficiency, while customer success covers retention, growth and health, which is where NRR lives. Organizing each section around the question it answers keeps the pack from getting bloated.
How much RevOps time does the five-quarter report take each quarter?
The first cycle takes the most work, since you're locking definitions and building the baseline. After that, each cycle gets easier. With a standing package reviewed on a fixed rhythm, the numbers already exist and everyone already has the context.
Teams that review KPIs monthly show up to the board pack reading results instead of chasing them.
Will the five-quarter board report stand up in due diligence?
Yes, as long as your definitions held steady across all five quarters, the quarter-end figures are frozen and any reconstructed points are labeled. Outsiders read bad data as a sign you can't run the business, and your valuation moves with that.
Treat the report as an always-ready asset, so you're not building your baseline the same quarter a buyer calls.