

How to Improve Sales Forecasting Accuracy
How to Improve Sales Forecasting Accuracy
Sales forecasting accuracy improves when you fix five things: your measurement approach, your forecasting process, your method selection, your CRM data quality, and your review cadence. This guide covers each area with specific frameworks, formulas, and implementation steps that RevOps teams at Salesforce-centric organizations can apply immediately.
Most forecasting problems aren’t methodology problems—they’re execution problems. You already know you should have clean pipeline data and consistent deal stages. The gap is usually in how you measure accuracy, how often you review, and whether your CRM actually reflects reality. We’ll cover all of it.
How to measure sales forecasting accuracy (MAPE formula)
Forecast accuracy is measured using Mean Absolute Percentage Error (MAPE). The formula:
Forecast Accuracy (%) = (1 − |Forecast − Actual| / Actual) × 100
Here’s a worked example: Your team forecasted $1M in closed-won revenue for Q1. Actual closed-won came in at $900K.
- Error = |$1,000,000 − $900,000| = $100,000
- Error Rate = $100,000 / $900,000 = 0.111 (11.1%)
- Forecast Accuracy = (1 − 0.111) × 100 = 88.9%
What’s a good accuracy rate?
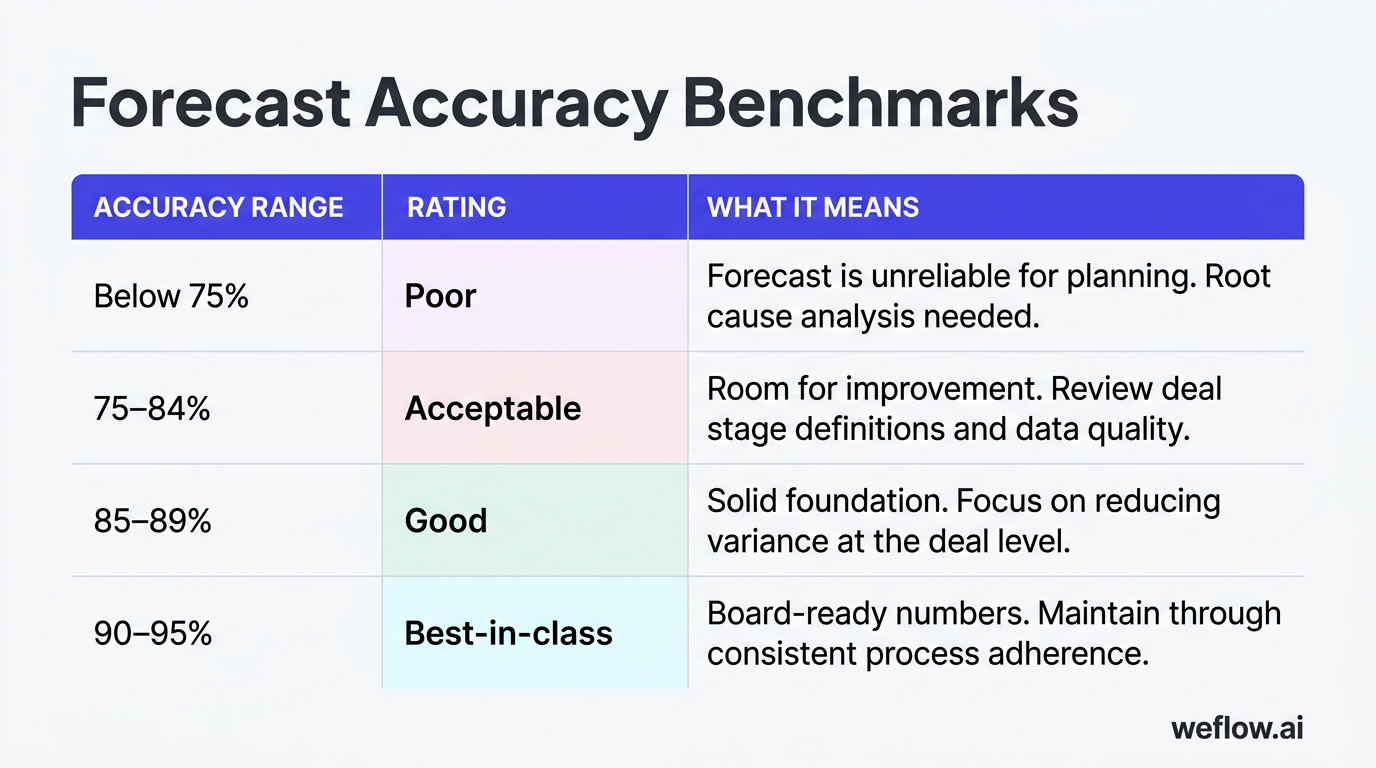
| Accuracy Range | Rating | What It Means |
|---|---|---|
| Below 75% | Poor | Forecast is unreliable for planning. Root cause analysis needed. |
| 75–84% | Acceptable | Room for improvement. Review deal stage definitions and data quality. |
| 85–89% | Good | Solid foundation. Focus on reducing variance at the deal level. |
| 90–95% | Best-in-class | Board-ready numbers. Maintain through consistent process adherence. |
If you’re below 85%, don’t start with methodology changes. Start with CRM data quality and deal stage hygiene—those are almost always the root cause.
How to define a sales forecasting process that drives accuracy
A forecasting process isn’t a weekly call where managers ask reps for their numbers. It’s a structured system that aligns goals, validates data, and produces reliable outputs. Three components matter most:
1. Align forecasting goals with market segments
Different segments behave differently. Enterprise deals have longer cycles and more stakeholders. Mid-market moves faster but with smaller deal sizes. SMB is high-volume and transactional. Your forecast model needs to reflect these differences.
For each segment, define:
- Average sales cycle length (use actual historical data, not estimates)
- Typical deal size range
- Stage-to-stage conversion rates
- Seasonal patterns
2. Choose between top-down and bottom-up forecasting
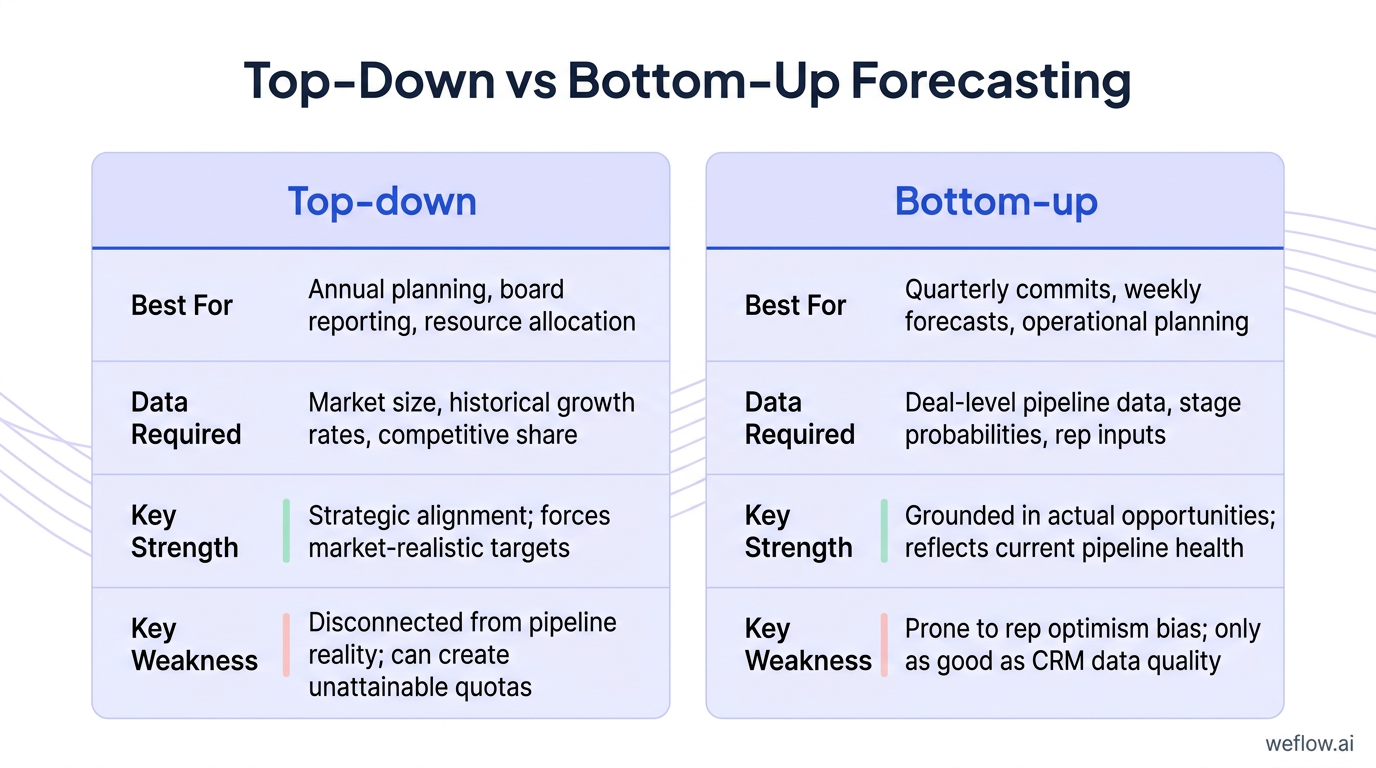
Most mature organizations use both approaches and reconcile the gap.
| Approach | Best For | Data Required | Key Strength | Key Weakness |
|---|---|---|---|---|
| Top-down | Annual planning, board reporting, resource allocation | Market size, historical growth rates, competitive share | Strategic alignment; forces market-realistic targets | Disconnected from pipeline reality; can create unattainable quotas |
| Bottom-up | Quarterly commits, weekly forecasts, operational planning | Deal-level pipeline data, stage probabilities, rep inputs | Grounded in actual opportunities; reflects current pipeline health | Prone to rep optimism bias; only as good as CRM data quality |
The gap between top-down and bottom-up is your coverage gap. If leadership needs $10M and bottom-up pipeline says $7M at weighted value, you have a $3M problem to solve—either through pipeline generation or conversion rate improvement.
3. Validate CRM data before every forecast
Run these checks before accepting any forecast number:
- Close dates in the past on open opportunities (stale deals)
- Opportunities in late stages with no recent activity
- Missing required fields (decision maker, next steps, budget range)
- Stage duration anomalies (deals stuck at a stage beyond normal cycle)
If you can’t trust the data, you can’t trust the forecast. There’s no way around this.
How to choose the right sales forecasting method
The right forecasting method depends on your data maturity and sales cycle complexity. Here are the four most common approaches for B2B sales organizations:
| Method | Best For | Required Data | Accuracy Risk |
|---|---|---|---|
| Historical forecasting | Stable, recurring revenue businesses with 2+ years of data | Historical closed-won by period, seasonality patterns | Assumes past performance predicts future; fails during market shifts |
| Pipeline forecasting | Deal-driven sales orgs with active pipeline management | Current pipeline value, weighted by stage probability | Garbage-in-garbage-out; depends entirely on CRM data quality |
| Opportunity stage forecasting | Organizations with well-defined, enforced sales stages | Stage definitions, historical stage-to-close conversion rates | Breaks when reps skip stages or definitions are inconsistent |
| Sales cycle length forecasting | Complex enterprise sales with long, predictable cycles | Average cycle length by segment, time-in-stage benchmarks | Volatile when cycle lengths vary significantly across deals |
Most B2B organizations should combine pipeline forecasting (for near-term commits) with historical analysis (for trend validation). If your sales cycles exceed 90 days, add sales cycle length modeling to catch deals that are trending faster or slower than expected.
For a deeper dive into each method, see our complete guide to sales forecasting.
How AI and machine learning improve sales forecast accuracy
AI-powered forecasting addresses the three biggest problems with human-generated forecasts: inconsistency, bias, and limited pattern recognition. Here’s what AI actually does:
AI-powered probability scoring
Instead of relying on static stage probabilities (Stage 3 = 40%), AI models calculate deal-specific win probability based on dozens of signals: activity patterns, stakeholder engagement, competitive mentions in calls, historical performance of similar deals. A Stage 3 deal with high engagement and champion activity might score 65% while another Stage 3 deal with stalled activity scores 15%.
[banner type="download" url="https://www.weflow.ai/content/the-ultimate-sales-forecasting-guide" text="The Ultimate Sales Forecasting Guide" subtitle="Run a weekly cadence that catches slippage before it hits the board deck." button="Get the guide"]
Pattern detection across historical deals
AI models analyze thousands of closed-won and closed-lost opportunities to identify patterns that predict outcomes. Common signals include: number of stakeholders engaged, presence of executive sponsor, time between activities, competitive displacement language, and pricing discussion timing.
Close-date prediction
AI predicts when deals will actually close—not when reps hope they’ll close. Models analyze historical deal velocity, current activity trajectory, and stage progression patterns to estimate realistic close dates. This reduces the close-date slippage that distorts monthly and quarterly forecasts.
Bias reduction
Reps are optimistic. Managers are either optimistic (sandbaggers) or pessimistic (over-committers). AI doesn’t have these tendencies. It weighs evidence consistently across all deals regardless of who owns them.
The impact: According to Aberdeen Group research, companies using automated forecasting tools improve accuracy by 20% or more compared to manual methods. The gains come primarily from better deal-level probability scoring and reduced human bias.
AI forecasting doesn’t replace judgment—it provides a data-driven baseline that humans can then adjust with context the model doesn’t have (like a verbal commitment from a champion).
Build a weekly, monthly, and quarterly forecast review cadence
Forecasting isn’t an event—it’s a rhythm. The right cadence catches problems early and keeps everyone aligned on pipeline reality.
| Frequency | Activity | Participants | Output |
|---|---|---|---|
| Weekly | Pipeline review: inspect deals in commit/best case, identify risk, update close dates | Front-line managers, reps (by team) | Deal risk flags, updated commit amounts, action items for at-risk deals |
| Monthly | Forecast roll-up: aggregate team forecasts, compare to target, analyze variance | Sales leadership, RevOps, FP&A | Variance analysis (forecast vs. actual), coverage gap identification, resource reallocation decisions |
| Quarterly | Strategic forecast: long-range planning, board reporting, marketing alignment | CRO/VP Sales, CMO, RevOps, executive team | Board-ready forecast, resource planning for next quarter, pipeline generation targets |
Making weekly pipeline reviews effective
The weekly call is where forecast accuracy is won or lost. Most teams run these poorly: managers ask reps for updates, reps give optimistic answers, nothing gets documented. Here’s how to fix it:
- Review data before the call, not during. Managers should pre-identify deals with stale activity, slipped close dates, or stage anomalies.
- Focus on changes, not status. What moved? What’s stuck? What’s at risk?
- Require evidence for commits. A deal isn’t in commit unless there’s a documented verbal or written commitment from the buyer.
- Update Salesforce in real-time. If close dates or amounts change during the call, update them immediately—not later.
How to fix CRM data quality issues that wreck your forecast
CRM data quality is the number-one killer of forecast accuracy. You can have the most sophisticated forecasting methodology in the world, but if your Salesforce data is incomplete or stale, your forecast will be wrong.
Common data quality problems
- Missing close dates: Opportunities without close dates can’t be forecasted by period. They’re invisible to time-based reports.
- Stale deals: Opportunities with close dates in the past that haven’t been updated. These inflate pipeline reports and distort coverage calculations.
- Inconsistent stage definitions: If one rep thinks Stage 3 means “demo scheduled” and another thinks it means “demo completed,” your stage-based probabilities are meaningless.
- Missing activity data: Deals with no logged calls, emails, or meetings. Without activity context, you can’t assess whether a deal is progressing or stalled.
- Incomplete required fields: Missing decision maker, budget range, or next steps. These gaps hide deal risk.
Automation as the solution
Manual data entry is the root cause. Reps don’t have time to log every email, meeting, and call. They update Salesforce at the end of the week (or month), by which point details are lost and the data is already stale.
The solution is automated data capture. Tools like Weflow automatically log emails, meetings, and calls to the appropriate Salesforce records—without reps doing anything. Activity data flows into CRM in real-time, giving managers an accurate picture of deal engagement.
With automated activity capture:
- Activity completeness goes from 30–50% (typical with manual entry) to 95%+
- Deal risk becomes visible earlier (stalled activity is flagged automatically)
- Reps save 5–10 hours per week on admin work
- Forecast inputs are based on actual behavior, not recollection
How close date discipline improves forecast reliability
Close-date slippage is the silent killer of forecast accuracy. A deal forecasted to close in March that slips to April doesn’t just affect March’s numbers—it cascades through your entire quarterly forecast and destroys credibility with leadership.
Why close dates slip
- Optimism bias: Reps set close dates based on when they hope deals close, not when they’re likely to close based on evidence.
- No buyer commitment: The close date reflects the rep’s timeline, not the buyer’s. Without a documented buyer commitment to timeline, close dates are fiction.
- Process delays: Legal review, procurement, budget cycles—these take longer than expected and reps don’t update accordingly.
- Set-and-forget: Close dates are set at opportunity creation and never updated as the deal evolves.
How to track close-date slippage
Measure slippage rate: the percentage of opportunities where the close date was pushed out from the original forecast. Track this by rep, by segment, and by quarter.
Slippage Rate = (Opportunities with Close Date Pushed / Total Opportunities in Forecast) × 100
A slippage rate above 30% indicates a systemic problem—either with deal qualification, buyer engagement, or sales process adherence.
Rules for close-date hygiene
- Close dates must be evidence-based. If there’s no documented buyer commitment to a timeline, the close date should reflect historical averages for similar deals—not rep optimism.
- Update immediately when evidence changes. If a buyer says “we’re pushing to next quarter,” update the close date that day—not at the end of the month.
- Review close dates weekly. Any deal in commit with a close date in the current period should be reviewed weekly for timeline validity.
- Track close-date changes. Salesforce field history should track every close date modification. Waterfall reports (which show how forecast changed over time) make slippage visible.
Internal and external factors that impact sales forecast accuracy
Forecasting doesn’t happen in a vacuum. Both internal changes and external market shifts affect your numbers. Build these factors into your forecasting process:
| Factor | How It Impacts Forecasts | What to Monitor |
|---|---|---|
| Staffing changes | New reps ramp slowly; departing reps leave orphaned pipeline | Rep tenure distribution, ramp-to-quota timelines, attrition rate |
| Territory realignment | Disrupts relationships and extends sales cycles during transition | Realignment timing, affected pipeline value, historical realignment impact |
| Pricing or policy changes | Can accelerate (if prices rising) or stall (if buyers wait for new terms) deals | Effective date of changes, pipeline in negotiation stage |
| Product launches | New products create demand but also pause cycles as buyers evaluate options | Launch timing, training readiness, competitive positioning |
| Economic conditions | Budget freezes, longer approval cycles, increased deal scrutiny | Industry indicators, customer sentiment, deal cycle trends |
| Seasonality | Predictable patterns in buyer behavior (Q4 budget flush, summer slowdowns) | Historical close rates by month, industry-specific patterns |
| Regulatory changes | Compliance requirements can create urgency or delay decisions | Regulatory calendar, affected customer segments |
| Competitive landscape shifts | New entrants or aggressive pricing from competitors affects win rates | Competitive mentions in deals, win/loss ratio changes, displacement trends |
Build a “factor adjustment” step into your quarterly forecasting process. Before finalizing numbers, review which factors have changed and adjust accordingly—don’t pretend next quarter will look exactly like last quarter.
[banner type="download" url="https://www.weflow.ai/content/sales-forecasting-cheat-sheet" text="Sales Forecasting Cheat Sheet" subtitle="One-page reference to tighten pipeline hygiene and hit 90% accuracy this quarter." button="Get it free"]
How to align sales and marketing forecasts
Sales doesn’t forecast in isolation. Marketing pipeline generation directly affects sales’ ability to hit numbers. Misalignment between sales and marketing forecasts creates finger-pointing and missed targets.
Shared pipeline definitions
Sales and marketing must agree on:
- What counts as pipeline: When does an MQL become an opportunity? What’s the handoff criteria?
- Stage definitions: Marketing needs to understand what each sales stage means to forecast pipeline progression.
- Attribution windows: How long does marketing get credit for pipeline generation? 30 days? 90 days?
Joint review sessions
Monthly, sales and marketing leadership should review together:
- Pipeline generated vs. target
- Conversion rates from MQL to opportunity to closed-won
- Campaign performance and impact on pipeline quality
- Gaps between marketing’s pipeline forecast and sales’ coverage needs
Unified reporting tools
Both teams should work from the same Salesforce reports and dashboards. If marketing is reporting from a MAP and sales is reporting from CRM, you’ll get different numbers—and the resulting debates waste everyone’s time.
A proper pipeline analysis framework gives both teams visibility into the same data, reducing friction and enabling faster course corrections.
How Weflow streamlines sales forecasting in Salesforce
Weflow is a Salesforce-native revenue AI platform that addresses the root causes of forecast inaccuracy: incomplete data, stale deal information, and lack of real-time pipeline visibility.
Key capabilities for forecasting teams:
- Collaborative forecasting: Roll up forecasts by team, segment, and region with real-time visibility into changes. See who updated what and when.
- Waterfall reporting: Track how your forecast evolved from start of quarter to close. Identify where slippage occurred and which categories (commit, best case, pipeline) were most volatile.
- Quarterly predictions: AI-powered forecast predictions based on historical patterns, current pipeline health, and deal-level signals.
- Pipeline visibility: Inspect deals with complete activity context—every email, meeting, and call logged automatically. Spot stalled deals before they miss.
- Automated activity tracking: Emails, meetings, and calls sync to Salesforce records automatically. No rep action required. Activity completeness improves from 30–50% to 95%+.
Weflow deploys in weeks, not quarters, and writes directly to native Salesforce objects—no additional database or integration complexity.
Sales forecasting accuracy checklist: your next steps
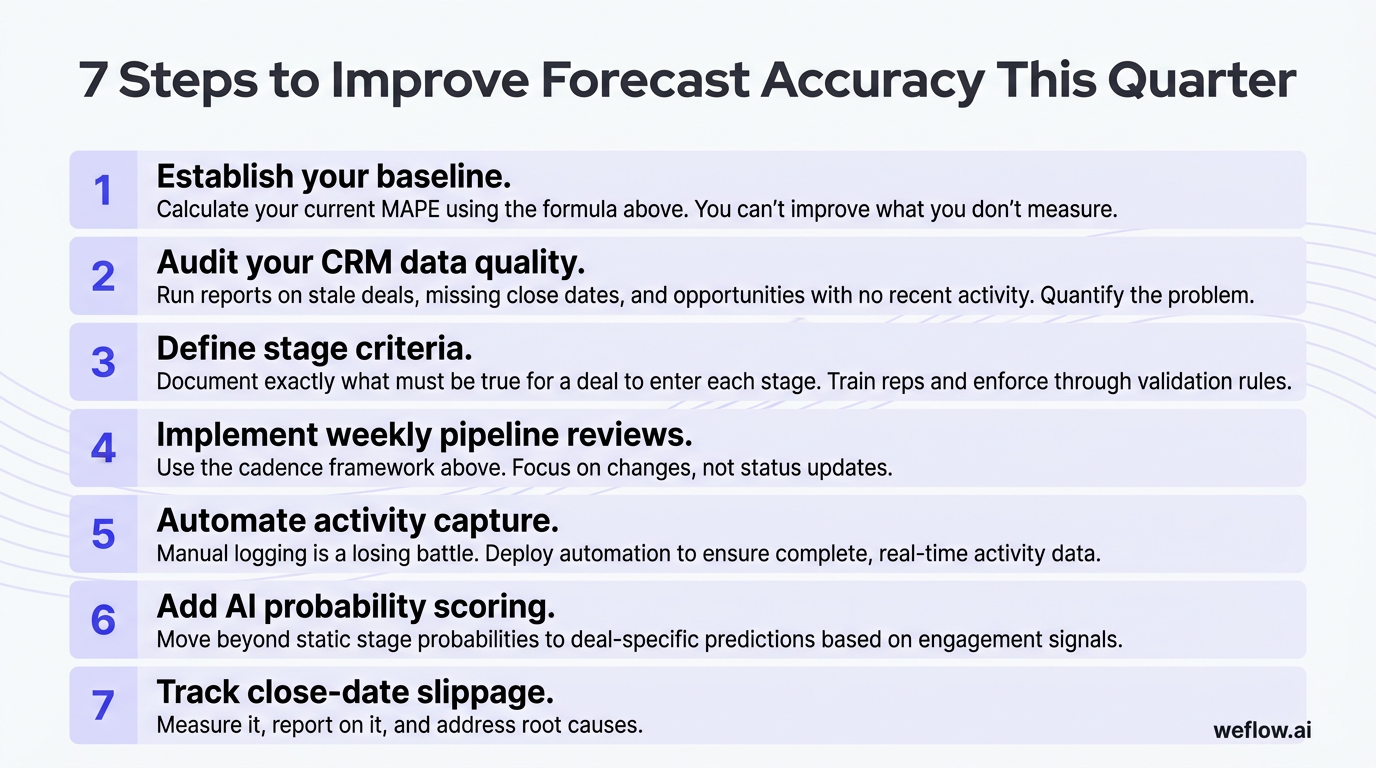
Here’s how to start improving your forecast accuracy this quarter:
- Establish your baseline. Calculate your current MAPE using the formula above. You can’t improve what you don’t measure.
- Audit your CRM data quality. Run reports on stale deals, missing close dates, and opportunities with no recent activity. Quantify the problem.
- Define stage criteria. Document exactly what must be true for a deal to enter each stage. Train reps and enforce through validation rules.
- Implement weekly pipeline reviews. Use the cadence framework above. Focus on changes, not status updates.
- Automate activity capture. Manual logging is a losing battle. Deploy automation to ensure complete, real-time activity data.
- Add AI probability scoring. Move beyond static stage probabilities to deal-specific predictions based on engagement signals.
- Track close-date slippage. Measure it, report on it, and address root causes.
Ready to see how Weflow can improve your forecast accuracy? Get a demo.
Frequently asked questions
How do you measure sales forecasting accuracy?
Use Mean Absolute Percentage Error (MAPE): Forecast Accuracy (%) = (1 − |Forecast − Actual| / Actual) × 100. Compare your forecasted revenue against actual closed-won for each period. Track this metric monthly and quarterly to identify trends.
What is a good sales forecast accuracy rate?
85% or higher is considered acceptable for most B2B organizations. Best-in-class teams achieve 90–95% accuracy. Below 75% indicates fundamental problems with data quality, stage definitions, or forecasting process that need immediate attention.
Why are my sales forecasts always wrong?
The most common causes are poor CRM data quality, inconsistent stage definitions, and rep optimism bias. If activity data is incomplete, close dates aren’t evidence-based, or stage criteria aren’t enforced, your inputs are unreliable—and so is your output. Start by auditing data quality and pipeline hygiene.
How does AI improve sales forecasting accuracy?
AI calculates deal-specific win probabilities based on engagement signals, historical patterns, and deal attributes—replacing static stage probabilities. It also predicts realistic close dates, identifies at-risk deals early, and reduces human bias. Companies using AI-powered forecasting typically improve accuracy by 20% or more.
What is the best sales forecasting method for B2B companies?
Most B2B organizations should combine pipeline forecasting (for near-term operational planning) with historical trend analysis (for validation and pattern detection). For complex enterprise sales with cycles over 90 days, add sales cycle length modeling to catch velocity anomalies. The right approach depends on your data maturity and deal complexity.
How often should you review your sales forecast?
Weekly at the manager level for deal-by-deal pipeline inspection. Monthly at the leadership level for variance analysis and resource allocation. Quarterly for strategic planning and board reporting. The weekly cadence is where accuracy is built—monthly and quarterly reviews just aggregate what’s already happened.
What role does CRM data quality play in forecast accuracy?
CRM data quality is the single biggest factor in forecast accuracy. If activity data is incomplete, close dates are stale, or stage definitions aren’t followed consistently, no methodology can produce accurate results. Automated activity capture and enforcement of data hygiene standards are prerequisites for reliable forecasting.
How do you align sales and marketing forecasts?
Start with shared definitions: agree on what counts as pipeline, when opportunities are created, and how attribution works. Hold monthly joint reviews to compare pipeline generated vs. target and analyze conversion rates. Both teams should work from the same Salesforce reports to eliminate discrepancies.


.png)


