
How to Create a Sales Report: Steps, Metrics, and Examples
Learn how to create a sales report with key steps, metrics, examples, and common reporting mistakes.





What is a sales report (and why does it matter)?
A sales report is a document that summarizes your team's sales activities and results over a specific period—typically a week, month, or quarter. It translates raw CRM data into a format that helps RevOps leaders, sales managers, and executives make decisions about pipeline, forecasting, and team performance.
Sales reports answer the questions that drive revenue operations: How much did we close? Where's the pipeline stuck? Are we on track for the quarter? Without reliable reports, these questions get answered with gut feel instead of data—and gut feel doesn't scale.
For mid-market and enterprise B2B organizations running Salesforce, sales reports serve three functions:
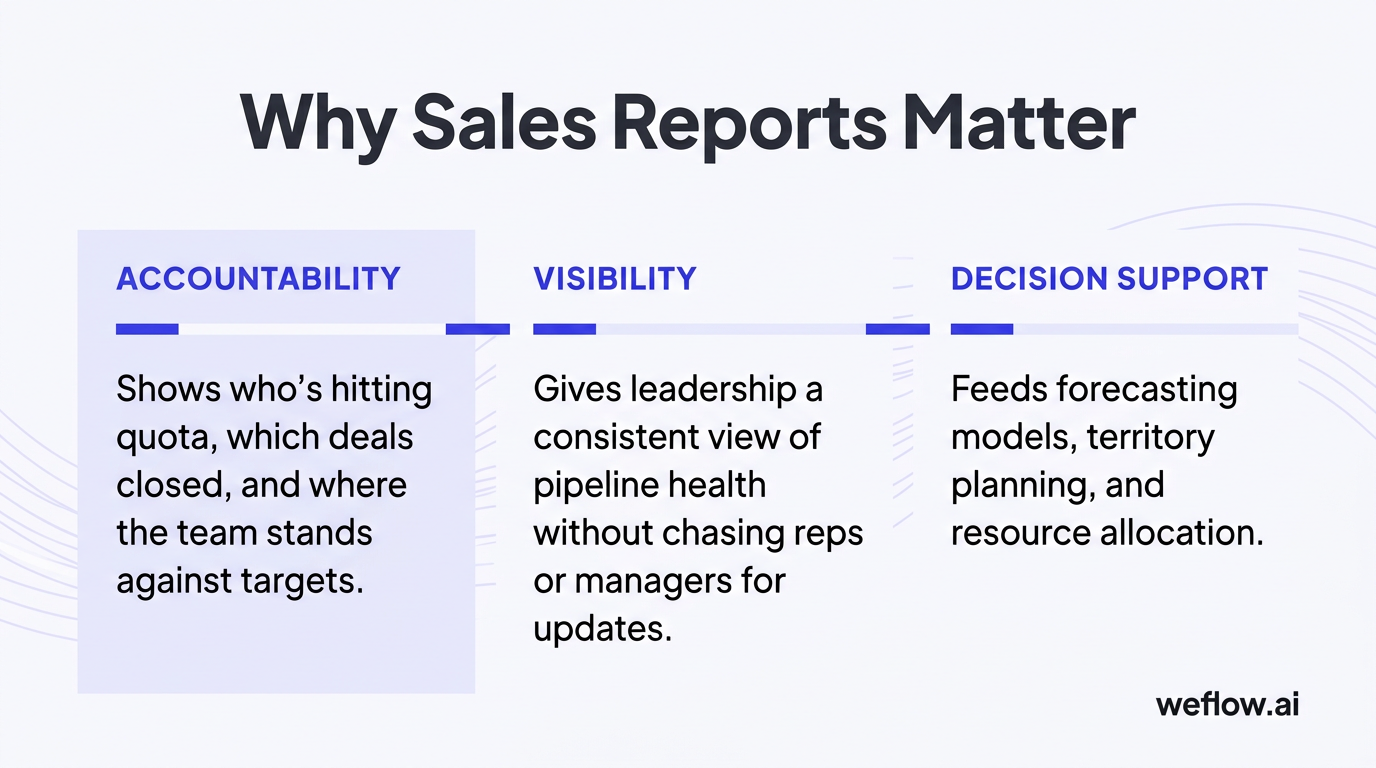
Accountability: Reports show who's hitting quota, which deals closed, and where the team stands against targets.
Visibility: Leadership gets a consistent view of pipeline health without chasing reps or managers for updates.
Decision support: Accurate reports feed forecasting models, territory planning, and resource allocation.
The quality of your sales reports depends on the quality of your Salesforce data. If activity capture is incomplete or reps aren't updating deal stages, your reports will reflect that—and so will your forecasts.
What should a sales report include? Key metrics and KPIs
Every sales report should include the metrics that map to its stated goal. A weekly pipeline review needs different data than a quarterly board update. But at minimum, most sales reports should cover:
Total revenue: Closed-won revenue for the reporting period, compared against target.
Deals won and lost: Count and value of opportunities that closed, with win/loss breakdown.
Pipeline value: Total value of open opportunities by stage, with movement since last report.
Conversion rates: Stage-to-stage conversion showing where deals progress or stall.
Average deal size: Mean and median deal values, tracked over time for trend analysis.
Sales cycle length: Average days from opportunity creation to close, by segment or rep.
Activity metrics: Calls, emails, and meetings logged—if your activity capture is reliable.
Forecast vs. actual: How the committed forecast compared to what actually closed.
The key is matching metrics to audience. A CRO reviewing the monthly number cares about forecast accuracy and pipeline coverage. A sales manager running a weekly team meeting cares about deal slippage and rep activity. Choose five to seven metrics per report—more than that obscures the signal.
4 sales reporting challenges that undermine your data
Most sales reporting problems aren't report problems—they're data problems. Here's where they start.
Inaccurate CRM data skews every report you build
If reps don't update Salesforce, your reports reflect fantasy instead of reality. Stage progression gets stale. Close dates slip without anyone noticing. Activity data is incomplete. The result: pipeline reports that overstate coverage, forecasts that miss by double digits, and leadership that stops trusting the numbers.
This isn't a discipline problem—it's a workflow problem. Reps don't update Salesforce because it takes time they'd rather spend selling. The fix isn't more process enforcement. It's automating data capture so the right information flows into Salesforce without manual entry.
Manual data collection wastes hours and introduces errors
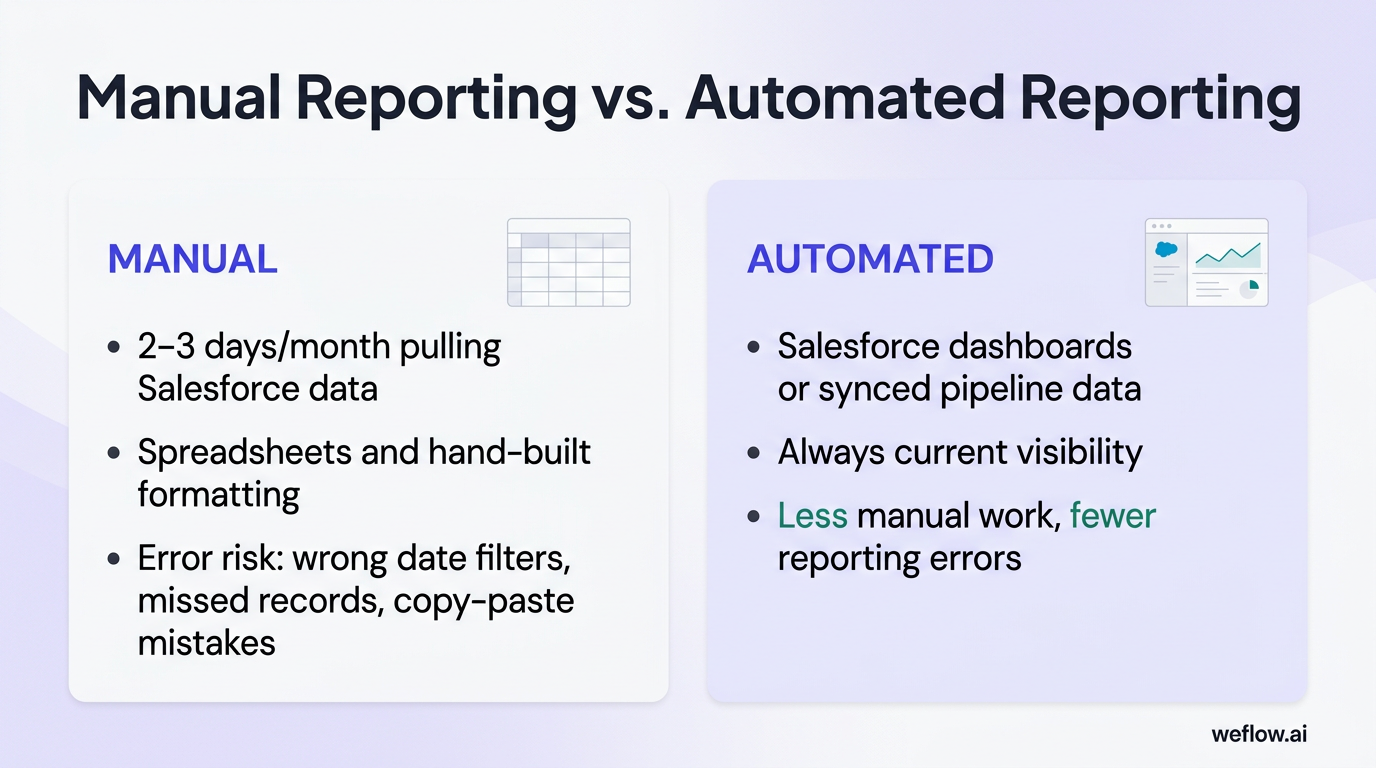
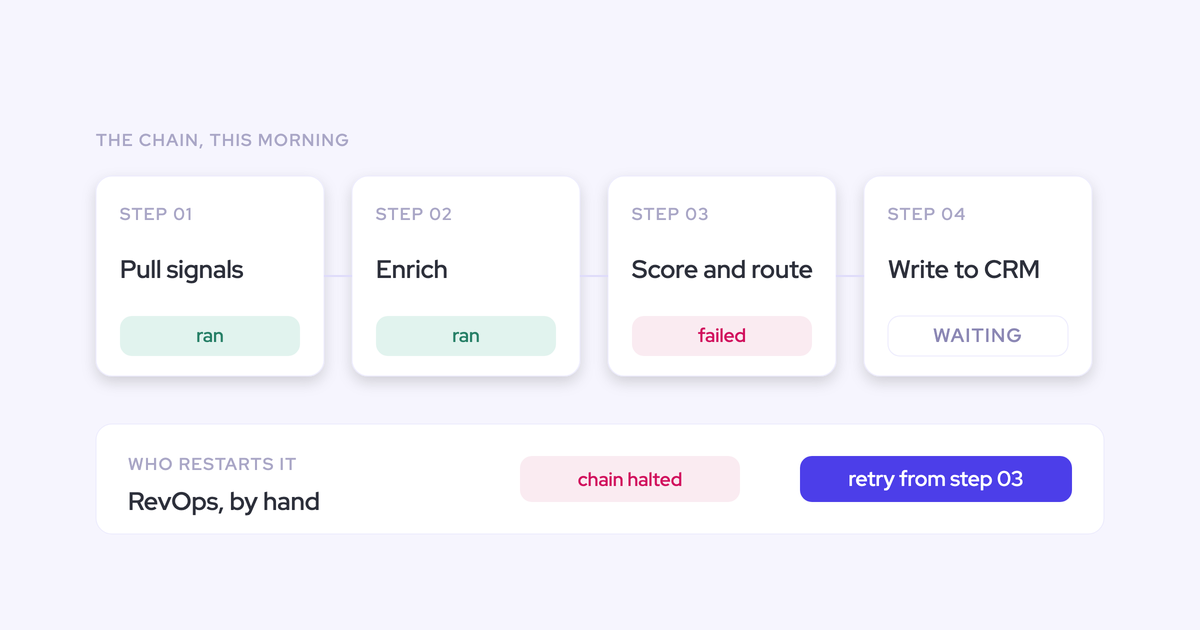
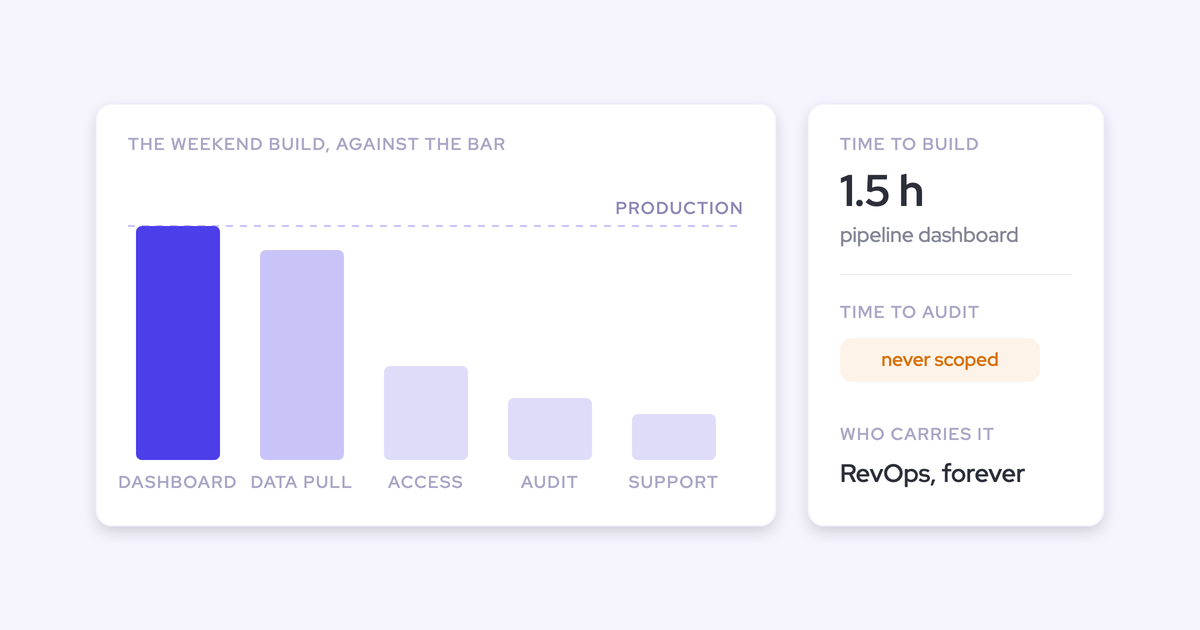
RevOps teams at mid-market companies often spend two to three days a month pulling data from Salesforce, formatting it in spreadsheets, and building reports by hand. At enterprise scale, this becomes a full-time role. Every manual step introduces error risk: wrong date filters, missed records, copy-paste mistakes.
Manual collection also means reports are always stale. By the time leadership reviews the monthly pipeline report, the data is a week old. Real-time visibility requires automation—either through Salesforce dashboards or tools that sync pipeline data continuously.
Too many metrics obscure the insights that drive decisions
Adding more metrics doesn't make a report more useful. It makes it harder to read. When a sales report includes 20 KPIs, leadership scans for the one or two numbers they care about and ignores the rest. Meanwhile, the signal gets lost in the noise.
Effective reports are opinionated. They highlight what matters for this audience at this cadence. A weekly pipeline report might show three metrics: pipeline created, pipeline moved to commit, and deals at risk. A monthly performance report might add win rate, average deal size, and forecast accuracy. Resist the temptation to include everything just because you can.
Turning raw sales data into actionable analysis
The hardest part of sales reporting isn't pulling the data—it's interpreting it. A report that says "Pipeline is $4.2M" is less useful than one that says "Pipeline is $4.2M, down 18% from last month, with 60% concentrated in two enterprise deals that have been in stage 3 for over 30 days."
Context transforms data into insight. That means adding benchmarks (prior period, target, industry average), highlighting anomalies, and providing written analysis that explains what the numbers mean. The report should answer "so what?" before the reader has to ask.
5 reasons sales reporting drives better revenue decisions
Sales reports aren't just documentation—they're decision-making infrastructure. Here's what good reporting enables:
Forecast accuracy improves. When reports surface deal risk early—stalled opportunities, missing next steps, declining engagement—managers can intervene before the quarter ends. Teams that inspect pipeline weekly catch forecast gaps that monthly reviewers miss.
Pipeline problems become visible. Reports reveal where deals stall in your sales process. If conversion from stage 2 to stage 3 drops across the team, that's a signal—maybe your discovery process needs work, or your qualification criteria are wrong.
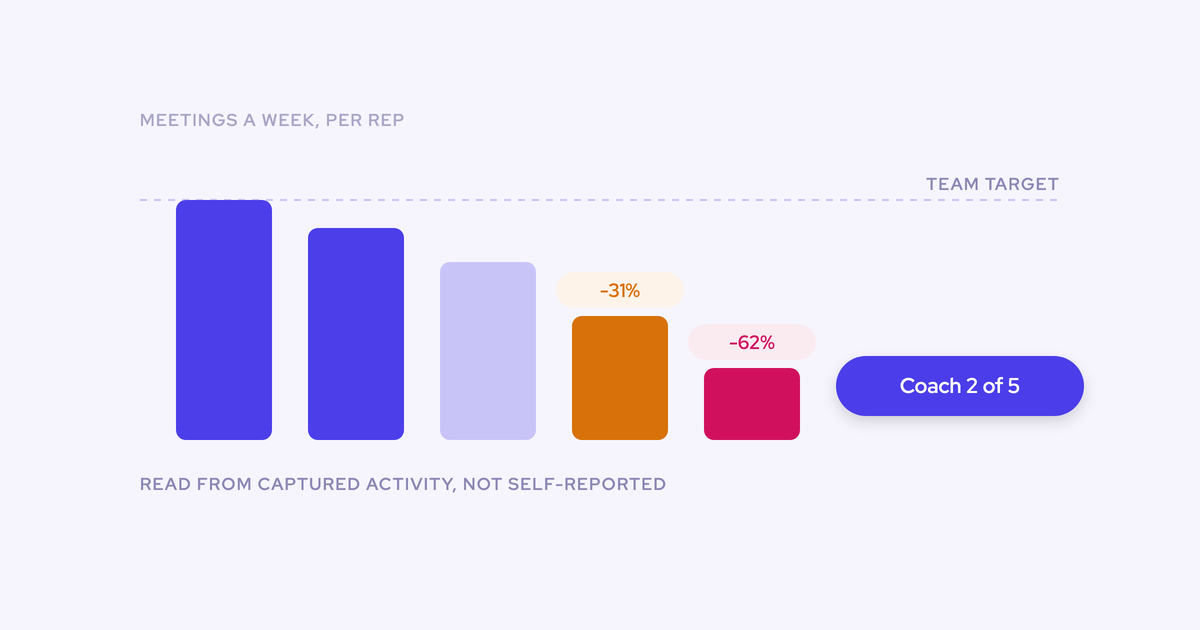
Rep coaching gets specific. Activity reports show which reps are doing the work. Deal-level analysis shows who needs help with specific skills. Instead of generic coaching, managers can address the actual gap: "You're getting meetings but deals stall at proposal. Let's work on your pricing conversations."
Resource allocation has data. Which segments are producing? Which territories are underperforming? Where should you add headcount? Sales reports provide the evidence for these decisions instead of relying on who argues loudest in the planning meeting.
Board and investor conversations improve. Leadership can present revenue data with confidence because they know where it came from. Instead of "we think we'll hit the number," they can show pipeline coverage ratios, conversion trends, and forecast accuracy history.
7 types of sales reports every sales manager should know
Different questions require different reports. Here's a reference for the most common types:
Report Type | What It Tracks | When to Use It |
|---|---|---|
Pipeline report | Open opportunities by stage, value, and age. Shows pipeline health and coverage ratio against quota. | Weekly pipeline reviews, forecast calls, capacity planning. |
Conversion rate report | Stage-to-stage progression rates. Identifies where deals stall or fall out of the funnel. | Monthly process reviews, sales methodology assessments. |
Won/lost deal report | Closed opportunities with win/loss reasons, competitor presence, and deal characteristics. | Quarterly business reviews, competitive analysis, product feedback. |
Average deal size report | Mean and median deal values by segment, product, or rep. Tracks trends over time. [banner type="download" url="https://www.weflow.ai/resources/cheat-sheets/free-cro-onboarding-cheat-sheet" text="CRO Onboarding Cheat Sheet" subtitle="Walk into your first board update knowing which numbers actually hold up" button="Get the cheatsheet"] | Pricing strategy reviews, territory planning, compensation design. |
Sales forecast report | Committed, best case, and pipeline values with probability weighting. Compares forecast to actual. | Weekly forecast calls, monthly leadership updates, board reporting. |
Activity report | Calls, emails, meetings, and tasks logged by rep. Shows engagement levels and work patterns. | Weekly one-on-ones, new rep ramp tracking, activity-based coaching. |
Customer churn report | Lost customers by reason, tenure, and value. Identifies retention risk patterns. | Monthly retention reviews, customer success planning, renewal forecasting. |
How to create a sales report in 6 steps (with examples)
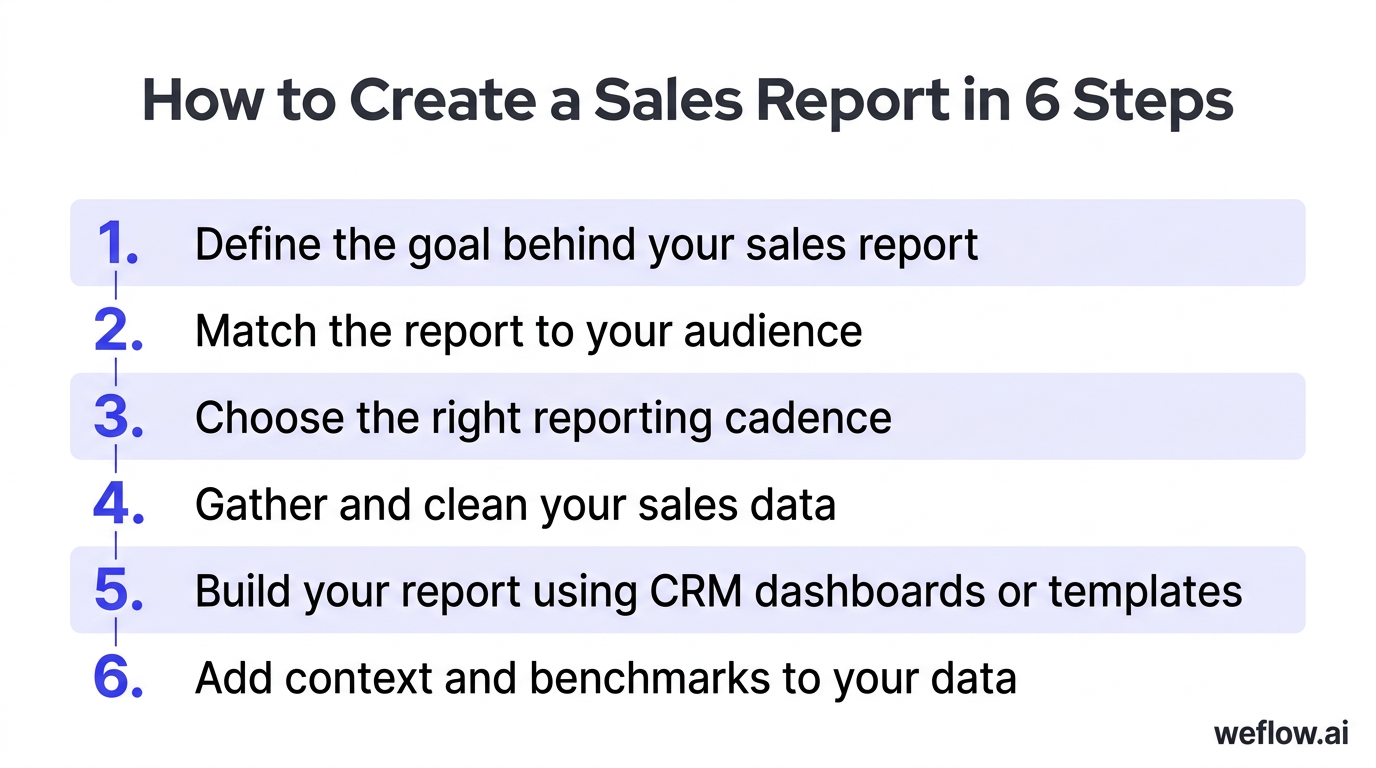
Step 1: Define the goal behind your sales report
Start with the question you're trying to answer. "How's the team doing?" is too vague. "Are we on track to hit Q2 quota, and where are the gaps?" gives you a clear target.
The goal shapes everything else: which metrics to include, what time frame to cover, and how much detail to provide. A report built to answer a specific question is more useful than one that tries to cover everything.
Examples of well-defined report goals:
Identify which deals are at risk of slipping from Q2 to Q3.
Compare rep performance against quota through mid-quarter.
Analyze why win rates dropped in the enterprise segment last month.
Step 2: Match the report to your audience
Different audiences need different reports. What a CRO needs for a board update differs from what a sales manager needs for a weekly team meeting.
Audience | What They Need | Format | Detail Level |
|---|---|---|---|
Board / Executives | Revenue vs. target, forecast confidence, pipeline coverage | Summary with charts, written narrative | High-level trends, not deal-level detail |
CRO / VP Sales | Forecast accuracy, pipeline health, team performance | Dashboard with drill-down capability | Segment and rep-level summaries |
Sales Manager | Rep activity, deal progression, at-risk opportunities | Weekly report or live dashboard | Deal-level inspection |
RevOps / Sales Ops | Data quality, process compliance, conversion metrics | Detailed Salesforce reports | Field-level accuracy and completeness |
Step 3: Choose the right reporting cadence (weekly, monthly, quarterly)
Reporting frequency depends on what decisions the report supports. Higher-stakes decisions need more frequent data. Operational decisions need real-time or weekly visibility. Strategic decisions can work with monthly or quarterly summaries.
Cadence | Best For | Typical Metrics | Who Uses It |
|---|---|---|---|
Daily/Weekly | Pipeline inspection, activity tracking, deal risk identification | Pipeline movement, activities logged, deals at risk, forecast changes [banner type="download" url="https://www.weflow.ai/resources/cheat-sheets/sales-enablement-cheat-sheet" text="Sales Enablement Cheat Sheet" subtitle="Turn rep-level report findings into coaching that moves win rates" button="Get the cheatsheet"] | Sales managers, frontline reps |
Monthly | Performance reviews, trend analysis, process evaluation | Win rate, conversion rates, average deal size, rep attainment | VP Sales, RevOps leaders |
Quarterly | Strategic planning, board reporting, compensation reviews | Revenue vs. target, forecast accuracy, YoY trends, market analysis | CRO, board, investors |
Step 4: Gather and clean your sales data
The report is only as good as the data behind it. Before building anything, verify your data sources:
Check activity capture: Are emails and meetings syncing to Salesforce? If your activity data is incomplete, activity-based metrics will mislead.
Audit opportunity fields: Are close dates current? Are amounts accurate? Are stages updated? Stale opportunity data breaks pipeline reports.
Validate date ranges: Make sure your report filters match your intended period. A "monthly" report that accidentally includes data from the previous month will confuse everyone.
Remove duplicates: Check for duplicate opportunities or contacts that inflate numbers.
If manual data cleanup takes more than an hour, that's a signal your data capture process needs work—not your reporting process.
Step 5: Build your report using CRM dashboards or templates
Salesforce includes native reporting tools that handle most use cases. For standard reports:
Use Salesforce Report Builder to create reports grouped by stage, rep, or time period.
Add summary formulas for calculated metrics like conversion rate or average deal size.
Build dashboards that combine multiple reports for a unified view.
Schedule reports to run automatically and email to stakeholders.
For teams that need deeper pipeline visibility, tools like Weflow provide pre-built views that surface deal risk, activity gaps, and forecast confidence without manual report building. The data flows directly from Salesforce, so you're always working with current information.
Step 6: Add context and benchmarks to your data
Numbers without context don't drive decisions. Every metric should answer "compared to what?"
Prior period: How does this month compare to last month? This quarter vs. last quarter?
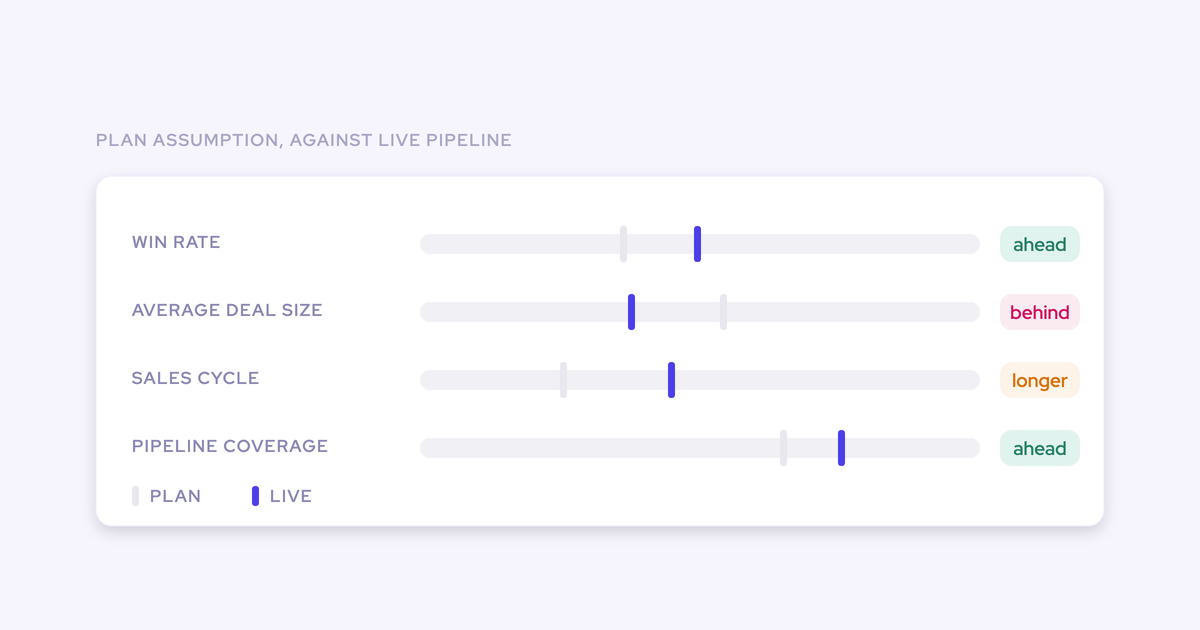
Target: Are we ahead or behind plan? By how much?
Trend: Is the metric improving or declining over time?
Cohort: How does this rep or segment compare to peers?
Add a written summary that interprets the data. Don't make leadership guess what the numbers mean. State it directly: "Pipeline coverage is 2.8x, down from 3.2x last month. The gap is concentrated in the SMB segment, where we lost two AEs in March. Expect Q2 to come in 10-15% below target unless we backfill."
How AI is changing sales reporting in 2026
AI is shifting sales reporting from manual assembly to automated insight generation. Here's what's changing:
Automated data capture eliminates the input problem. Tools now capture emails, meetings, and call data without rep involvement—writing directly to Salesforce records. This solves the foundational problem: reports can't be accurate if reps don't update CRM. When activity capture is automated, activity-based metrics become reliable for the first time.
AI surfaces deal risk before managers notice. Instead of reviewing every opportunity manually, AI models flag deals with warning signs: declining engagement, missing stakeholders, stalled progression, or negative sentiment in conversations. Managers get a prioritized list of where to focus instead of reviewing everything equally.
Forecasts use historical patterns, not just rep judgment. AI-driven forecasting analyzes conversion rates, deal velocity, and engagement patterns across your historical data to predict which deals will close and when. This doesn't replace rep input—it adds a data-driven layer that catches the optimistic commits and pessimistic sandbags.
Report generation happens automatically. AI can assemble weekly pipeline summaries, highlight anomalies, and draft written analysis based on the data. RevOps teams spend less time building reports and more time acting on what the reports reveal.
For Salesforce-centric teams, the key is choosing tools that write data to native Salesforce objects—not external data stores that require separate reporting. When your activity, conversation, and deal data all live in Salesforce, your existing reports and dashboards work without modification.
Frequently asked questions
What is a sales report?
A sales report is a document that summarizes a company's sales activities and results over a specific period—typically a week, month, or quarter. It includes metrics like revenue, deals closed, conversion rates, and pipeline health to help sales leaders make data-driven decisions.
What should a sales report include?
Every sales report should include the metrics that map to its stated goal. At minimum, include total revenue, deals won and lost, pipeline value, and conversion rates. Add benchmarks (prior period or target) so readers can judge whether performance is on track.
How do you write a sales report step by step?
Define the report's goal, identify the audience, choose a reporting cadence (weekly, monthly, or quarterly), pull and clean your CRM data, select five to seven key metrics, and present the data with charts and written context that explains what the numbers mean.
What are the most common types of sales reports?
The most common types are pipeline reports, conversion rate reports, won/lost deal reports, average deal size reports, sales forecast reports, sales activity/call reports, and customer churn reports. Each serves a different purpose and audience.
How often should you create a sales report?
Frequency depends on the audience. Daily or weekly reports work for reps and frontline managers tracking activities. Monthly reports suit leadership reviewing team performance. Quarterly reports are best for strategic planning and board-level updates.
What is the difference between a sales report and a sales dashboard?
A sales report is a point-in-time document designed to communicate findings to a specific audience. A sales dashboard is a real-time, interactive view that lets users filter and explore data on demand. Most teams use dashboards day-to-day and reports for formal reviews.
What tools can you use to create sales reports?
CRM platforms like Salesforce, HubSpot, and Close generate reports directly from live data. For teams on Salesforce, Weflow automates pipeline views and reporting without manual data exports. Google Sheets and Excel work for simpler needs but require manual setup.
How does AI improve sales reporting?
AI automates data capture, flags anomalies in pipeline health, and generates forecasts based on historical patterns. In 2026, leading CRMs use AI to surface at-risk deals, recommend next actions, and reduce the manual work of assembling reports.
Turn sales reports into action: Next steps
A sales report only creates value if someone acts on it. Here's how to move from data to decision:
Identify the one thing. After reviewing the report, name the single most important action it suggests. Not five things—one thing. Pipeline coverage low? Focus on sourcing. Win rate dropping? Investigate lost deals. Commit gap widening? Inspect the at-risk opportunities.
Assign ownership. Every insight needs an owner. "We should look into enterprise conversion rates" goes nowhere. "Sarah will analyze enterprise deals that stalled at proposal stage and report back Thursday" creates accountability.
Set a follow-up. Schedule the next check-in before you leave the meeting. If the action was important enough to assign, it's important enough to track.
For teams running Salesforce, Weflow can reduce the manual effort in sales reporting by automating activity capture and surfacing pipeline insights directly in your CRM. You spend less time building reports and more time acting on what they reveal.

.webp)