
Sales Efficiency: How to Calculate It and 9 Ways to Improve It
Learn how to calculate sales efficiency, benchmark the ratio, and apply 9 ways to improve it.




What is sales efficiency? (Definition + why it matters)
Sales efficiency measures how much revenue your sales organization generates for every dollar spent on sales and marketing. It's the ratio of revenue to total sales and marketing costs—and it's the single best indicator of whether your go-to-market engine is scaling profitably or just scaling spend.
For B2B sales leaders, this metric answers a question that headcount and quota attainment alone can't: are we getting enough return from our investment in selling?
A high sales efficiency ratio means your team converts spend into revenue at a healthy rate. A low one means you're burning cash to acquire revenue—and that gap compounds every quarter. When headcount is flat and budgets are tight, sales efficiency becomes the lever that separates teams that hit plan from teams that miss it while spending the same amount.
This matters more in 2025 than it did two years ago. Boards and CFOs are asking RevOps leaders to prove that every dollar of S&M spend delivers measurable pipeline and revenue. If you can't show that your sales efficiency ratio is improving—or at least stable—you'll face pressure to cut headcount rather than invest in growth.
Sales efficiency vs. sales effectiveness: what's the difference?
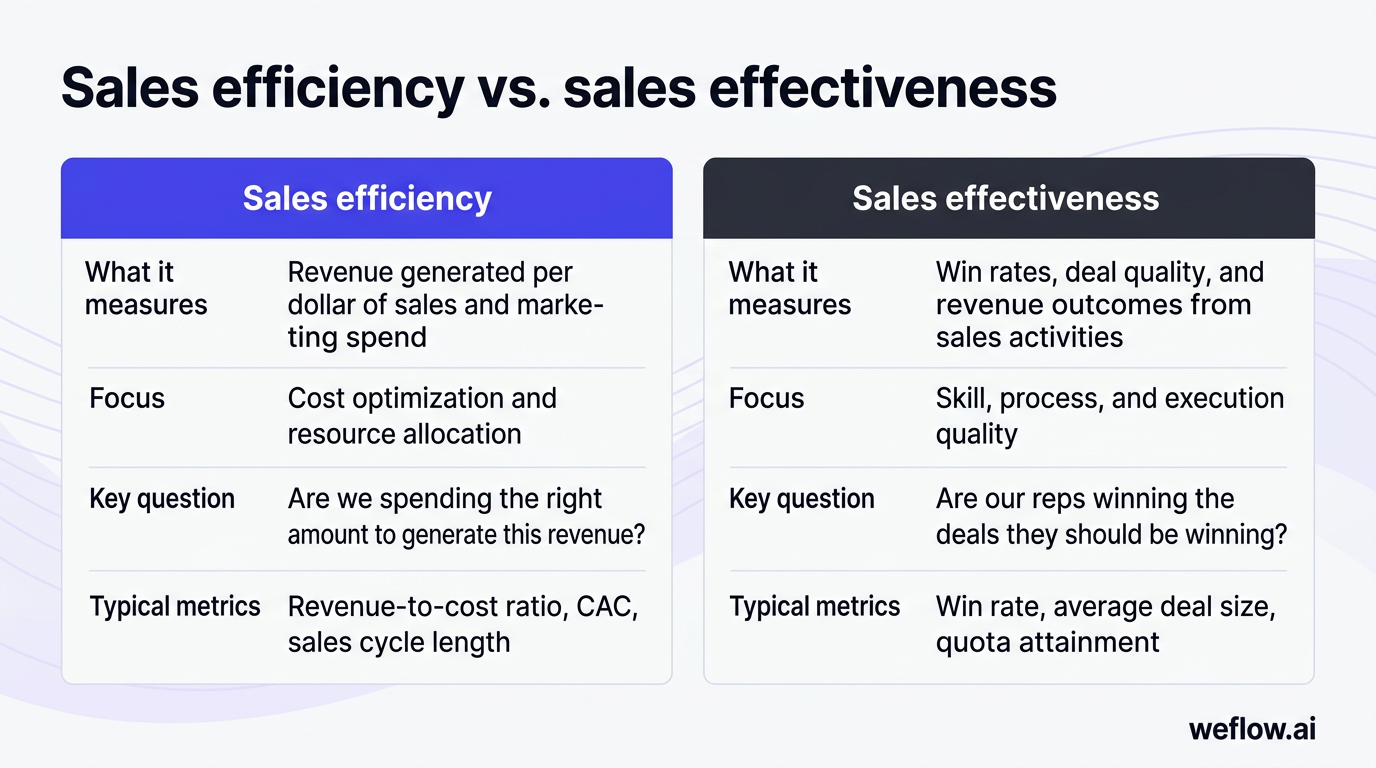
Sales efficiency and sales effectiveness get used interchangeably, but they measure different things. Efficiency is about resource optimization—doing the same work with less. Effectiveness is about outcome quality—winning more of the deals you work.
| Dimension | Sales efficiency | Sales effectiveness |
|---|---|---|
| What it measures | Revenue generated per dollar of sales and marketing spend | Win rates, deal quality, and revenue outcomes from sales activities |
| Focus | Cost optimization and resource allocation | Skill, process, and execution quality |
| Key question | "Are we spending the right amount to generate this revenue?" | "Are our reps winning the deals they should be winning?" |
| Typical metrics | Revenue-to-cost ratio, CAC, sales cycle length | Win rate, average deal size, quota attainment |
You need both. But when headcount is fixed and budgets aren't growing, efficiency is the lever you can pull without hiring. Reducing wasted selling time, automating admin work, and tightening your ICP all improve efficiency without adding a single seat.
How to calculate sales efficiency (formula + worked example)
The formula is straightforward:
Sales Efficiency Ratio = Revenue / Total Sales & Marketing Costs
Total sales and marketing costs include salaries, commissions, benefits, software, travel, events, advertising, and any other spend attributed to your go-to-market function.
Worked example
Suppose your sales team generated $2M in new revenue last quarter. Your total sales and marketing costs for the same period were $1M. Your sales efficiency ratio is:
$2,000,000 / $1,000,000 = 2.0
A 2.0 ratio means you generated $2 in revenue for every $1 spent. That's a healthy result for most B2B organizations.
How to interpret the number:
- Below 1.0: You're spending more than you're earning. Unsustainable without a clear path to improvement.
- 1.0 to 3.0: Healthy range for most B2B sales organizations.
- Above 3.0: Either exceptional execution or a sign that you're underinvesting in growth.
Gross vs. net sales efficiency: which should you track?
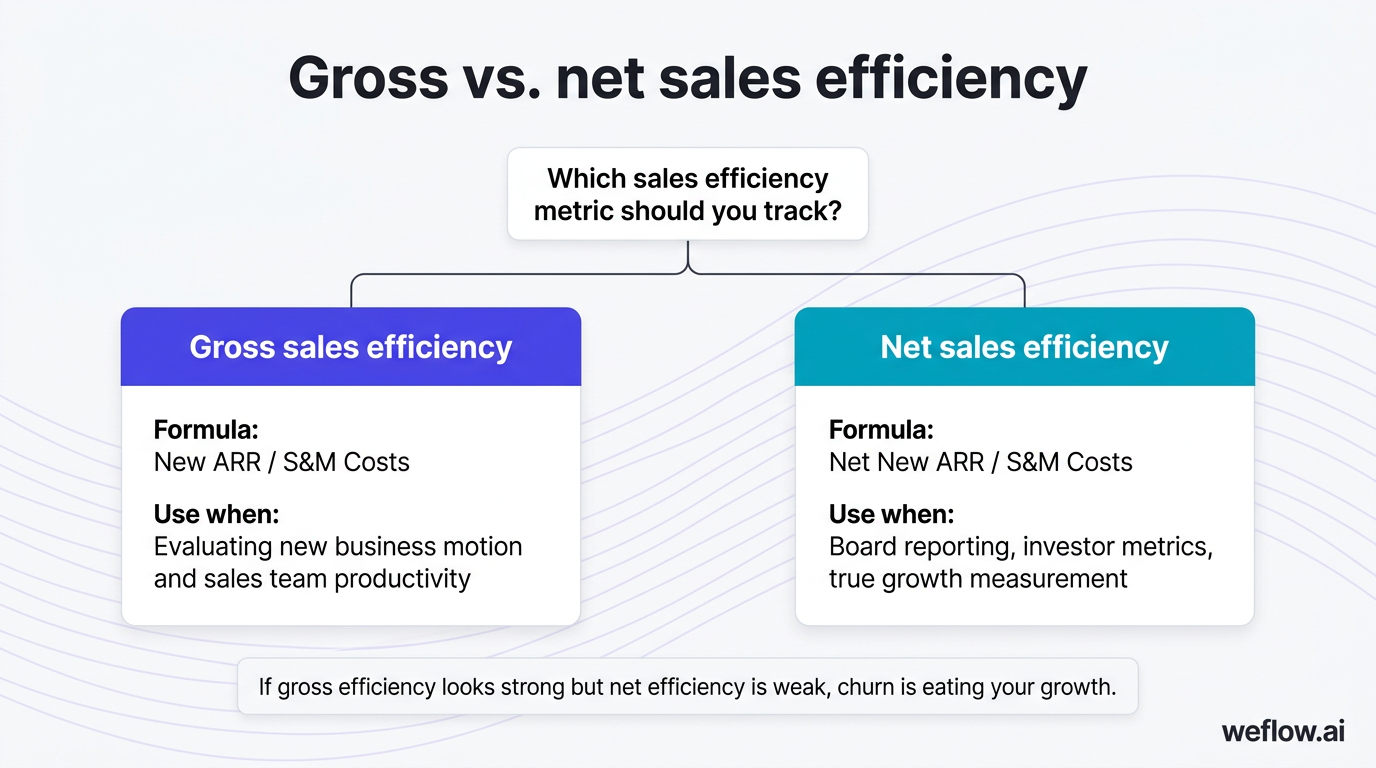
Both—but they tell you different things. Gross sales efficiency looks at new revenue only. Net sales efficiency accounts for churn, giving you a more realistic picture of actual revenue impact.
| Metric | Formula | What it shows | When to use |
|---|---|---|---|
| Gross sales efficiency | New ARR / S&M Costs | How well you acquire new revenue | Evaluating new business motion and sales team productivity |
| Net sales efficiency | Net New ARR / S&M Costs | Revenue growth after churn and contraction | Board reporting, investor metrics, true growth measurement |
If your gross efficiency looks strong but net efficiency is weak, churn is eating your growth. That's a retention and customer success problem—not a sales efficiency problem.
What is a good sales efficiency ratio?
Context matters, but here are the benchmarks most B2B organizations use:
| Ratio range | What it means | Action |
|---|---|---|
| Below 1.0 | Unsustainable—spending more than you earn | Audit sales process, ICP, and cost structure immediately |
| 1.0 to 3.0 | Healthy—you're generating positive return on S&M investment | Focus on incremental improvements to push toward the higher end |
| Above 3.0 | Exceptional, or underinvesting in growth | Evaluate whether you should invest more aggressively to capture market share |
A ratio above 3.0 isn't always a win. It can mean your team is capacity-constrained and leaving pipeline on the table. If win rates are high and deal cycles are short but you're not growing headcount, you might be underinvesting.
For SaaS companies, the "Magic Number"—a specific form of sales efficiency—uses the same logic. A Magic Number above 0.75 generally signals it's time to invest more in sales and marketing.
9 strategies to improve sales efficiency in 2025
1. Set measurable sales KPIs (not just SMART goals)
Generic goal frameworks don't improve efficiency. Sales-specific KPIs tied to revenue outcomes do. The difference between "improve pipeline" and "increase pipeline velocity from 45 to 60 days" is the difference between a wish and a metric you can act on.
Focus on KPIs that directly connect to efficiency:
| KPI | What it measures | Target example |
|---|---|---|
| Revenue per rep | Individual productivity and quota efficiency | $500K ARR per AE per year |
| Deal cycle length | Time from opportunity creation to close | Reduce from 90 to 65 days |
| Pipeline velocity | Speed at which pipeline converts to revenue | $150K pipeline generated per rep per month |
| Win rate by stage | Conversion efficiency at each pipeline stage | 40% Stage 3 to Closed Won |
| Activity-to-opportunity ratio | How many activities produce a qualified opportunity | 50 activities per qualified opportunity |
Review these monthly, not quarterly. Quarterly reviews catch problems too late—by the time a declining win rate shows up in quarterly data, you've already lost two months of deals.
2. Tighten your ICP to reduce wasted sales cycles
The fastest way to improve sales efficiency is to stop selling to accounts that won't close. Reps who spend 30% of their time on poor-fit accounts are 30% less efficient—and the math gets worse when you count the opportunity cost of deals they didn't pursue.
A tight ICP goes beyond "mid-market SaaS companies." Define your ideal accounts by:
- Industry and sub-vertical: Which industries close fastest and expand most?
- Company size: Employee count and revenue range where your product fits best
- Tech stack: Do they run the systems your product integrates with? For a Salesforce-native tool, that means confirming Salesforce Enterprise or Unlimited edition.
- Buying signals: Recent funding, leadership changes, job postings for RevOps roles, or tech stack changes that indicate readiness
Score every account against these criteria before reps engage. Teams that enforce ICP scoring at the top of funnel see 20-30% shorter deal cycles because they're working accounts that actually fit.
3. Automate admin work to maximize selling time
Sales reps spend roughly 37% of their time actually selling. The rest goes to CRM data entry, internal meetings, email, and administrative tasks. That's a massive efficiency leak—and it's one you can fix with automation.
Three categories of admin work that technology can eliminate:
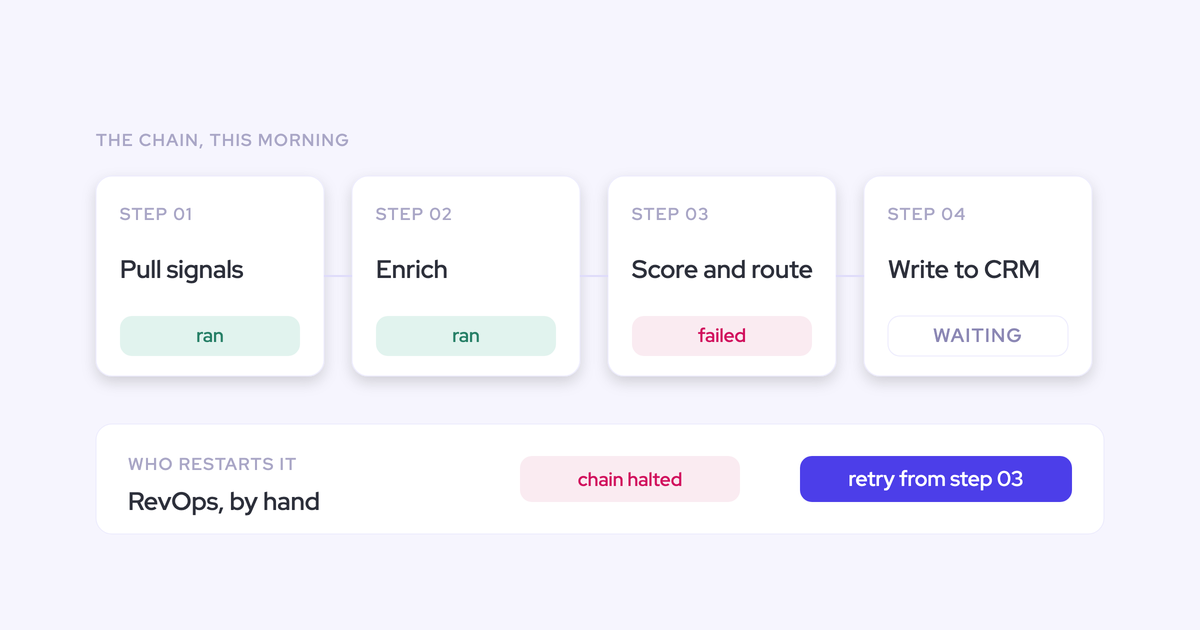
- CRM data entry: Logging calls, emails, and meetings into Salesforce manually takes 5-10 hours per rep per week. Automated activity capture writes this data to Salesforce in the background—no rep action required.
- Email sequencing and follow-ups: AI-generated follow-up emails based on call content save reps 30-60 minutes per day while improving response rates.
- Pipeline management: Updating deal stages, MEDDIC fields, and next steps after every call is tedious and inconsistent. AI that listens to conversations and populates these fields automatically keeps pipeline data current without rep effort.
Weflow, a Salesforce-native revenue AI platform, automates all three. Activity capture writes emails, meetings, and calls directly to Salesforce Task and Event objects. AI processes call recordings and updates deal fields, methodology compliance, and next steps automatically—so reps spend time selling, not typing.
4. Use data-driven sales coaching to improve win rates
Coaching is one of the highest-impact activities a sales manager has—but only when it's based on data, not gut feel. Managers who coach based on call recordings and deal-level insights improve rep win rates by 15-25% compared to managers who rely on pipeline reviews alone.
Effective data-driven coaching requires three things:
[banner type="download" url="https://www.weflow.ai/resources/cheat-sheets/sales-enablement-cheat-sheet" text="Sales Enablement Cheat Sheet" subtitle="Get every rep running the same process so coaching actually sticks" button="Get the cheat sheet"]
- Conversation intelligence: Record and transcribe every sales call so managers can review how reps handle objections, discovery, and negotiation—without sitting on every call.
- Deal-level signals: Track which deals are progressing normally and which show risk signals like stalled stages, missing stakeholders, or declining engagement.
- Repeatable review cadence: Block 30 minutes per rep per week for coaching. Use call recordings and deal data to make every session specific and useful.
Weflow's conversation intelligence captures calls and surfaces coaching signals directly inside Salesforce—where managers already review pipeline. Instead of switching between a call recording tool and your CRM, you see deal context, call insights, and pipeline data in one view.
5. Align sales and marketing around shared revenue goals
Misalignment between sales and marketing is an efficiency killer. Marketing generates leads that sales ignores. Sales complains about lead quality. Both teams optimize for their own metrics while pipeline suffers.
Fix this with shared accountability:
- Shared pipeline metrics: Both teams own pipeline generated, not just MQLs or SQLs. When marketing's goal is pipeline dollars—not lead volume—quality improves.
- Joint account planning: Marketing and sales collaborate on target account lists, messaging, and multi-touch campaigns for high-value prospects.
- Lead quality feedback loops: Build a structured process where sales scores lead quality weekly and marketing adjusts targeting based on that data. No more quarterly complaints—continuous calibration.
- Unified reporting: Both teams look at the same dashboard showing pipeline by source, conversion rates by channel, and revenue attribution. When everyone sees the same numbers, arguments about who "owns" pipeline disappear.
Companies with strong sales-marketing alignment achieve 38% higher win rates and 36% higher customer retention. The efficiency gain comes from fewer wasted touches and faster deal progression.
6. Simplify your sales process and pipeline stages
Bloated sales processes slow deals down. If your pipeline has eight stages but reps can't explain the exit criteria for each one, you have a documentation problem that's costing you deals.
Start with an audit:
- Map your current process from first touch to close. Document every stage, its exit criteria, and the typical activities that happen there.
- Identify redundant stages. If two stages have nearly identical activities and exit criteria, merge them.
- Clarify exit criteria. Every stage needs specific, observable criteria for advancing—not subjective assessments like "good meeting" or "strong interest."
- Standardize so reps follow a repeatable path. When every rep runs a slightly different process, coaching becomes impossible and forecasting becomes guesswork.
A clean five-to-six-stage pipeline with clear exit criteria, documented in Salesforce using validation rules and required fields, gives you both efficiency and forecast accuracy. Reps move faster because they know what "done" looks like at each stage.
7. Invest in sales technology and CRM automation
The right tech stack eliminates manual work and gives leaders visibility into what's happening across the pipeline—without waiting for reps to update their deals.
Three technology categories that drive the biggest efficiency gains:
- Activity capture: Automatically logs emails, meetings, and calls into Salesforce. Eliminates the biggest single time sink for reps and gives managers complete activity data for every deal.
- Pipeline inspection and forecasting: Surfaces deal risk, tracks stage progression, and produces forecasts based on actual deal data—not rep estimates. Reduces forecast error and shortens weekly pipeline reviews.
- Conversation intelligence: Records, transcribes, and analyzes sales calls. Gives managers coaching insights and populates CRM fields with call outcomes, action items, and methodology compliance.
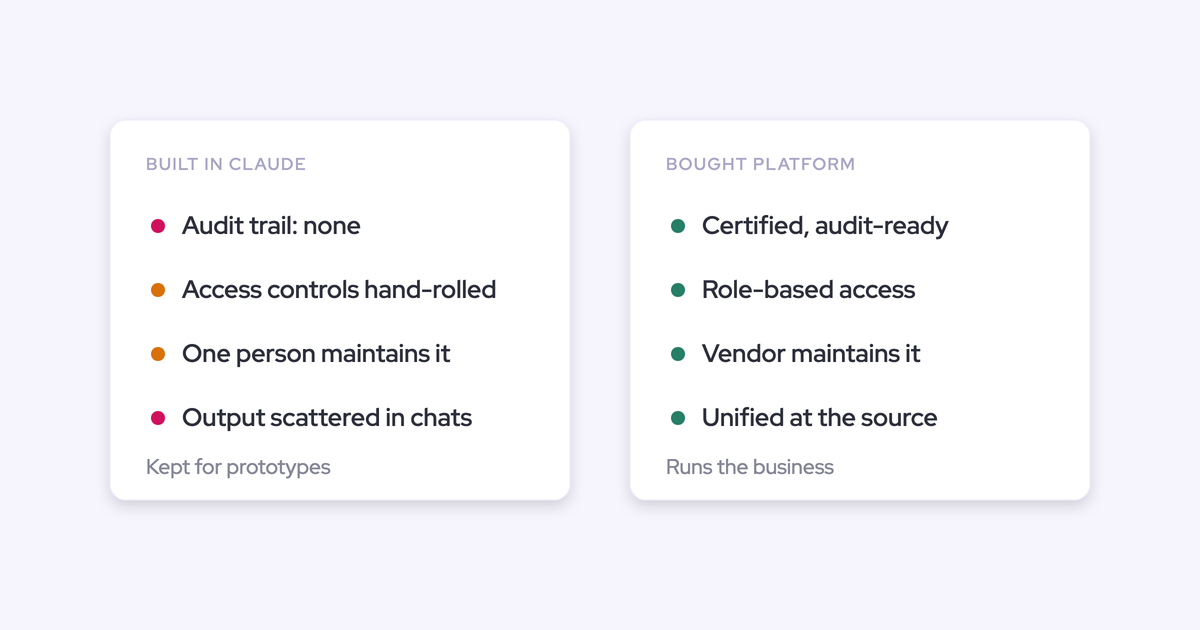
Weflow combines all three in a single platform built natively around Salesforce. Instead of stitching together separate tools for activity capture, call recording, and forecasting—each with its own integration and data model—you get one system that writes directly to Salesforce objects. The result: cleaner data, less tool switching, and a lower total cost of ownership.
8. Optimize territory design and account assignment
Uneven territories create uneven results. When one rep has 200 accounts and another has 50, you don't have a performance problem—you have a territory problem.
Data-driven territory planning improves efficiency in three ways:
- Even distribution of opportunity: Balance territories by revenue potential, not just account count. A territory with 100 small accounts may have less opportunity than one with 30 mid-market accounts.
- Reduced geographic overlap: For field sales teams, minimizing travel between accounts in different regions saves time and travel budget.
- Right rep, right account: Match rep experience and expertise to account complexity. Senior reps on enterprise accounts, newer reps on velocity deals.
Re-evaluate territories at least twice a year. Markets shift, accounts churn, and new reps join. A territory plan that made sense in January may be creating bottlenecks by July.
9. Track and review sales efficiency metrics monthly
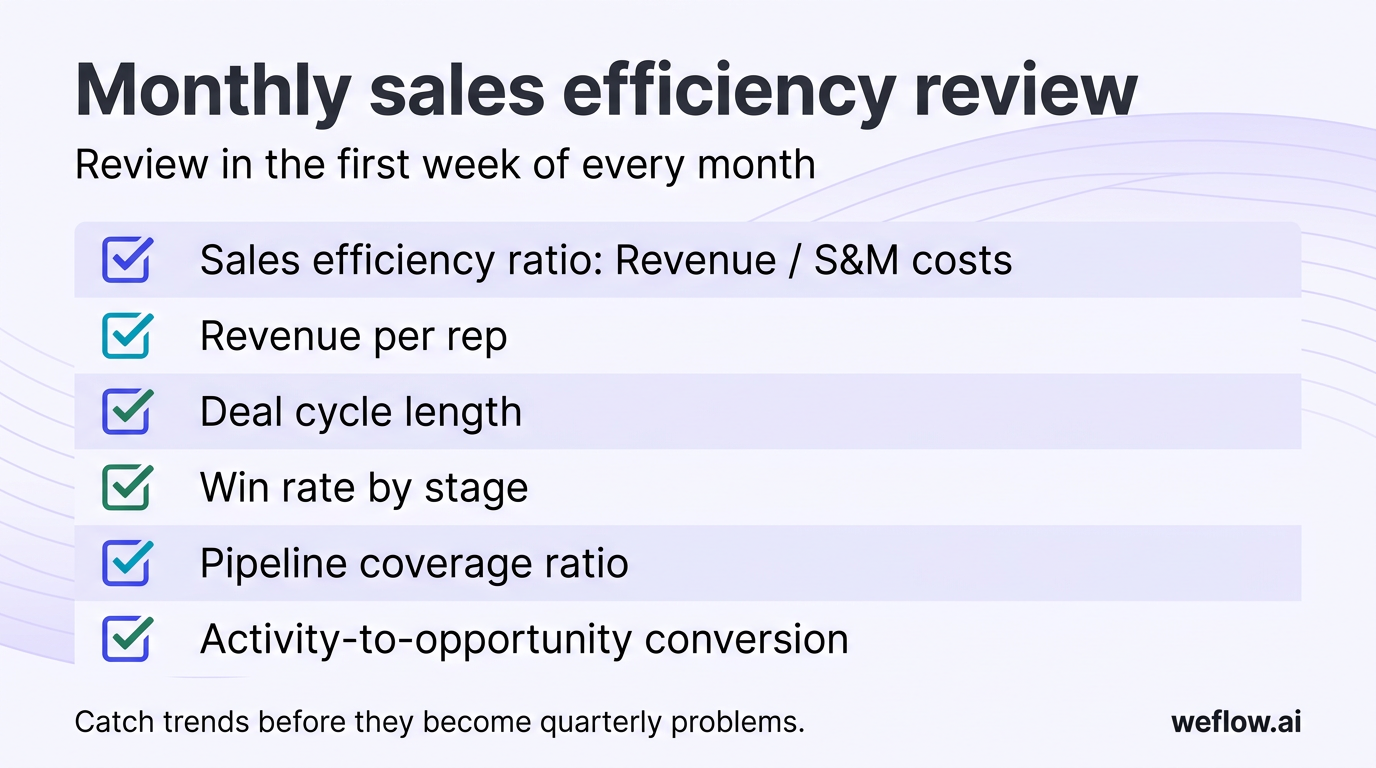
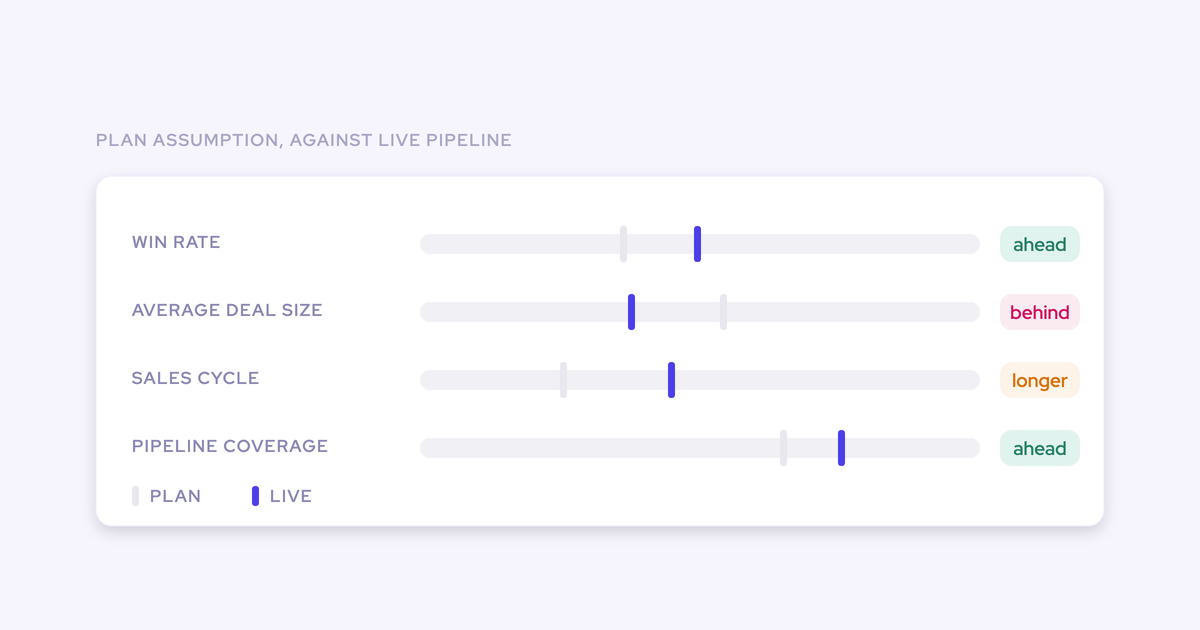
Measuring sales efficiency once a quarter misses trends that compound over 90 days. A monthly review cadence catches declining conversion rates, lengthening deal cycles, and rising costs before they become quarterly misses.
Build a dashboard with these metrics and review it in the first week of every month:
- Sales efficiency ratio: Revenue / S&M costs—your primary indicator
- Revenue per rep: Are individual reps becoming more or less productive?
- Deal cycle length: Is it trending up or down? By segment?
- Win rate by stage: Where are deals dying in the pipeline?
- Pipeline coverage ratio: Do you have enough pipeline to hit next quarter's number?
- Activity-to-opportunity conversion: Are reps doing the right activities, or just more activities?
The goal isn't to create more reporting—it's to create a feedback loop where data drives decisions. When you spot a dip in win rate at Stage 3, you can investigate within a week instead of discovering it at the end of the quarter.
Start improving sales efficiency today
Sales efficiency isn't a one-time project—it's an operating discipline. The teams that consistently outperform don't have secret strategies. They measure the right metrics, eliminate wasted effort, and give reps the tools to spend their time selling instead of updating Salesforce.
Start with the highest-impact lever for your organization. For most teams, that's automating CRM data entry and capturing activity data that's currently falling through the cracks.
Weflow is a revenue AI platform that automates Salesforce data capture, surfaces conversation intelligence, and gives RevOps leaders the pipeline visibility they need to forecast accurately. Get a demo to see how it works in your Salesforce environment.
Frequently asked questions
What is a good sales efficiency ratio?
A ratio between 1.0 and 3.0 is considered healthy for most B2B organizations. Below 1.0 means you're spending more on sales and marketing than you're generating in revenue. Above 3.0 can signal either exceptional performance or underinvestment in growth.
How do you calculate sales efficiency?
Divide your total revenue by your total sales and marketing costs for the same period. For example, $2M in revenue divided by $1M in S&M costs equals a 2.0 sales efficiency ratio. Use quarterly or annual periods for the most stable measurement.
What is the difference between sales efficiency and sales effectiveness?
Sales efficiency measures how much revenue you generate per dollar of sales spend—it's a cost-to-revenue metric. Sales effectiveness measures how well your reps convert opportunities into wins—it's a quality-of-execution metric. You need both, but efficiency is the lever when budgets are fixed.
Why is my sales efficiency ratio declining?
The most common causes are rising S&M costs without proportional revenue growth, longer deal cycles, declining win rates, or selling to poor-fit accounts. Start by comparing your cost growth rate to your revenue growth rate. If costs are growing faster, audit where the incremental spend is going and whether it's producing pipeline.
How can I improve sales efficiency without adding headcount?
Focus on three areas: automate admin work so reps spend more time selling, tighten your ICP so reps work better-fit accounts, and shorten deal cycles by streamlining your sales process. Automating CRM data entry alone can recover five to 10 hours per rep per week.
What sales efficiency KPIs should I track?
Track the sales efficiency ratio (revenue / S&M costs), revenue per rep, deal cycle length, win rate by stage, pipeline velocity, and pipeline coverage ratio. Review these monthly to catch trends before they become quarterly problems.
How does CRM automation improve sales efficiency?
CRM automation eliminates manual data entry—the largest non-selling time drain for reps. Automated activity capture logs emails, meetings, and calls into Salesforce without rep action. AI-driven field updates keep deal data current after every conversation. The result is more selling time, cleaner data, and more accurate forecasting.
What is the "Magic Number" in SaaS sales efficiency?
The Magic Number is a SaaS-specific efficiency metric calculated as net new ARR in the current quarter divided by total S&M spend in the previous quarter. A Magic Number above 0.75 indicates efficient growth and signals it's time to invest more in sales and marketing. Below 0.5 suggests the go-to-market motion needs optimization before scaling spend.

.webp)