
Sales Performance Management: Components, Process, and Tools
Learn sales performance management components, process, KPIs, and tools for planning, comp, and analytics.




What is sales performance management (SPM)?
Sales performance management (SPM) is the discipline of aligning sales planning, incentive compensation, and performance analytics into a single operating system for the revenue org. Where most sales tools handle one layer—CRM for data, comp software for payouts, spreadsheets for territory planning—SPM connects all three so that goals, incentives, and insights reinforce each other instead of pulling in different directions.
Done well, SPM answers three questions at once: Are we targeting the right markets with the right coverage? Are we paying people to do the right things? And do we actually know what's working? Without all three, you're optimizing in the dark.
Why is sales performance management important?
Most revenue orgs have the pieces of SPM scattered across tools and spreadsheets—they just aren't connected. When territory plans live in a Google Sheet, comp structures live in a separate system, and performance data is incomplete in Salesforce, leaders make decisions with an incomplete picture. SPM creates the operating infrastructure that ties execution to strategy.
| Benefit | Business Impact |
|---|---|
| Data-driven decisions | Revenue leaders act on actual pipeline and activity data instead of gut feel or end-of-quarter rep surveys. Forecast calls become fact-based instead of a negotiation. |
| Improved rep productivity | Clear goals and automated reporting reduce administrative overhead. Reps spend more time selling and less time figuring out where they stand against quota. |
| Motivation and retention | Transparent, fair compensation structures and visible performance rankings reduce "shadow accounting"—the hours reps spend recalculating their own commission. Lower comp disputes mean lower attrition. |
| Forecast accuracy | When pipeline data is clean, quota coverage ratios are meaningful, and territory alignment is tight, forecasts move from ±30% guesses to ±5–10% confidence ranges that leadership can present to the board. |
What are the core components of sales performance management?
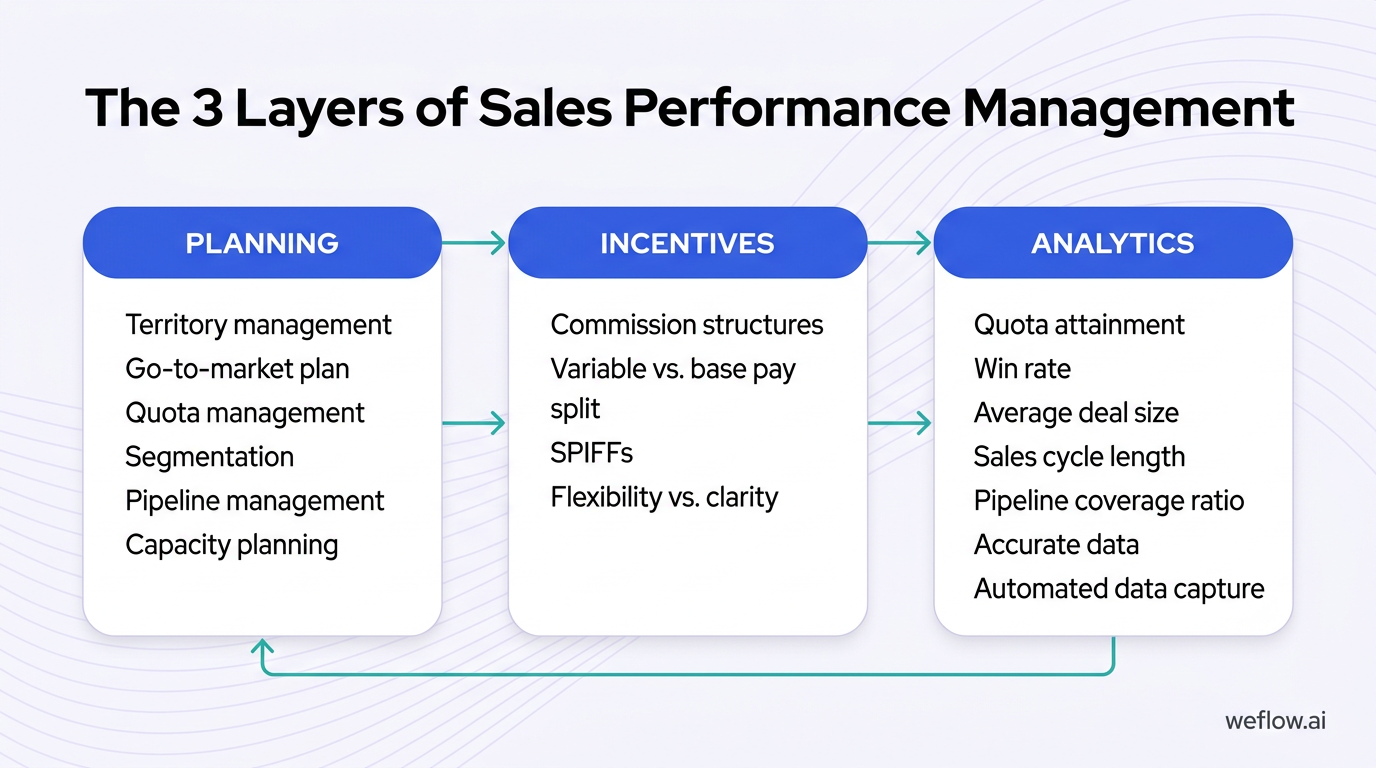
SPM has three functional layers that need to work together: planning (where you allocate capacity and set targets), incentives (how you pay people to execute the plan), and analytics (how you measure whether the plan is working). Most companies have each layer in some form. The ones that have integrated SPM have them connected.
Sales planning: territory, quota, and go-to-market alignment
Sales planning is where SPM starts. Before you can track performance or pay people for it, you need to define who owns what, what they're responsible for delivering, and whether the market coverage matches your go-to-market strategy. Weak planning creates problems downstream that no incentive plan or dashboard can fix.
| Planning Element | What It Covers | Why It Matters for SPM |
|---|---|---|
| Territory management | Assigning accounts, geographies, or verticals to reps and teams | Unbalanced territories mean some reps are set up to overperform and others to fail—which distorts both performance data and comp payouts |
| Go-to-market plan | Defining segments, channels, and coverage models for each market | Performance metrics only make sense relative to a deliberate GTM strategy; without it, you're measuring activity without context |
| Quota management | Setting individual and team revenue targets by period | Quotas anchor every other SPM measurement—attainment rates, pipeline coverage, and comp calculations all flow from quota targets |
| Segmentation | Splitting the addressable market into cohorts by size, industry, or buying stage | Segment-level performance data reveals where the GTM motion is working and where it isn't; without segmentation, good and bad market fit blur together |
| Pipeline management | Defining stage criteria, exit conditions, and coverage requirements by segment | Pipeline health is the leading indicator of quota attainment; rigorous stage definitions (aligned to MEDDIC or BANT, for example) make pipeline data trustworthy enough to act on |
| Capacity planning | Modeling headcount needs against revenue targets and ramp timelines | Quota attainment rates are meaningless if the org is under-resourced; capacity planning ensures the team has a realistic shot at hitting the number |
Sales incentive compensation: commission structures and SPIFFs
If your incentive plan rewards the wrong behaviors, reps will follow the money—and they should. Compensation is the clearest signal a sales org sends about what it actually wants. When that signal is misaligned with company goals, you get technically compliant reps hitting personal commission targets while strategic priorities go unmet.
Effective incentive compensation design starts with this question: what rep behavior will most reliably produce the business outcome we want? Then build the plan around that behavior. Key design decisions include:
- Commission structures. Tiered commission accelerators—where the rate increases above 100% quota attainment—reward top performers disproportionately and create strong motivation to overachieve. Flat rates are simpler to administer but don't create the same performance peaks.
- Variable vs. base pay split. Most B2B SaaS reps carry an on-target earnings (OTE) split of 50/50 or 60/40 base-to-variable. Higher variable percentages increase upside but also increase pressure that can drive short-term behavior at the expense of deal quality.
- SPIFFs. Short-term performance incentives (SPIFFs) work well for driving focused behavior over a defined period—pushing a specific product, closing end-of-quarter deals, or accelerating a new market segment. They lose effectiveness if overused, and can backfire if reps learn to time their pipeline around SPIFF windows.
- Flexibility vs. clarity. Complex multi-variable comp plans can capture layered business priorities, but they create confusion and distrust if reps can't quickly calculate what a deal is worth. Simpler plans with transparent logic drive more consistent behavior.
Sales analytics and performance insights
Analytics is where SPM closes the loop. Planning and incentives set the conditions for performance; analytics tells you whether those conditions are producing the results you planned for—and where to adjust.
Effective sales analytics requires three things that are harder to achieve than they appear:
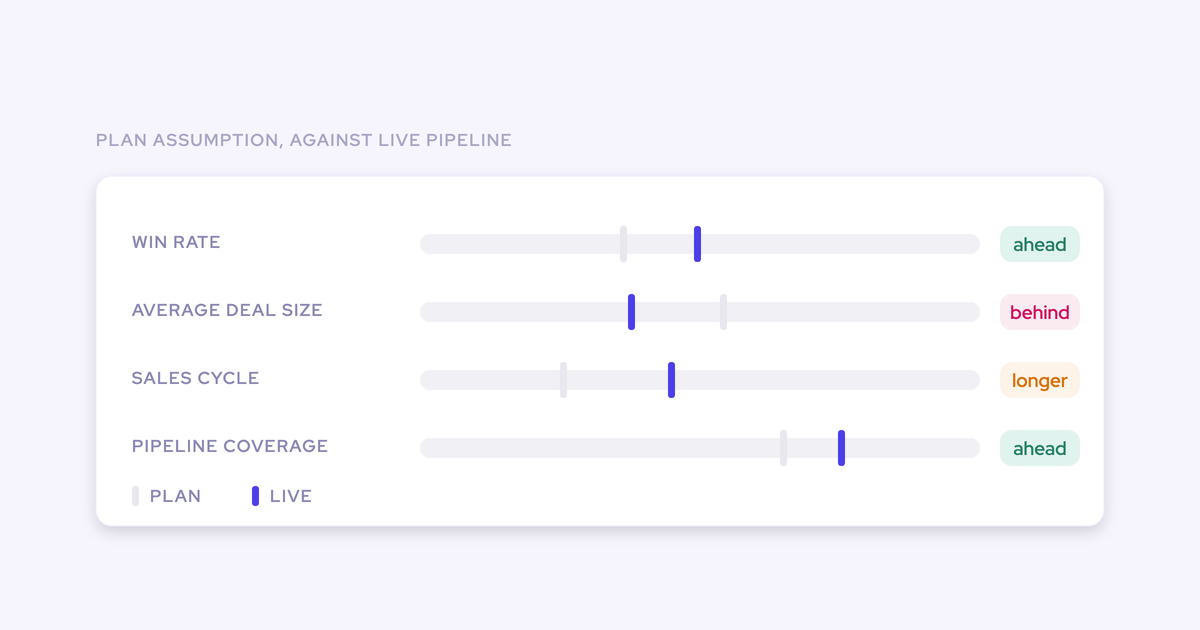
- The right KPIs. Quota attainment, win rate, average deal size, sales cycle length, and pipeline coverage ratio are the core metrics for most B2B sales orgs. Each answers a different diagnostic question. Win rate tells you about deal execution quality. Pipeline coverage tells you whether the org has enough opportunity to hit quota even with normal attrition. Sales cycle length tracks deal velocity and identifies where deals stall.
- Accurate underlying data. Dashboards are only as reliable as the data feeding them. In Salesforce environments with low CRM adoption or manual logging requirements, activity data is systematically incomplete—managers see a sanitized view of pipeline that doesn't reflect reality. Activity completeness rates below 70% render most pipeline analytics unreliable.
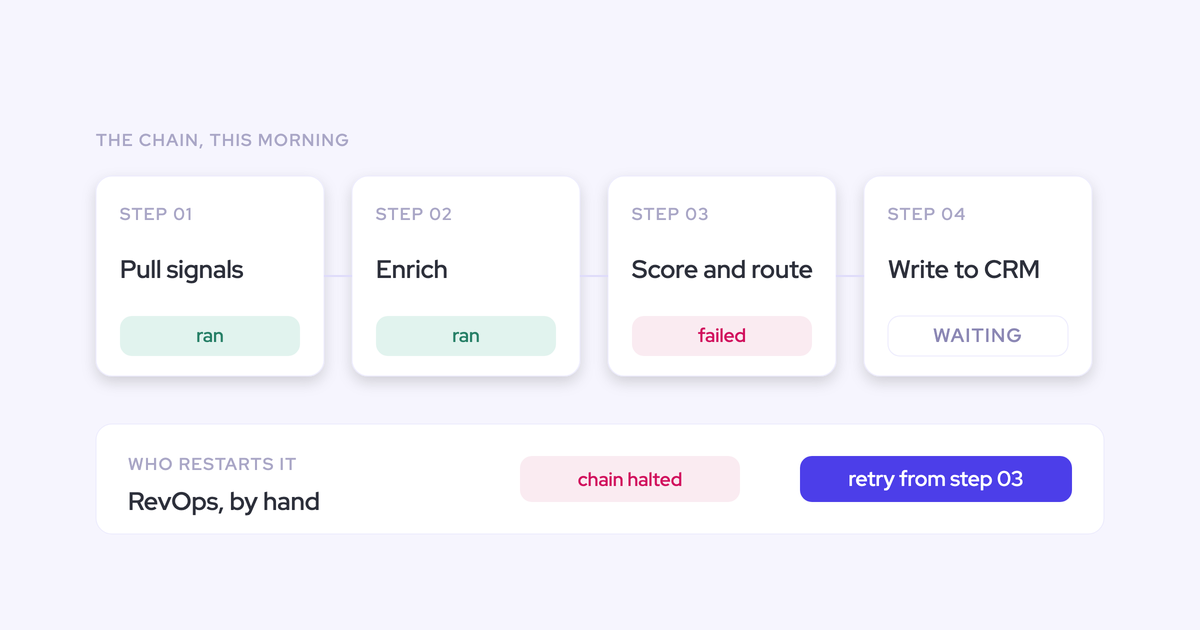
- Clean, automated data capture. The path from "accurate data" to "reliable dashboards" runs through data capture automation. Tools like Weflow automatically capture emails, meetings, and calls and write them to Salesforce records—eliminating the gap between what reps actually do and what shows up in the CRM. When activity data is complete, performance insights reflect reality instead of whatever reps remembered to log.
How to build a sales performance management process (5 steps)
SPM isn't a one-time configuration. It's an operating cadence that connects planning decisions, compensation design, and performance measurement in a continuous loop. Here's how to build one that actually works.
Step 1: Define your sales performance metrics and KPIs
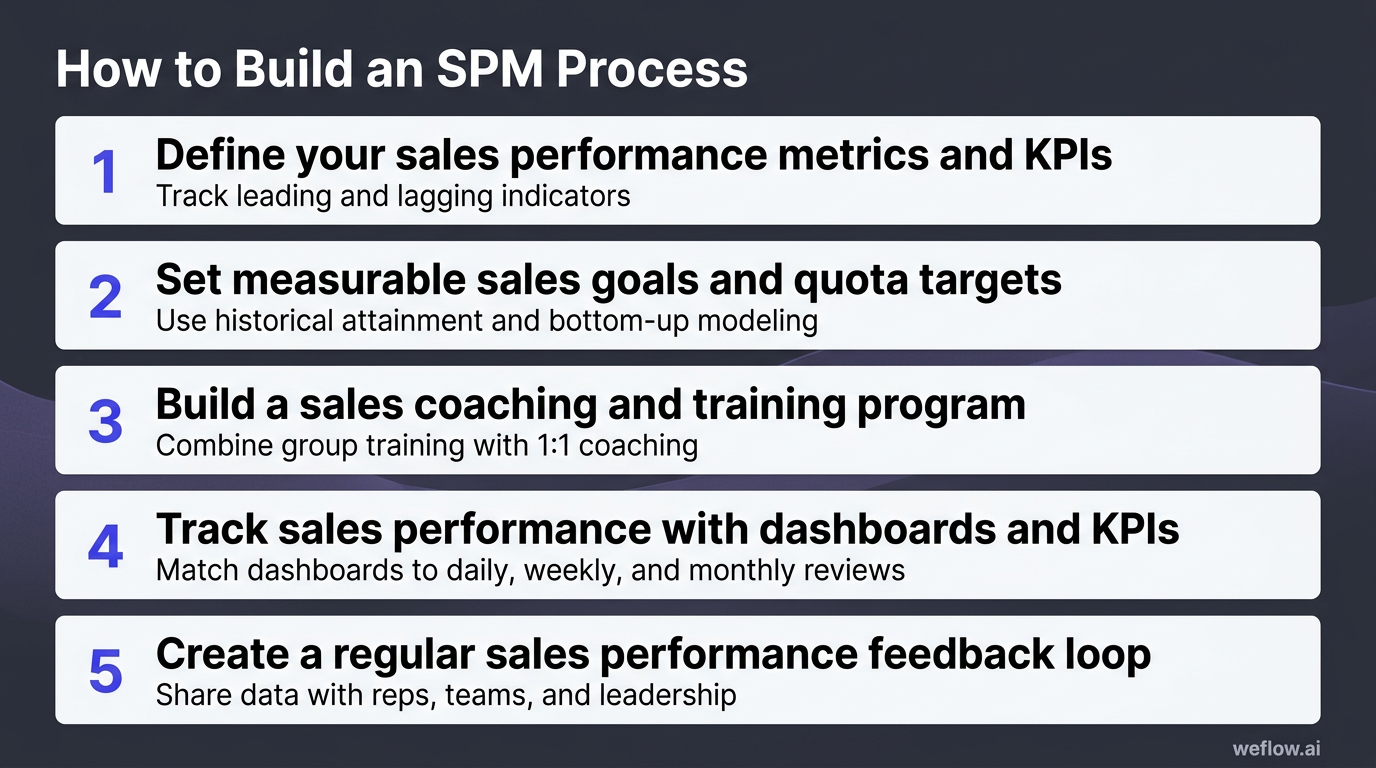
Start by deciding what you'll measure before you decide how. The right KPIs vary by role, segment, and sales motion—but most B2B sales orgs should track a core set that covers both leading and lagging indicators.
| Metric | What It Measures | When to Prioritize It |
|---|---|---|
| Quota attainment | Percentage of revenue target achieved in a given period | Always—it's the primary output metric for the entire SPM system |
| Win rate | Deals won as a percentage of deals entered into a closed stage | When improving deal execution quality or evaluating the effectiveness of a new sales methodology (MEDDIC, BANT) |
| Sales cycle length | Average days from opportunity creation to close | When diagnosing pipeline velocity problems or identifying where deals stall by stage |
| Average deal size | Mean contract value across closed-won opportunities | When evaluating upmarket or downmarket motion changes, or when comp plan changes may be affecting deal quality |
| Pipeline coverage ratio | Total pipeline value divided by remaining quota target | In the first half of any quarter—it's the best early indicator of whether the team has enough opportunity to hit the number |
Step 2: Set measurable sales goals and quota targets
Quota setting is one of the highest-impact and most frequently botched decisions in sales management. Overly ambitious quotas don't motivate top performance—they demoralize mid-tier reps who do the math and conclude the target is unreachable, which is exactly when engagement drops and attrition rises.
Data-driven quota setting starts with historical attainment rates by segment, rep tenure, and territory. If your median rep attains 75% of quota, the problem isn't rep performance—it's quota calibration. A healthy distribution looks like 60–70% of reps hitting quota, with a long tail of overachievers pulling average attainment above 100%. When fewer than 50% of reps hit quota, either targets are set too high or the sales process has a structural problem worth diagnosing before the next planning cycle.
Use bottom-up modeling: start with pipeline coverage ratios by segment, apply historical win rates, and back into quota targets from there. Then cross-check against top-down revenue targets. The gap between the two is a planning conversation, not an assumption to paper over.
Step 3: Build a sales coaching and training program
Coaching is the most direct lever a manager has on individual rep performance—and the one most often sacrificed to pipeline review calls. A structured coaching program requires two distinct formats that serve different purposes:
- Group training. Covers skill development at the team level—sales methodology (MEDDIC, BANT, Challenger), objection handling, competitive positioning, and product knowledge. Works best when anchored to real deal scenarios rather than abstract frameworks. Monthly or quarterly cadence depending on team maturity.
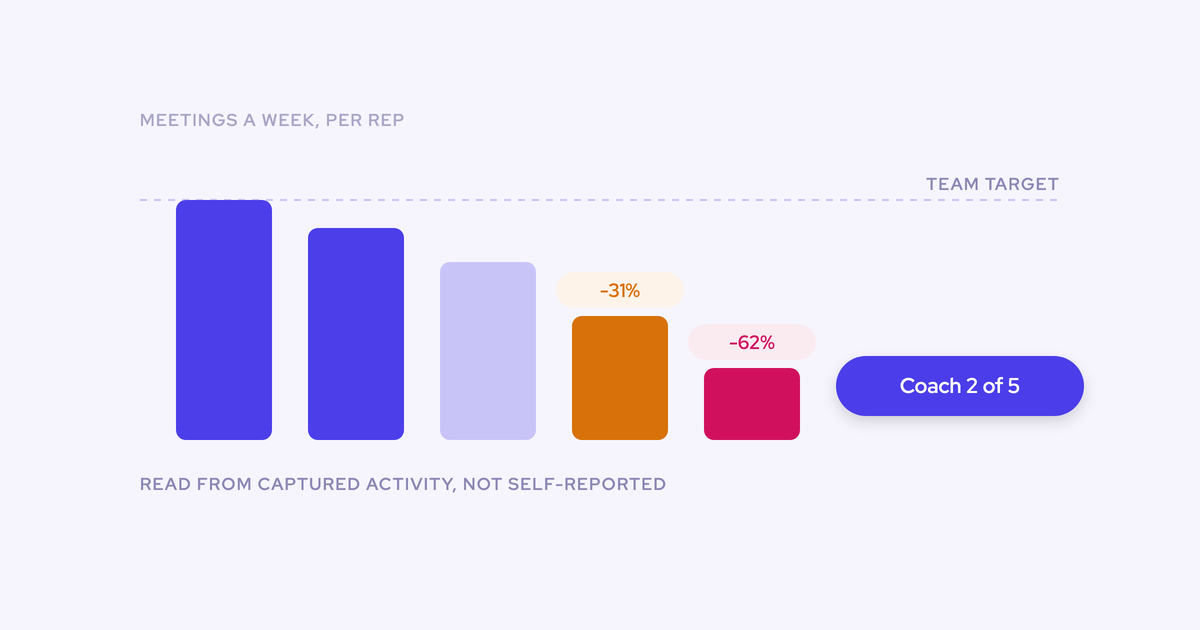
- 1:1 coaching. Deals with individual performance gaps, deal-specific strategy, and career development. Effective 1:1 coaching is data-driven: the manager arrives with specific metrics (win rate by stage, average deal size, call-to-meeting conversion) and specific deal observations rather than general impressions. Weekly 30-minute sessions are the standard for active reps.
The common failure mode is treating all 1:1 time as pipeline review. Pipeline review tells a manager what's happening; coaching conversations change what happens next. Both matter, but they shouldn't occupy the same slot.
Step 4: Track sales performance with dashboards and KPIs
A tracking cadence makes SPM operational. Different metrics belong to different review frequencies—checking quota attainment daily creates noise; checking it monthly creates surprises. Match the metric to the decision it supports.
| Review Cadence | Focus | Example Metrics |
|---|---|---|
| Daily check | Activity and pipeline hygiene | New activities logged, deals with no activity in 7+ days, stage age outliers, overdue tasks |
| Weekly check | Pipeline movement and deal risk | Pipeline coverage ratio, deals moved forward or backward, deals at risk by MEDDIC completeness, commit vs. best-case delta |
| Monthly review | Performance trends and forecast accuracy | Quota attainment by rep and segment, win rate, sales cycle length, forecast accuracy vs. actual close, pipeline waterfall |
Self-service dashboards in Salesforce make this cadence sustainable. Managers can pull deal risk reports before the Monday call instead of spending the first 20 minutes chasing updates.
Step 5: Create a regular sales performance feedback loop
Measurement without communication creates a surveillance system, not a performance management system. Data needs to flow back to the people it's about. That means:
- 1:1 sharing. Bring specific metrics to every manager-rep 1:1. "Your stage 3 to stage 4 conversion rate dropped 12 points this quarter—let's look at the deals where it happened" is a coaching conversation. "How's your pipeline?" isn't.
- Team standups. Share team-level pipeline health and weekly progress toward quota in daily or weekly standups. Visibility creates healthy peer accountability without requiring management enforcement.
- Self-service access. Reps should be able to see their own performance metrics in real time—pipeline coverage, quota attainment, win rate, deal stage distribution. Reps who can see their own data don't need managers to relay it.
- Upward feedback. The feedback loop should run both directions. If 70% of reps miss quota two quarters in a row, the data is telling the revenue org something about territory design, quota calibration, or product-market fit. Build structured channels for reps and managers to flag when the plan's assumptions aren't holding.
5 proven strategies to improve sales team performance
How to build transparency across your sales organization
Transparency in a sales org isn't about publishing everyone's numbers and hoping peer pressure does the work. It's about giving every person in the org—from AE to CRO—an accurate picture of where things stand so they can make better decisions.
In practice, this means three things: consistent pipeline definitions so "Stage 3" means the same thing to every rep and manager; real-time data access so no one is working from a stale export; and shared metrics that connect individual rep activity to team quota and company targets. When reps can see how their pipeline contributes to the team number, and managers can see how team performance rolls up to the forecast, the monthly review becomes a coordination tool instead of a blame assignment exercise.
The prerequisite for all of this is clean Salesforce data. Transparency is impossible when CRM adoption is low and activity data is incomplete.
How to design a sales incentive plan that drives results
The most common incentive plan failure is complexity that obscures the signal. Reps need to be able to answer one question without a spreadsheet: "What is this deal worth to me if I close it this quarter?" If that calculation requires three variables and a footnote, the plan isn't working.
Principles that hold across most B2B sales comp designs:
- Pay at close, not at install or renewal. If the metric is new ARR, the comp event should be new ARR—not a lagging metric the rep can't influence after signature.
- Accelerate above 100%. Tiered commission rates above quota attainment are the most reliable mechanism for pulling quota attainment above 100% at the team level.
- Align SPIFFs to short-term strategic pivots, not pipeline desperation. SPIFFs should fund specific, time-bounded behavior changes—pushing into a new vertical, accelerating a product launch, clearing end-of-quarter pipeline. Used reactively to rescue a bad quarter, they train reps to hold pipeline for the next SPIFF window.
- Review the plan annually. Markets shift, products evolve, and the behaviors the business needs from the sales org change. A plan that worked when the product was an SMB point solution may misalign incentives completely after a move upmarket.
Sales enablement content: equipping reps to close faster
Sales enablement is where strategy meets the deal. Reps who understand their buyers, know how to handle objections, and have the right materials available at the right stage of the deal close faster and at higher rates. The content types that move deals forward most reliably:
- Case studies. Specific, outcome-anchored proof from recognizable companies in the buyer's segment. "A 500-person B2B SaaS company cut their sales cycle by 18% in the first quarter" is useful. "Customers love our product" is not.
- ROI calculators. Interactive tools that let buyers quantify the value of the solution in their specific context. Most useful in mid-to-late stage deals where economic sponsors are scrutinizing the business case. Build them around the metrics that matter to the buyer's function—for RevOps, that means forecast accuracy, data completeness, and rep time saved.
- Competitive battle cards. Structured one-pagers that help reps handle head-to-head comparisons. The best battle cards don't pretend competitors have no strengths—they acknowledge what the competitor does well, identify the scenarios where your product wins on its own terms, and give reps specific talk tracks for the objections they'll actually face.
Using sales leaderboards and gamification to motivate reps
Leaderboards work best when they track leading indicators, not just quota attainment. A leaderboard that shows only closed revenue tells you who's winning—it doesn't give lower performers anything specific to change. Leaderboards that surface activity-level metrics (calls made, demos booked, MEDDIC fields complete) give every rep something to compete on today, not just at end of quarter.
Design guidelines that reduce the common failure modes:
- Track multiple dimensions, not just revenue. A rep can be #1 in pipeline generated but #8 in win rate—both are useful signals.
- Make leaderboards visible to the team, not just managers. Peer visibility is the mechanism by which leaderboards create motivation.
- Refresh data in real time. A leaderboard that's 48 hours stale stops influencing behavior.
- Avoid designing for gaming. If a rep can inflate their position by logging low-quality activities, they will. Track outcomes where possible (meetings completed, opportunities advanced) rather than raw inputs (calls logged).
How sales automation tools boost productivity and data quality
Automation in the sales org serves two purposes that tend to get conflated: saving rep time, and improving data quality. Both matter, but for different reasons.
Time savings is the AE-facing value proposition. The average enterprise AE spends 3–5 hours per week on manual CRM updates—logging calls, updating opportunity fields, writing follow-up summaries, filling in MEDDIC fields after reviews. Automation that eliminates that work gives reps time back for selling without requiring them to change how they run their deals.
Data quality is the RevOps and management value proposition. When reps log their own activity, coverage is incomplete and inconsistent. Automated activity capture tools—Weflow is built specifically to solve this for Salesforce environments—capture emails, meetings, and calls automatically and write structured data back to Salesforce records. The result is a complete, reliable activity layer that managers and RevOps can actually use for deal inspection, coaching, and pipeline analytics. Clean data turns dashboards from decorations into decision tools.
SPM vs. CRM vs. ICM: what's the difference?
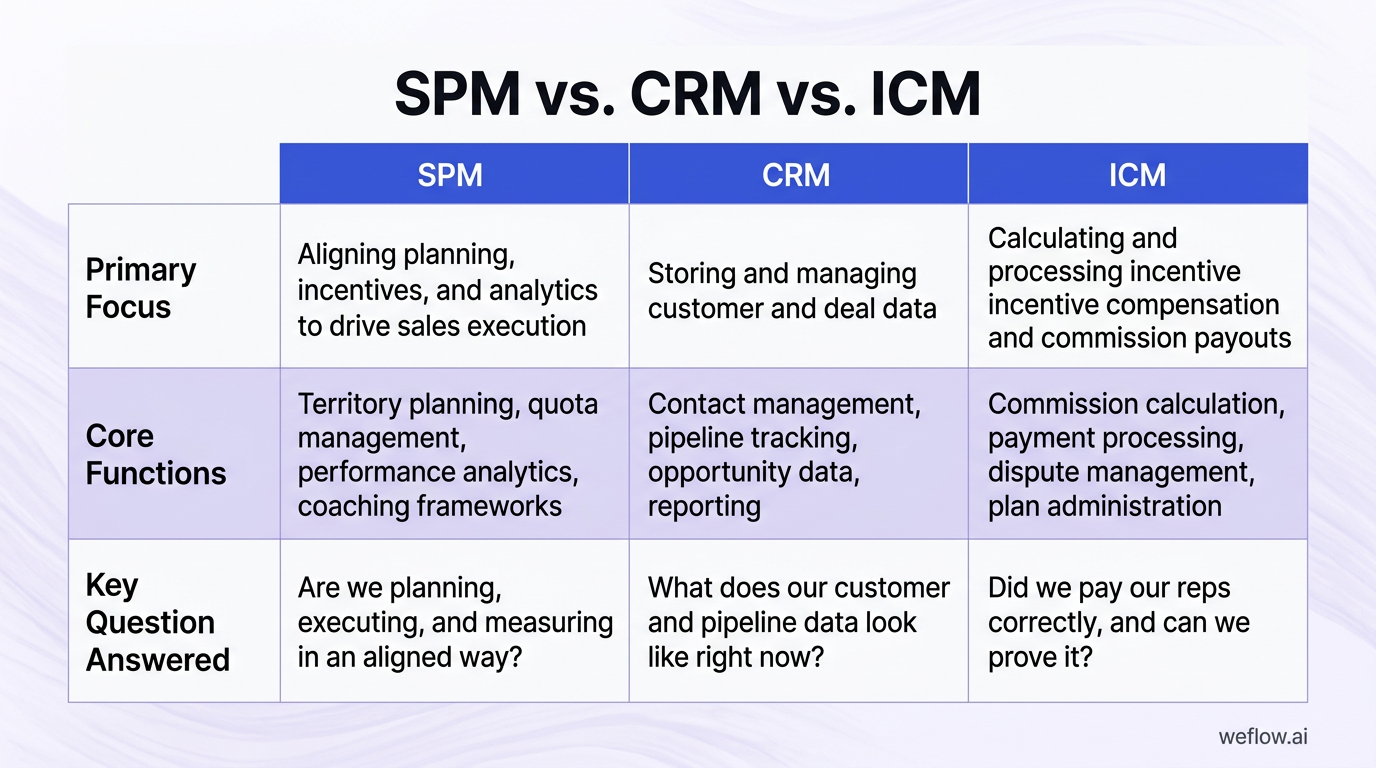
These three acronyms appear in the same conversations but serve different functions. Conflating them leads to buying the wrong tool or expecting a single platform to solve problems it wasn't designed for.
| Function | SPM | CRM | ICM |
|---|---|---|---|
| Primary Focus | Aligning planning, incentives, and analytics to drive sales execution | Storing and managing customer and deal data | Calculating and processing incentive compensation and commission payouts |
| Core Functions | Territory planning, quota management, performance analytics, coaching frameworks | Contact management, pipeline tracking, opportunity data, reporting | Commission calculation, payment processing, dispute management, plan administration |
| Key Question Answered | Are we planning, executing, and measuring in an aligned way? | What does our customer and pipeline data look like right now? | Did we pay our reps correctly, and can we prove it? |
CRM (Salesforce being the dominant platform in mid-market and enterprise B2B) is the data foundation everything else sits on. ICM—incentive compensation management—is a specialized function within the broader SPM framework, focused specifically on making sure comp calculations are accurate and auditable. SPM is the operating system that ties both together with planning and performance measurement. In practice, the best implementations treat Salesforce as the system of record, feed activity and pipeline data into it reliably, and run SPM analytics on top of that data—with ICM handling comp calculations on the same underlying deal data.
What to look for in sales performance management software
SPM software ranges from specialized point solutions (comp management only, territory planning only) to integrated platforms that span the full planning-incentives-analytics stack. The right toolset depends on your org's maturity, Salesforce usage, and where the biggest gaps are. Features that matter most for mid-market and enterprise B2B orgs:
- Automated incentive compensation. Comp calculations that pull directly from Salesforce deal data—not from a manual export. Reduces errors, eliminates disputes, and gives reps self-service visibility into what they've earned.
- Territory and quota planning. Modeling tools that let you run "what if" scenarios on territory design and quota allocation before committing to a plan. Particularly valuable at annual planning time and when adding headcount mid-year.
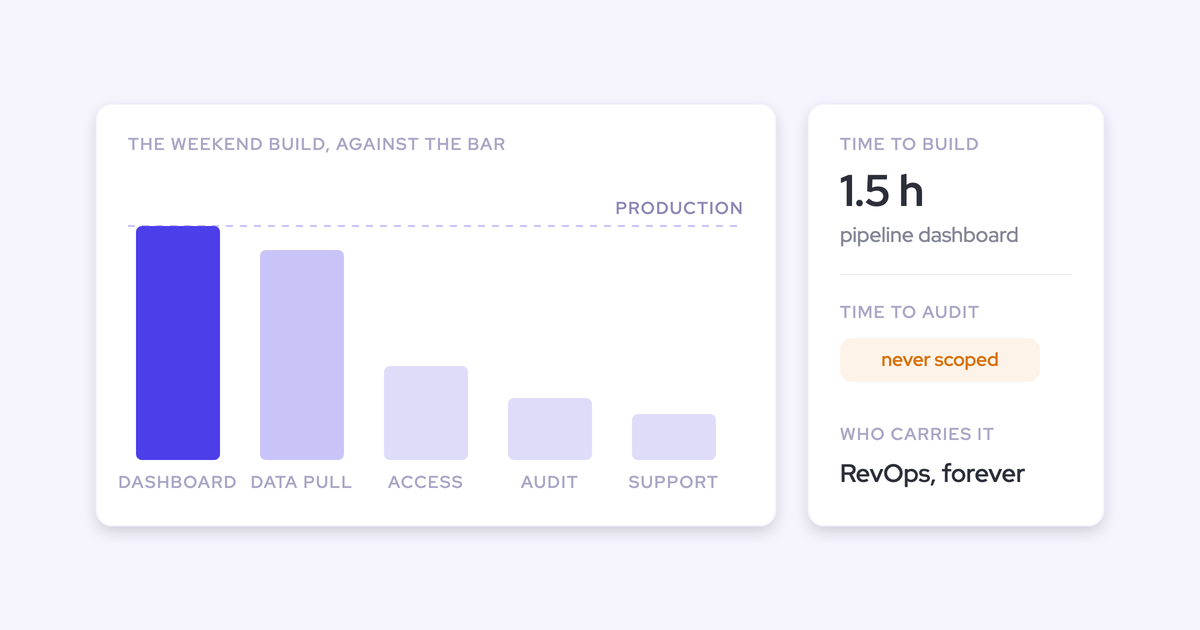
- Real-time dashboards. Performance views that update continuously from live Salesforce data, not nightly syncs. Managers who check pipeline health on Tuesday morning shouldn't be looking at Monday evening's snapshot.
- Predictive analytics. Forecast models that incorporate deal signals, historical win rates, and pipeline coverage to project attainment—not just a sum of the pipeline. The difference between a weighted pipeline report and a predictive model is substantial at the end-of-quarter decision point.
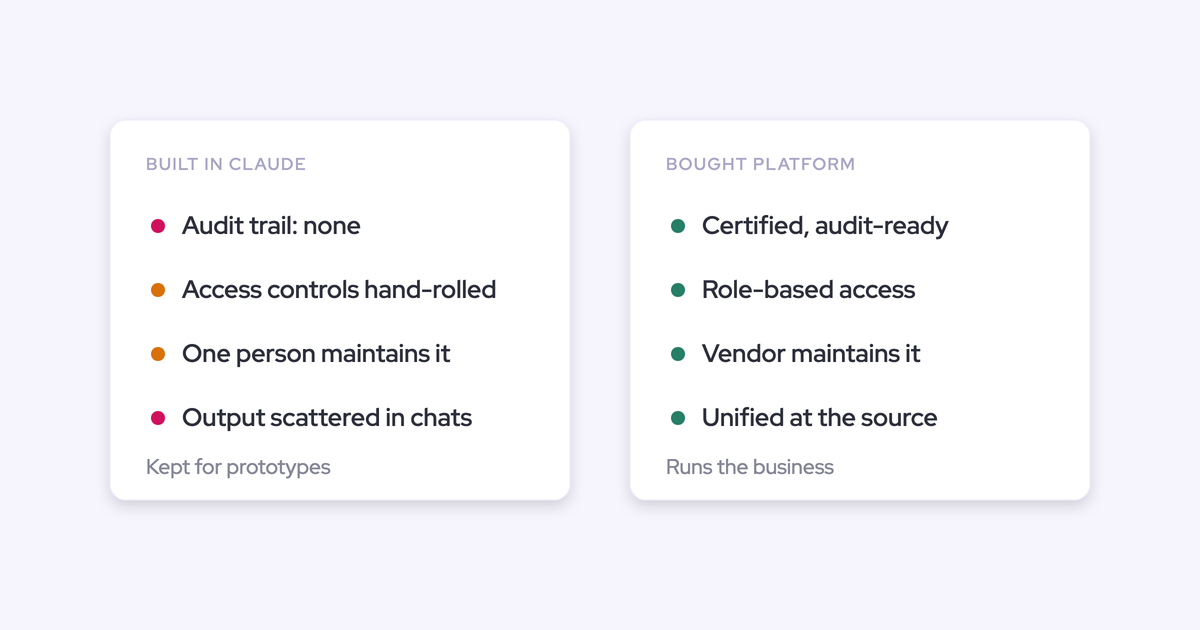
- CRM integration. Deep, bidirectional Salesforce integration that writes back to native objects and respects your validation rules. Shallow integrations that only read from Salesforce—and store data in a proprietary database—create data quality problems that grow over time.
- Scalability. The platform needs to handle your current org size and your planned growth. For global sales orgs, this includes multi-region support, multi-currency, and the ability to manage territory hierarchies across segments without manual workarounds.
How AI and predictive analytics are changing SPM
AI is having its most immediate impact on SPM in two areas: pattern detection at scale, and forward-looking risk identification. Both were theoretically possible before with enough analyst bandwidth—now they're automated.
On pattern detection: AI models trained on historical deal data can identify which combinations of early-stage signals (MEDDIC completeness, meeting frequency, stakeholder engagement, deal size relative to territory average) correlate most strongly with eventual closed-won outcomes. A RevOps team that previously needed to build complex Salesforce reports to surface this can now surface it automatically across the entire pipeline—flagging deals that look healthy on paper but pattern-match to historical losses, and surfacing deals that are further along than their current stage suggests.
On quota attainment risk: AI-driven forecasting models are replacing the "manager judgment plus pipeline roll-up" approach that most revenue orgs still use. Models that incorporate historical attainment rates by rep tenure, territory, and segment; current pipeline coverage ratios; deal velocity signals; and external factors like seasonality can project individual attainment risk weeks before a quarter closes—giving managers enough runway to reallocate pipeline, accelerate coaching on at-risk reps, or adjust the forecast before it's too late to act.
The longer-horizon change is in territory and quota optimization. Most territory design today is annual, manual, and based on last year's performance as a proxy for next year's opportunity. AI models can ingest firmographic data, intent signals, historical win rates by account type, and rep capacity constraints to generate territory designs that balance opportunity more accurately—reducing the variance between "blessed territory" reps and "tough territory" reps that distorts performance data and comp costs. Organizations that close this loop will have a structural planning advantage over those still running territory design in spreadsheets.
Frequently asked questions
What is sales performance management (SPM)?
Sales performance management (SPM) is the integrated discipline of aligning sales planning, incentive compensation, and performance analytics to drive consistent revenue execution. It connects territory design, quota setting, comp structures, and performance measurement into a single operating system rather than managing each in isolation. The goal is to ensure that goals, incentives, and data all point in the same direction.
What are the core components of sales performance management?
The three core components are sales planning (territory management, quota setting, and capacity planning), sales incentive compensation (commission structures, variable pay design, and SPIFFs), and sales analytics (KPI tracking, dashboards, and performance reporting). Each component is necessary but insufficient on its own—SPM's value comes from integrating all three so that compensation reinforces planning decisions and analytics closes the feedback loop.
What is the difference between SPM and CRM?
CRM (Salesforce being the dominant platform in mid-market and enterprise B2B) stores and manages customer and deal data. SPM is the operating layer built on top of that data—handling planning, incentive design, and performance measurement. SPM depends on CRM for reliable underlying data; CRM doesn't require SPM to function, but the insights it produces are only useful if connected to planning and compensation decisions.
What is the difference between SPM and ICM?
Incentive compensation management (ICM) is a specific function within the broader SPM framework, focused on accurately calculating and processing commission payments. SPM encompasses ICM but extends further—covering territory planning, quota management, coaching frameworks, and performance analytics that have nothing to do with comp processing. If you only have ICM, you have accurate paychecks. If you have SPM, you have a system for improving the performance those paychecks are trying to incentivize.
Why is sales performance management important?
Without SPM, planning decisions, compensation structures, and performance data operate independently—and often in conflict. Territory plans get set without visibility into historical win rates by segment. Comp plans reward behaviors that don't align with strategic priorities. Performance data in Salesforce is incomplete, so dashboards don't reflect reality. SPM creates the operating infrastructure that ties all three together, which is why organizations with mature SPM functions consistently outperform on forecast accuracy, quota attainment distribution, and rep retention.
What should I look for in sales performance management software?
Prioritize deep Salesforce integration (bidirectional, writing to native objects), real-time dashboards, automated incentive compensation calculations, territory and quota planning tools, and predictive analytics for forecasting. For mid-market and enterprise B2B orgs, scalability across regions and segments matters as much as feature depth. Evaluate the integration architecture carefully—platforms that store data outside Salesforce create a second source of truth that creates more problems than it solves.
How does AI improve sales performance management?
AI contributes to SPM in three areas: pattern detection (identifying which deal signals correlate with win or loss outcomes across the full pipeline), quota attainment risk prediction (flagging which reps are at risk of missing quota early enough to intervene), and territory optimization (modeling territory designs that balance opportunity more accurately than annual manual processes allow). The common thread is that AI automates analysis that previously required significant analyst bandwidth, making it possible to act on insights at the deal level rather than just the aggregate.
How do you measure sales performance effectively?
Effective measurement requires the right metrics, reliable underlying data, and a review cadence that matches each metric to the decision it informs. The core metrics for most B2B orgs are quota attainment, win rate, sales cycle length, average deal size, and pipeline coverage ratio. Reliable data requires Salesforce activity capture automation—when reps log their own activity manually, coverage is incomplete and the metrics built on top of it are unreliable. Review cadence should be daily for activity hygiene, weekly for pipeline movement and deal risk, and monthly for performance trends and forecast accuracy.

.webp)