Sales Process Mapping: A Step-by-Step Guide for RevOps Teams
Learn sales process mapping step by step for RevOps teams, from stages to exit criteria.




What is sales process mapping?
Sales process mapping is the practice of visually documenting every stage, action, and decision point in your sales cycle. It takes the implicit knowledge your top performers carry in their heads and turns it into an explicit, repeatable framework that every rep can follow.
A sales process map shows the path from first touch to closed-won, including who owns each stage, what actions move deals forward, and what criteria signal readiness to advance. It’s not a CRM stage picklist — it’s a working blueprint that reveals bottlenecks, handoff gaps, and inconsistencies that slow your pipeline.
For RevOps teams managing complex B2B sales cycles, a documented process map becomes the foundation for everything else: onboarding materials, Salesforce automation, coaching frameworks, and forecast accuracy. Without it, you’re building on guesswork.
Why does sales process mapping matter for revenue teams?
A well-built sales process map isn’t a documentation exercise — it’s operational infrastructure. Here’s how it drives measurable impact across your revenue org.
How does a sales process map improve cross-team visibility?
Marketing, sales, and customer success teams often operate with incomplete context about what happens before and after their piece of the journey. A shared process map fixes that.
Marketing can see exactly what qualifies an MQL to become an SQL, so they can tune campaigns toward leads that actually convert. SDRs understand the discovery criteria AEs need, reducing the back-and-forth on whether a lead is truly qualified. Customer success teams know what was promised during the sales cycle, making handoffs cleaner and reducing churn from misaligned expectations.
When everyone works from the same map, cross-functional alignment stops being a quarterly initiative and becomes the default operating mode.
How a sales process map standardizes rep performance
Every sales org has variance. Top performers close at 25%+ win rates while struggling reps hover at 10%. Some of that gap is skill, but much of it comes from inconsistent process execution.
A documented process map establishes the baseline: which discovery questions to ask, what information to capture before proposing, when to involve technical resources. Reps following the documented path hit fewer dead ends. This isn’t about removing judgment — it’s about removing guesswork.
Why sales leaders need a visual sales process map
Pipeline reviews without a shared process map devolve into opinion-trading. The CRO asks “why did this deal slip?” and gets a different answer depending on which rep is presenting.
A visual map gives leaders a common framework for deal inspection. You can ask: “Have we confirmed budget? Who’s the economic buyer?” and everyone knows what those checkpoints mean. Forecast calls become faster because you’re discussing where deals are in a defined process, not interpreting each rep’s personal style.
How sales process maps accelerate new rep onboarding
The average B2B sales rep takes three to six months to ramp to full productivity. Much of that time is spent learning the unwritten rules: which stakeholders to involve, what objections to expect, how to navigate your specific deal stages.
A documented process map compresses ramp time by making the implicit explicit. New hires study the map during their first week and reference it throughout their first quarter. Companies with documented sales processes report 30-50% faster ramp times compared to those relying on shadowing alone.
How to use a sales process map for performance reviews
Quota attainment tells you who hit their number. It doesn’t tell you why some reps succeed while others struggle. A process map enables diagnostic coaching.
During 1:1s, managers can walk through a rep’s recent deals stage by stage: Where did they spend the most time? Which stages had the highest drop-off? This turns reviews from subjective conversations into data-driven coaching sessions.
How process mapping prepares reps for objections and edge cases
Every sales cycle has moments where deals go sideways: unexpected stakeholders surface, pricing objections emerge, legal pushes back on terms. Experienced reps navigate these because they’ve seen them before. New reps stall.
A comprehensive process map includes decision branches for common edge cases: re-engagement sequences when champions go dark, routing paths when legal flags your MSA, escalation protocols for discounting requests. Mapping these scenarios in advance means reps don’t improvise — they execute.
How to create a sales process map (step-by-step)
Building a sales process map that actually gets used requires more than drawing boxes in a flowchart tool. Here’s the sequence that works.
Step 0: Define your sales process mapping goals
Start with the outcome you’re optimizing for. Different goals produce different maps.
If your priority is improving win rate, your map should emphasize qualification criteria and competitive positioning checkpoints. If you’re focused on reducing cycle length, map the handoffs and approval gates that create delays. If pipeline coverage is the issue, focus on the early stages where leads stall or drop.
Common metrics to anchor your mapping work: win rate (percentage of opportunities that close), cycle length (days from opportunity creation to close), pipeline coverage (pipeline value divided by quota), and stage conversion rates (where deals drop off). Define your goal before you start mapping, or you’ll build a document nobody uses.
Step 1: Assemble cross-functional stakeholders
Sales process mapping isn’t a solo project. You need perspectives from every team that touches the revenue cycle.
Who to include:
- Sales leadership: VPs who own quota and know what separates wins from losses
- Account executives: Two to three top performers who can articulate what they actually do
- SDRs/BDRs: They own the lead-to-opportunity handoff
- Marketing: They generate leads; alignment prevents MQL-to-SQL friction
- Customer success: They inherit deals post-close
- Sales enablement: They’ll own training on the new process
- RevOps: You’ll translate the map into Salesforce stages and automation
Run a two-hour working session with this group. Capture everything before moving to formal mapping tools.
Step 2: Define your sales stages and ownership
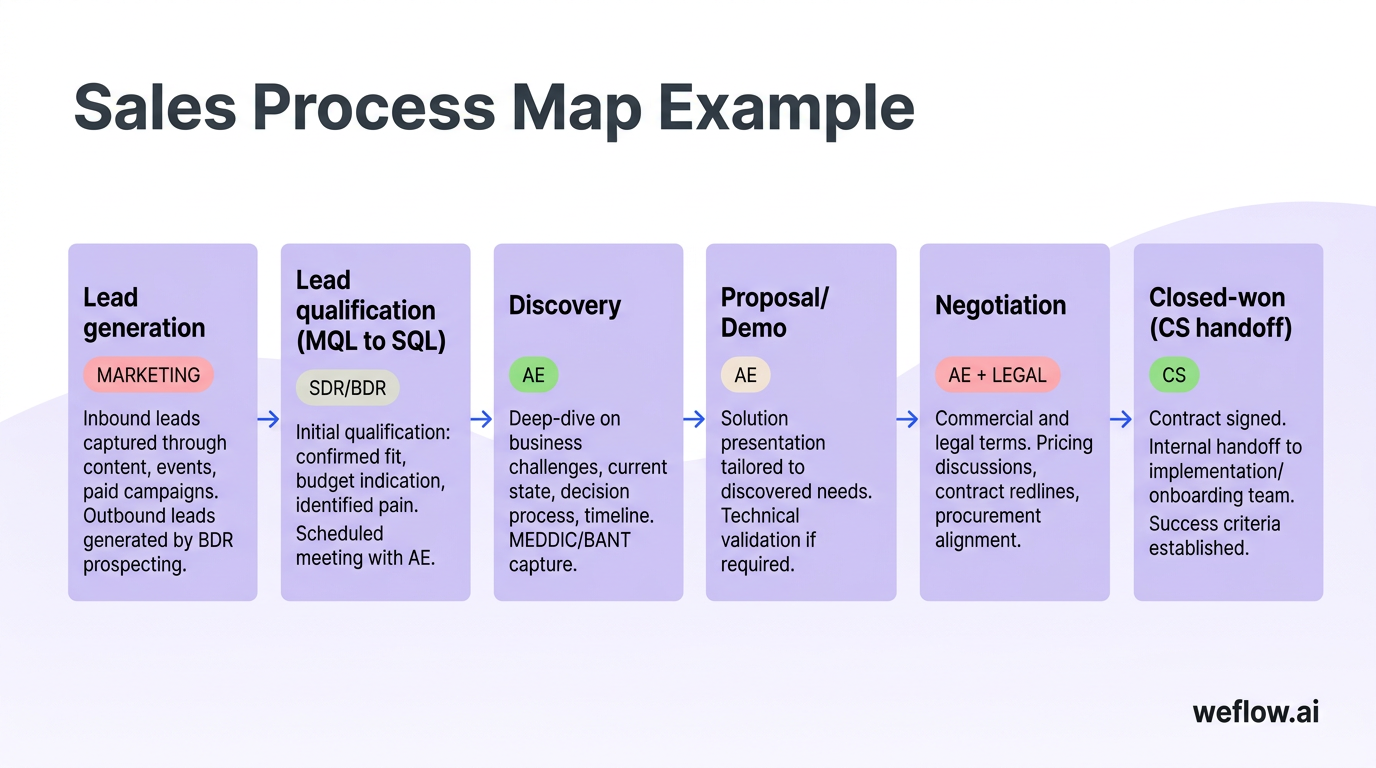
Most B2B sales processes follow a similar arc, but stage names and ownership vary by org. Define yours explicitly.
| Stage | Owner | Description |
|---|---|---|
| Lead generation | Marketing | Inbound leads captured through content, events, paid campaigns. Outbound leads generated by BDR prospecting. |
| Lead qualification (MQL to SQL) | SDR/BDR | Initial qualification: confirmed fit, budget indication, identified pain. Scheduled meeting with AE. |
| Discovery | AE | Deep-dive on business challenges, current state, decision process, timeline. MEDDIC/BANT capture. |
| Proposal/Demo | AE | Solution presentation tailored to discovered needs. Technical validation if required. |
| Negotiation | AE + Legal | Commercial and legal terms. Pricing discussions, contract redlines, procurement alignment. |
| Closed-won (CS handoff) | CS | Contract signed. Internal handoff to implementation/onboarding team. Success criteria established. |
Map your actual stages, not an idealized version. If your real process has seven stages, document seven stages. If different segments follow different paths, map each path separately.
Step 3: Set entry and exit criteria for each stage
Stages without criteria are just labels. Reps will push deals forward based on vibes, and your pipeline becomes unreliable.
Entry criteria define what must be true for a deal to enter a stage. Exit criteria define what must be completed before it advances. Make these specific — not “good conversation” but “confirmed budget range and timeline.”
| Stage | Entry criteria | Exit criteria |
|---|---|---|
| Discovery | Meeting scheduled with decision-involved contact. Company fits ICP (industry, size, tech stack). | Pain confirmed and quantified. Decision process mapped. Timeline established. Champion identified. |
| Proposal/Demo | Discovery complete. Use case validated. Technical requirements understood. | Solution presented to buying committee. Next steps agreed. Objections surfaced and addressed. |
| Negotiation | Verbal commitment to proceed. Budget confirmed. Decision-maker engaged. | Commercial terms agreed. Legal review complete. Signature timeline confirmed. |
| Closed-won | Contract signed. Payment terms established. | Handoff meeting completed. Implementation kickoff scheduled. Success metrics defined. |
These criteria become the foundation for Salesforce validation rules, required fields, and pipeline inspection frameworks.
Step 4: Build the visual sales process flowchart
With stages and criteria defined, translate the process into a visual format your team can reference daily.
Tools to consider:
- Lucidchart: Enterprise-ready with Salesforce and Confluence integrations. Good for complex, multi-path processes.
- Miro: Collaborative whiteboarding. Best for initial mapping sessions with stakeholders.
- Mural: Similar to Miro with strong facilitation features for workshops.
- Whimsical: Clean, simple interface. Good for straightforward linear processes.
- Creately: Template library with pre-built sales process diagrams. Faster to start.
Best practices for the visual:
- Use consistent shapes: rectangles for stages, diamonds for decision points, arrows for flow direction
- Color-code by owner: marketing in blue, sales in green, CS in purple
- Include entry/exit criteria as annotations or linked detail views
- Keep the main view high-level; use drill-down documents for detailed playbooks
Step 5: Track sales metrics and optimize over time
A process map is a living document. Build measurement into your workflow so you can identify what’s working and what needs adjustment.
| Metric | What it measures | Stage relevance |
|---|---|---|
| Win rate | Percentage of opportunities that close | Overall process effectiveness; compare by entry point, rep, segment |
| Quota attainment | Revenue closed vs. target | Overall sales productivity; reveals capacity and coverage issues |
| Pipeline coverage | Pipeline value divided by quota | Lead generation and early qualification stages |
| Lead-to-opportunity conversion | Percentage of leads becoming qualified opportunities | MQL-to-SQL handoff; SDR qualification effectiveness |
| Sales cycle length | Days from opportunity creation to close | All stages; identify where deals stall |
| Average deal size | Mean revenue per closed deal | Negotiation stage; pricing and discounting patterns |
| Stage conversion rates | Percentage of deals advancing from one stage to the next | Each individual stage; pinpoints drop-off points |
Review these metrics monthly. When conversion drops at a specific stage, revisit the process map: Are the exit criteria realistic? Is the stage too broad? Expect to revise your map quarterly as you learn from data.
Sales process mapping examples: flowcharts, swimlanes, and infographics
Different visualization formats serve different purposes. Here are the three most common approaches and when to use each.
Linear sales process flowchart
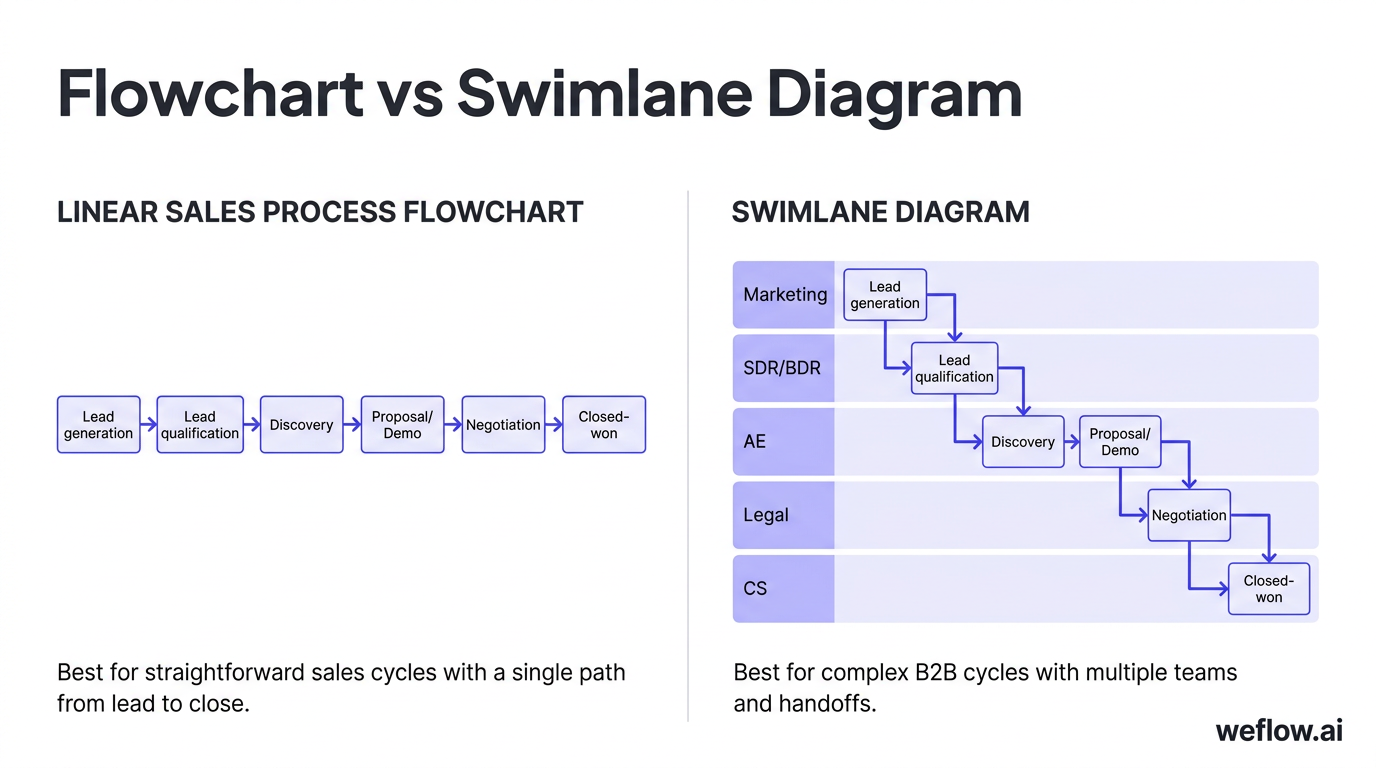
A linear flowchart shows stages in sequence from left to right or top to bottom. Each stage connects to the next with a single arrow, and decision points branch into yes/no paths.
When to use it: Straightforward sales cycles with a single path from lead to close. Works well for transactional sales, SMB deals, or as a high-level overview before drilling into detailed formats.
Limitations: Breaks down when your process has multiple parallel tracks or complex handoffs.
Swimlane diagram
A swimlane diagram divides the canvas into horizontal or vertical lanes, one per team or role. Process steps appear in the lane of whoever owns that step. Arrows cross lanes to show handoffs.
When to use it: Complex B2B sales cycles with multiple teams involved. The format makes ownership explicit and highlights handoff points — where deals often stall or information gets lost.
Advantages: Immediately reveals bottlenecks (lanes with too many steps) and dependencies (steps requiring handoffs from multiple lanes).
Infographic-style map
An infographic-style map uses icons, illustrations, and design elements to make the process visually engaging. It prioritizes accessibility over technical precision.
When to use it: Onboarding materials, sales kickoff presentations, or contexts where the map needs to be understood quickly. Good for building awareness; less useful for day-to-day reference.
Caution: Don’t prioritize design over clarity. Test with new hires: can they explain the process after looking at the map for two minutes?
How to align your sales process map with the buyer journey
Your sales process exists to serve the buyer’s journey, not the other way around. Misalignment between how you sell and how your customers buy creates friction that kills deals.
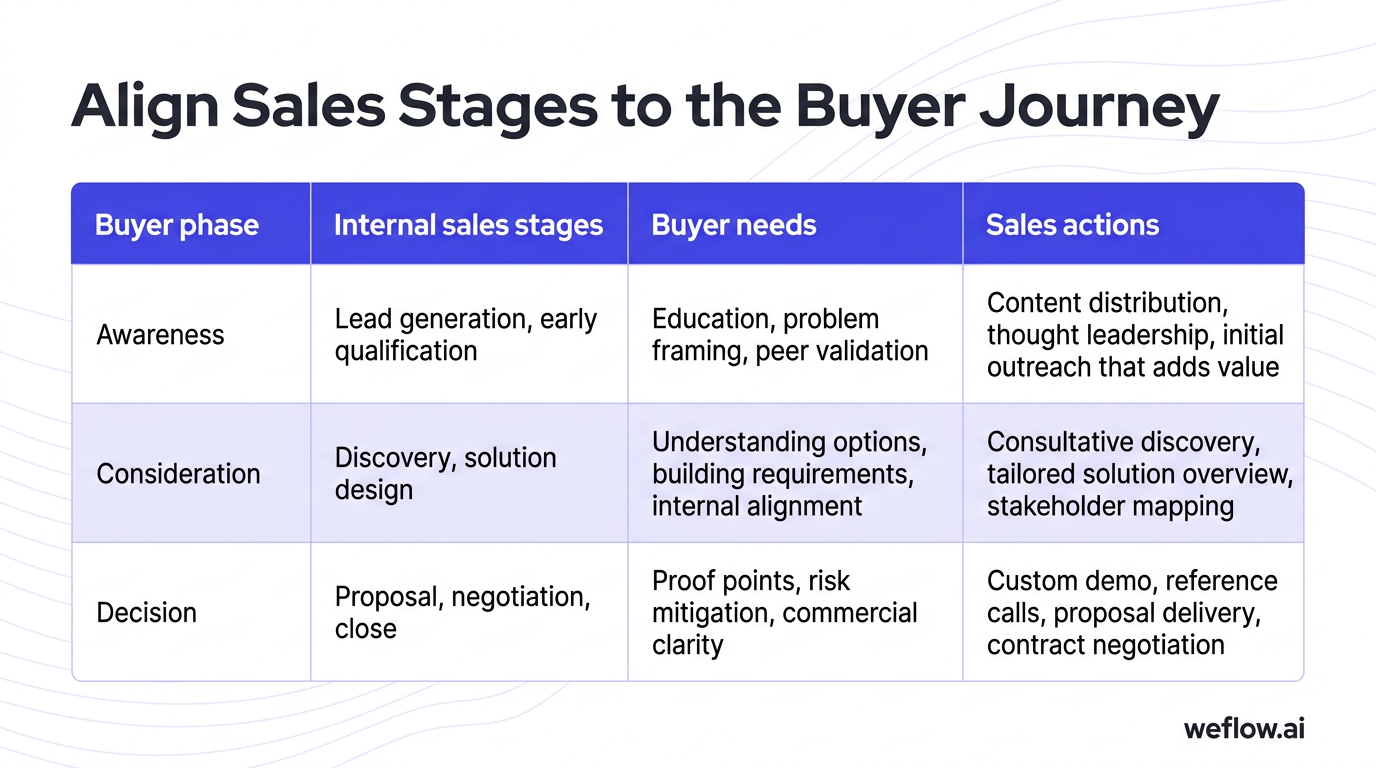
Most B2B buyer journeys follow three phases: Awareness (recognizing a problem, researching options), Consideration (evaluating solution categories, building requirements), and Decision (shortlisting vendors, running demos, negotiating terms).
Here’s how to map your internal stages to these buyer phases:
| Buyer phase | Internal sales stages | Buyer needs | Sales actions |
|---|---|---|---|
| Awareness | Lead generation, early qualification | Education, problem framing, peer validation | Content distribution, thought leadership, initial outreach that adds value |
| Consideration | Discovery, solution design | Understanding options, building requirements, internal alignment | Consultative discovery, tailored solution overview, stakeholder mapping |
| Decision | Proposal, negotiation, close | Proof points, risk mitigation, commercial clarity | Custom demo, reference calls, proposal delivery, contract negotiation |
Alignment principles:
- Match urgency to readiness. If a buyer is still in awareness and you push a demo, you’ll lose them. If they’re ready to decide and you’re still doing discovery, you’ll frustrate them.
- Equip reps with phase-appropriate content. Early-stage buyers need educational assets. Late-stage buyers need ROI calculators and customer stories.
- Build buyer-stage checkpoints into your entry criteria. “Has the buyer confirmed they’re evaluating solutions?” belongs in your discovery exit criteria.
- Track buyer engagement signals alongside deal stages. A deal in “proposal” stage with a buyer who’s gone silent isn’t actually in proposal — it’s stalled.
Review your process map through the buyer’s eyes and adjust until the internal process serves the external journey.
How to streamline your sales process with CRM automation
A documented process map is step one. Making that process executable — and enforceable — requires CRM automation. Here’s where to focus.
Automate sales activity logging in your CRM
Manual activity logging is where process compliance goes to die. Reps skip updates when they’re busy, and your pipeline data becomes unreliable.
Activity capture tools automatically sync emails, calendar events, and call data to Salesforce records. Instead of relying on reps to log every touchpoint, the system captures interactions in the background and associates them with the right contacts and opportunities.
Weflow, for example, tracks emails, meetings, and notes and syncs them directly to Salesforce Task and Event objects. Reps stop spending 30 minutes a day on CRM data entry; managers get a complete picture of deal activity without chasing for updates.
Build custom pipeline views for faster deal reviews
Standard Salesforce list views don’t support the kind of pipeline inspection that catches at-risk deals early. Build views aligned to your process map.
Create filtered views by stage, days-in-stage, and missing required fields. Set up dashboards that highlight deals approaching stage thresholds without expected activities. These custom views turn your process map into a management tool — weekly pipeline reviews focus on exceptions, not reviewing every deal from scratch.
Use note templates to reinforce your sales methodology
If your process requires MEDDIC or another qualification framework, embed it in how reps capture notes.
Standardized note templates prompt reps to capture the right information at each stage. A discovery call template might include fields for Metrics, Economic Buyer, Decision Criteria, Decision Process, Identified Pain, and Champion. This enforces methodology compliance without manual policing and creates structured data managers can use for coaching and forecasting.
Key takeaways: Making your sales process map work
- Start with outcomes, not stages. Define the metrics you’re optimizing — win rate, cycle length, pipeline coverage — before you map the process. The goal shapes the design.
- Document entry and exit criteria for every stage. Stages without criteria are labels. Criteria create accountability and make your pipeline data reliable.
- Align internal stages to the buyer journey. Your process should serve how customers buy, not how you want to sell. Map seller actions to buyer needs at each phase.
- Use automation to enforce, not just document. Activity capture, required fields, and validation rules turn your map from a reference document into operational infrastructure.
- Review and revise quarterly. Process mapping isn’t a one-time project. Track stage conversion rates, identify bottlenecks, and update the map as your business evolves.
Frequently asked questions
What is the difference between a sales process and a sales process map?
A sales process is the sequence of stages and actions your team follows to close deals. A sales process map is the visual documentation of that process — the diagram that shows stages, ownership, decision points, and criteria. Every sales org has a process, even if it’s implicit and inconsistent. The map makes it explicit and repeatable.
What are the key stages in a sales process map?
Most B2B sales process maps include lead generation, lead qualification, discovery, proposal/demo, negotiation, and closed-won. The exact stages depend on your sales motion — a transactional SMB sale might have four stages while an enterprise deal might have eight. Define stages based on the distinct activities and checkpoints in your actual cycle, not a template.
How often should you update your sales process map?
Review your map quarterly and update it when you see significant changes in stage conversion rates, win rates, or cycle length. Major updates typically happen when you enter a new market segment, launch a new product, or restructure your sales org. Minor refinements — adjusting criteria, clarifying ownership — should happen whenever the data suggests something isn’t working.
What tools can you use to create a sales process map?
Lucidchart and Miro are popular for collaborative diagramming with stakeholders. Whimsical works well for simpler linear processes. Mural excels for workshop-style mapping sessions. Creately offers pre-built templates that speed up initial drafts. For enterprise Salesforce environments, some teams build the map directly in Salesforce using process builder documentation or third-party add-ons.
What is the difference between a sales process flowchart and a swimlane diagram?
A flowchart shows stages in sequence with decision branches but doesn’t explicitly show who owns each step. A swimlane diagram adds horizontal or vertical lanes for each role or team, making ownership and handoffs visible. Use a flowchart for simple processes with clear single ownership; use swimlanes when multiple teams are involved and handoff visibility matters.
How does sales process mapping improve rep onboarding?
New reps can study the map to understand what happens at each stage, what criteria must be met, and what actions drive deals forward. Instead of learning through shadowing and tribal knowledge over three to six months, they have a documented reference from day one. Companies with documented processes report 30-50% faster ramp times because new hires spend less time figuring out “how things work here.”
How do you align a sales process map with the buyer journey?
Map your internal stages to the buyer’s awareness, consideration, and decision phases. At each stage, define what the buyer needs (education, options evaluation, risk mitigation) and what sales actions serve those needs. Build buyer-readiness checkpoints into your entry criteria — for example, “buyer has confirmed they’re actively evaluating solutions” before moving to the proposal stage.