

Sales Velocity: Formula, Calculation, and 8 Ways to Improve It
What is sales velocity? (Definition, formula, and why it matters)
Sales velocity measures how fast your team generates revenue. It tells you the dollar value of pipeline moving through your sales process per day, week, or month—giving RevOps leaders and CROs a single number that captures pipeline health, team efficiency, and revenue predictability.
The formula:
Sales Velocity = (Number of Opportunities x Average Deal Value x Win Rate) / Sales Cycle Length

Each variable pulls its weight:
- Number of opportunities — How many qualified deals are in your pipeline
- Average deal value — The typical contract size you close
- Win rate — The percentage of opportunities that convert to closed-won
- Sales cycle length — The average number of days from opportunity creation to close
The result is a velocity figure in dollars per time period. A team with $8,000/day in sales velocity generates roughly $2.9M annually—assuming consistent execution.
Why sales velocity matters for pipeline health and forecasting
Sales velocity connects four metrics that are often tracked in isolation. When you combine them into a single measure, patterns emerge that individual metrics miss:
- Forecast accuracy improves — Velocity trends predict future revenue better than pipeline snapshots. A declining velocity signals trouble before deals slip.
- Pipeline gaps surface earlier — If velocity drops while pipeline coverage looks healthy, your deals are either smaller, slower, or less likely to close.
- Coaching becomes targeted — Comparing velocity across reps shows who needs help with deal size versus win rate versus cycle time.
- Resource allocation sharpens — Marketing can tie campaign performance to velocity impact, not just MQL volume.
Revenue teams running Salesforce can pull velocity metrics directly from Opportunity data—assuming activity capture and stage hygiene are solid. Weflow automates Salesforce data capture and deal signal tracking, so the inputs to your velocity calculation stay accurate without manual entry.
Sales velocity vs. pipeline velocity vs. inventory velocity
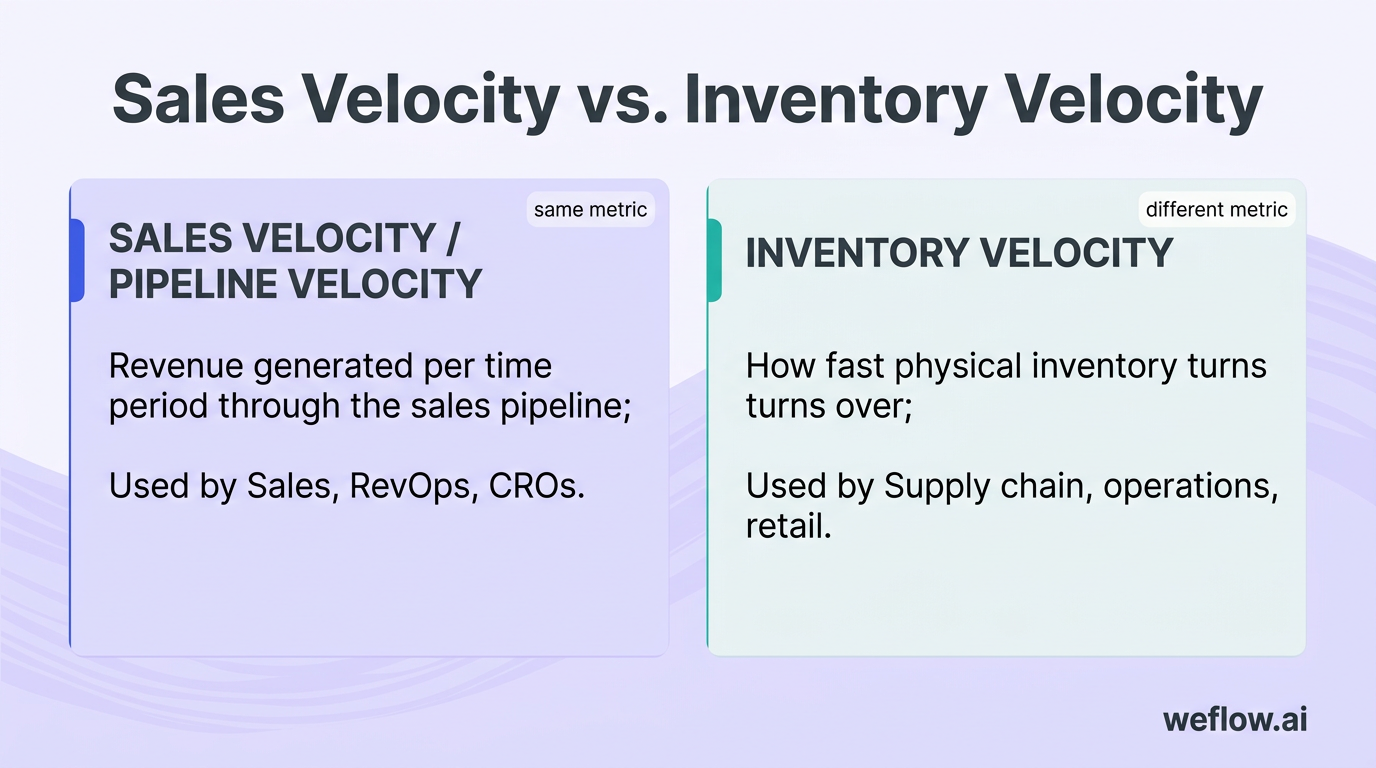
Sales velocity and pipeline velocity are the same thing. Both terms describe the speed at which revenue moves through your sales pipeline. Use whichever term your organization prefers—the formula and interpretation are identical.
Inventory velocity is different. It measures how quickly a company sells and replaces physical stock—relevant for retail, manufacturing, and distribution businesses. The formula (Cost of Goods Sold / Average Inventory) tracks operational efficiency, not revenue generation speed.
| Metric | What it measures | Who uses it |
|---|---|---|
| Sales velocity / Pipeline velocity | Revenue generated per time period through the sales pipeline | Sales, RevOps, CROs |
| Inventory velocity | How fast physical inventory turns over | Supply chain, operations, retail |
For B2B revenue teams, sales velocity is the metric that matters. The rest of this article focuses exclusively on that calculation.
How to calculate sales velocity (formula + worked example)
Getting an accurate velocity number requires clean data for each variable. Here’s how to define and measure each component.
What counts as a qualified opportunity in the sales velocity formula?
Only count opportunities that meet your qualification criteria—typically deals that have passed discovery and entered a stage where sales actively works them. Including unqualified leads inflates your opportunity count and distorts velocity.
Most B2B organizations define a qualified opportunity as one that has:
- A confirmed business need and timeline
- An identified decision-maker or buying committee
- Budget authority (even if not yet allocated)
- Moved past initial qualification (Stage 2+ in most Salesforce configurations)
The specific criteria depend on your sales methodology. MEDDIC teams require Champion and Economic Buyer identification. BANT-focused orgs emphasize budget and timeline. Whatever framework you use, apply it consistently when pulling opportunity counts.
Weflow’s AI agents automatically capture and update qualification fields like MEDDIC criteria from sales conversations, so your opportunity data reflects actual deal status—not what reps remember to log.
How average deal size affects sales velocity
Average deal value (ADV) directly multiplies your velocity. A 20% increase in deal size produces a 20% increase in velocity, assuming other variables stay constant.
Calculate ADV by dividing total closed revenue by number of closed deals over your measurement period. Use the same timeframe you’ll use for velocity tracking—typically 90 to 180 days for statistical validity.
Watch for segment distortion. If your team sells to both SMB and enterprise, a blended average hides meaningful differences. An enterprise deal at $150,000 and an SMB deal at $15,000 produce an average of $82,500—a number that describes neither segment accurately. Calculate velocity separately by segment for useful insights.
How win rate impacts your sales velocity calculation
Win rate represents the percentage of opportunities that convert to closed-won revenue. It’s calculated as: (Closed-Won Opportunities / Total Closed Opportunities) x 100.
The denominator matters. Include only opportunities that reached a terminal state (won or lost) during your measurement period. Excluding lost deals—or including still-open opportunities—inflates your win rate and overstates velocity.
Typical B2B win rates range from 15% to 30%, depending on deal size, market maturity, and lead source. Inbound-sourced opportunities often convert at 2x to 3x the rate of outbound.
Win rate is the variable most affected by data quality. If reps don’t update opportunities to closed-lost when deals die, your win rate looks artificially high. Automated activity capture helps—when Weflow detects extended inactivity on a deal, AI-powered deal signals flag it as at-risk before it slips through the cracks.
Why sales cycle length is the most critical velocity variable
Sales cycle length sits in the denominator—so reducing it accelerates velocity more directly than increasing the numerator variables. Cut your cycle from 60 days to 45 days (a 25% reduction) and velocity jumps 33%, assuming everything else stays flat.
Calculate average cycle length as the mean number of days from opportunity creation to close across your won deals. Some teams measure from first activity to close; others use SQL creation date. Pick a definition and stick with it.
Cycle length varies dramatically by segment:
| Segment | Typical cycle length |
|---|---|
| SMB (under $10K ACV) | 14–30 days |
| Mid-market ($10K–$100K ACV) | 30–90 days |
| Enterprise ($100K+ ACV) | 90–180+ days |
Long cycles compound the impact of poor pipeline hygiene. A deal that should be marked closed-lost but sits open for 60 extra days drags down your velocity calculation. Pipeline inspection tools that surface stalled deals—like Weflow’s configurable deal warnings—help RevOps maintain accurate cycle data.
Sales velocity worked example: B2B SaaS calculation
Here’s a concrete example for a mid-market SaaS sales team:
- Number of opportunities: 50 qualified deals in pipeline
- Average deal value: $12,000 ACV
- Win rate: 30%
- Sales cycle length: 45 days
Sales Velocity = (50 x $12,000 x 0.30) / 45 = $180,000 / 45 = $4,000 per day
This team generates $4,000 in daily revenue velocity. Over a 90-day quarter, that translates to $360,000 in expected closed revenue—assuming performance remains consistent.
Now see how improving one variable changes the outcome:

| Scenario | Change | New velocity | Impact |
|---|---|---|---|
| Baseline | — | $4,000/day | — |
| Add 10 opportunities | 60 opps (20% increase) | $4,800/day | +20% |
| Increase deal size | $14,400 ADV (20% increase) | $4,800/day | +20% |
| Improve win rate | 36% (20% increase) | $4,800/day | +20% |
| Shorten cycle | 36 days (20% reduction) | $5,000/day | +25% |
Notice that a 20% reduction in cycle length produces a 25% velocity gain—larger than equivalent improvements to the numerator variables. That’s because cycle length operates in the denominator.
Best practices for measuring sales velocity accurately
Velocity calculations only help if the inputs are reliable. Follow these practices:
- Use consistent time periods — Measure all four variables over the same timeframe. A 90-day rolling window works for most teams; high-velocity SMB sales might use 30 days.
- Segment by market — Calculate separate velocities for SMB, mid-market, and enterprise. Blended numbers hide meaningful differences.
- Include only qualified opportunities — Deals that haven’t passed discovery don’t belong in your velocity calculation.
- Measure over four or more months — Short timeframes produce noisy data. Velocity trends matter more than any single snapshot.
- Automate data capture — Manual CRM updates lag reality. Weflow captures activities, meetings, and conversation data automatically, keeping your Salesforce records current without rep effort.
- Track velocity by rep and team — Company-wide velocity masks performance variation. Segment by manager and individual to spot coaching opportunities.
8 proven ways to increase sales velocity
Each velocity variable offers levers for improvement. Here are eight strategies that work across B2B organizations.
Generate more qualified pipeline opportunities
More qualified deals in the numerator directly increase velocity—but only if quality stays high. Filling the pipeline with unqualified opportunities adds noise without accelerating revenue.
Focus on:
[banner type="download" url="https://www.weflow.ai/content/sales-enablement-cheat-sheet" text="Sales Enablement Cheat Sheet" subtitle="Coach reps on the deal behaviors that actually move win rates" button="Get the cheatsheet"]
- Tightening MQL-to-SQL criteria — Work with marketing to define qualification gates that predict conversion. Leads that match your ICP and show buying intent deserve sales attention; others don’t.
- AI-enhanced lead scoring — Modern scoring models weigh engagement patterns, firmographic fit, and behavioral signals to prioritize high-probability opportunities.
- Outbound targeting — Direct outreach to accounts matching your ideal customer profile produces higher-quality pipeline than broad-based lead gen.
- Partner and referral channels — Referred opportunities typically convert at 2x to 4x the rate of cold outbound.
Quality compounds. A smaller pipeline of well-qualified deals often produces higher velocity than a bloated pipeline full of long-shot opportunities.
Improve win rates with better qualification and coaching
Win rate improvements come from two sources: better qualification (avoiding deals you won’t win) and better execution (winning deals you should win).
On qualification:
- Uncover the full buying committee early — Single-threaded deals die when your champion leaves or loses influence. Map the economic buyer, decision-makers, and potential blockers in discovery.
- Involve the decision-maker before proposal — If the economic buyer hasn’t engaged by the time you present pricing, your win rate drops significantly.
- Establish clear next steps on every call — Deals without scheduled next actions stall. Weflow’s AI automatically captures and tracks next steps from conversation transcripts.
On execution:
- Ongoing coaching based on conversation data — Review call recordings to identify skill gaps. Weflow’s AI coaching scores calls against methodology frameworks (MEDDIC, SPICED, Challenger) and surfaces specific improvement areas.
- Structured deal reviews — Weekly pipeline reviews focused on at-risk deals catch problems while there’s time to fix them.
Increase average deal value through upsells and value-based selling
Larger deals improve velocity without requiring more opportunities or faster cycles. Three approaches work:
- Value-based negotiation — Anchor pricing conversations to business outcomes, not feature comparisons. A solution that saves $500K annually justifies a $100K price tag; a list of features doesn’t.
- Upsells and cross-sells — Expand scope during the sales process. If a prospect needs your core product, they likely need adjacent capabilities too. Bundle them into the initial deal rather than leaving money for a future expansion.
- Better qualification to avoid discount-driven buyers — Some prospects will never pay full price. Identifying them early prevents wasted cycles on deals that erode margins.
Watch the tradeoff. Pushing for larger deals can extend sales cycles, partially offsetting the velocity gain from higher deal values. Test whether your team can increase ADV without proportionally lengthening cycles.
Shorten your sales cycle with automation and enablement tools
Cycle length sits in the denominator, so reductions here have outsized impact on velocity. Target friction points that slow deals down:
- E-signature tools — Remove contract turnaround delays. Modern e-sign platforms (DocuSign, PandaDoc) cut signing time from days to hours.
- Scheduling automation — Eliminate the back-and-forth of booking meetings. Calendar links and AI scheduling assistants compress time between touchpoints.
- Sales enablement platforms — Give reps instant access to case studies, competitive battlecards, and proposal templates. Searching for content wastes selling time.
- Automated CRM data capture — Manual Salesforce updates slow reps down and introduce delays in pipeline visibility. Weflow captures emails, meetings, and call data automatically—reps stay focused on selling while leadership gets real-time deal status.
Track where deals stall by stage. If opportunities pile up between demo and proposal, that’s where to focus automation and enablement investment.
Align sales and marketing to accelerate pipeline velocity
Misalignment between sales and marketing creates friction that slows deals. Alignment accelerates them.
- Shared ICP definitions — Marketing and sales should agree on what makes a good-fit account. When marketing sources leads that sales doesn’t want to work, velocity suffers.
- Marketing-produced sales collateral — Give reps content that addresses buyer questions at each stage: ROI calculators, technical documentation, customer stories. Reps shouldn’t be creating decks from scratch.
- Feedback loops — Sales needs to tell marketing which content works and which leads convert. Marketing needs to tell sales which campaigns are generating pipeline. Weekly syncs between the teams keep both sides informed.
Velocity is a shared outcome. When marketing optimizes for MQL volume without regard to quality, and sales blames marketing for bad leads, everyone loses.
Use data-driven insights to monitor and optimize velocity
You can’t improve what you don’t measure—and you can’t measure accurately without clean data.
- CRM dashboards tracking velocity components — Build reports that show opportunity count, ADV, win rate, and cycle length over time. Segment by rep, team, and source.
- Pipeline analytics — Waterfall charts showing pipeline movement (created, advanced, slipped, won, lost) reveal where deals get stuck. Weflow’s pipeline analytics surface these patterns automatically.
- Velocity trend tracking — A single velocity snapshot is less useful than a trend line. Is velocity improving quarter over quarter? Which variable is driving the change?
- Forecast integration — Connect velocity data to your forecasting process. If velocity is declining but your forecast stays flat, something’s wrong with one of them.
Data quality underpins everything. Incomplete activity data, stale opportunity stages, and missing close dates all corrupt velocity calculations. Automated data capture solves this at the source.
Personalize demos and proposals to speed up decisions
Generic demos and boilerplate proposals extend sales cycles. Buyers disengage when they can’t see how your solution fits their specific situation.
- Tailored presentations — Customize demo flows to address the prospect’s stated priorities. Lead with the capabilities that matter most to them.
- Use case-specific proposals — Reference the prospect’s challenges, goals, and evaluation criteria in your proposal. Show you’ve listened.
- Pre-meeting research — Review previous conversations before each call. Weflow’s AI summaries give reps instant context on what’s been discussed, what questions remain, and what next steps were agreed.
Personalization signals competence. Buyers move faster when they trust that you understand their needs.
Optimize follow-up cadences to prevent deal stalling
80% of sales require five or more follow-ups to close, but most reps give up after two. Deals don’t die from rejection—they die from neglect.
- Structured cadences — Define follow-up sequences by deal stage. A prospect who just finished a demo needs different outreach than one who’s reviewing a proposal.
- CRM-tracked follow-up sequences — Log every touchpoint in Salesforce. Weflow captures email and meeting activity automatically, so managers see which deals are getting attention and which are going dark.
- Multi-channel outreach — Email alone isn’t enough. Combine email, phone, LinkedIn, and direct mail to break through.
- Re-engagement triggers — Set alerts for deals with no activity in the past seven to 14 days. Early intervention prevents stalling from becoming loss.
Velocity depends on deals moving forward. Every day a deal sits idle extends your average cycle length.
How discounts affect sales velocity
Discounting creates a velocity tradeoff that’s easy to get wrong.
On one hand, discounts can shorten sales cycles. A time-limited offer creates urgency. Buyers who were waffling have a reason to decide now. If discounting cuts your cycle from 60 days to 45 days, velocity improves—even if deal size drops proportionally.
On the other hand, discounts reduce average deal value directly. A 20% discount means a 20% hit to ADV, which flows straight through to velocity. And aggressive discounting attracts discount-driven buyers who expect the same treatment at renewal, increasing churn risk.
The math matters. If a 15% discount cuts cycle length by 25%, velocity goes up. If a 15% discount cuts cycle length by 10%, velocity goes down. Model the impact before approving discount authority.
Better approaches to accelerating deals without discounting:
- Add value instead of cutting price — Throw in implementation support, training, or extended terms rather than reducing the contract value.
- Create urgency through timing — End-of-quarter deadlines, limited pilot slots, or upcoming price increases can motivate action without touching the deal price.
- Address the real objection — Price concerns often mask other hesitations. Dig into what’s actually slowing the deal before assuming a discount is the answer.
Track, measure, and continuously improve your sales velocity
Sales velocity gives revenue leaders a single metric that captures pipeline health, team efficiency, and revenue momentum. But the number only helps if you act on it.
Here’s how to make velocity operationally useful:
- Establish a baseline — Calculate current velocity by segment. You need a starting point before you can measure improvement.
- Identify the constraint — Which variable is most limiting? Low opportunity count, small deal sizes, weak win rates, or long cycles? Focus improvement efforts on the biggest drag.
- Set targets — Define velocity goals by quarter. Make them specific: “Increase mid-market velocity from $4,000/day to $5,000/day by Q3.”
- Automate measurement — Manual velocity tracking breaks down as teams scale. Weflow pulls opportunity, activity, and deal data from Salesforce automatically—so your velocity calculations stay current without spreadsheet maintenance.
- Review weekly — Make velocity a standing item in pipeline reviews. When the number moves, understand why.
Revenue teams running Salesforce have the data to calculate and improve velocity. The challenge is keeping that data accurate and accessible. Weflow automates Salesforce data capture—emails, meetings, contacts, and conversation insights—so the inputs to your velocity formula reflect what’s actually happening in your pipeline.
Get a demo to see how Weflow helps revenue teams track pipeline velocity with clean, automated Salesforce data.
Frequently asked questions
What is a good sales velocity number?
There’s no universal benchmark—velocity varies by industry, deal size, and sales model. Compare your velocity to your own historical performance and segment-specific targets. A mid-market SaaS team might target $3,000–$8,000/day; enterprise teams with longer cycles and larger deals will have different ranges. The goal is improvement over time, not hitting an arbitrary industry number.
What is the difference between sales velocity and pipeline velocity?
They’re the same metric. Both terms describe the rate at which revenue moves through your sales pipeline, calculated using the same formula. Some organizations prefer “pipeline velocity” to emphasize the operational nature of the measurement; others use “sales velocity” because it’s more commonly searched. Use whichever term your team prefers.
How often should you measure sales velocity?
Track velocity monthly, with deeper analysis quarterly. Weekly snapshots are too noisy for trend analysis, but monthly tracking catches shifts before they compound. Compare current velocity to rolling three-month and six-month averages to distinguish signal from noise.
Can sales velocity be negative?
No. The formula multiplies positive numbers (opportunities, deal value, win rate) and divides by a positive number (days). The result is always positive. However, velocity can approach zero if any numerator variable is very small—a team with a 5% win rate will have low velocity regardless of deal size or opportunity count.
How does discounting affect sales velocity?
Discounting reduces average deal value (hurting velocity) but may shorten sales cycles (helping velocity). The net effect depends on the magnitude of each change. A 10% discount that cuts cycle time by 20% improves velocity; a 10% discount that cuts cycle time by 5% hurts it. Model the math before offering discounts to accelerate deals.
Should I use deal value or customer lifetime value in the sales velocity formula?
Use deal value—specifically, the contracted amount at close. Customer lifetime value includes future renewals and expansions that haven’t happened yet. Mixing projected future revenue into a velocity calculation that measures current pipeline speed creates misleading results. Track LTV separately for strategic planning; use actual deal value for velocity.
How do I calculate sales velocity for different market segments?
Calculate velocity separately for each segment using segment-specific inputs. Pull opportunity count, average deal value, win rate, and cycle length for SMB deals only, then repeat for mid-market and enterprise. Blended velocity across segments hides real performance differences—a declining SMB velocity might be masked by growing enterprise deals if you only track the combined number.
What CRM metrics do I need to calculate sales velocity?
You need four data points from Salesforce: (1) count of qualified opportunities created in your measurement period, (2) average closed-won deal amount, (3) win rate (closed-won divided by total closed opportunities), and (4) average days from opportunity creation to close. Clean data requires consistent opportunity staging, accurate close dates, and complete deal records. Automated activity capture tools like Weflow help maintain data quality by eliminating manual entry gaps.
-p-1600.png)

.png)
-p-1600.png)
-p-1600.png)
-p-1600.png)

-p-1600.png)
-p-1600.png)
-p-1600.png)
-p-1600.png)
-p-1600.png)