
10 Sales Operations KPIs Every Revenue Team Should Track
Learn the 10 sales operations KPIs every revenue team should track, with formulas and benchmarks.




Sales operations KPIs measure how efficiently your revenue team converts pipeline into closed revenue. They're the metrics RevOps leaders use to diagnose bottlenecks, forecast accurately, and prove ROI to the board. This guide covers the 10 KPIs that matter most in 2026, with formulas, worked examples, and benchmarks you can use immediately.
What are sales operations KPIs (and why do they matter)?
Sales operations KPIs are quantifiable metrics that measure the efficiency, effectiveness, and health of your revenue engine. They differ from sales metrics (like total revenue) because they focus on how your team sells, not just what they sell.
Tracking the right KPIs gives RevOps teams three capabilities:
- Measure progress toward goals: Pipeline coverage of 3x tells you whether you have enough opportunities to hit the quarter. Win rate trending from 22% to 28% shows your deal qualification is improving.
- Identify performance bottlenecks: A 45-day average sales cycle that jumps to 62 days in Q3 points to deal stalls you can investigate. Lead response time above four hours correlates directly with lower conversion rates.
- Optimize resource allocation: Customer acquisition cost by channel shows you where to shift marketing spend. Quota attainment distribution tells you which territories need more headcount or enablement.
According to ZS research, 79% of high-growth B2B companies set KPIs annually and review them monthly or weekly. The companies that treat KPIs as static annual targets miss the signal in their data.
How to choose the right sales operations KPIs for your team
Most RevOps teams track too many metrics. The result: dashboards nobody checks and reports that don't change decisions. Here's a three-step process to select KPIs that actually drive behavior.
Step 1: Define your revenue goal
Start with the number your CRO reports to the board. Is it ARR growth? Net revenue retention? New logo acquisition? Your KPIs should ladder up to this goal, not exist in parallel to it.
Step 2: Identify the three to five metrics that most directly influence it
Work backward from the goal. If you need $10M in new ARR and your average deal value is $50K, you need 200 closed-won deals. If your win rate is 25%, you need 800 opportunities. Now you have two KPIs that matter: opportunity creation and win rate.
Step 3: Set target values using benchmarks or historical data
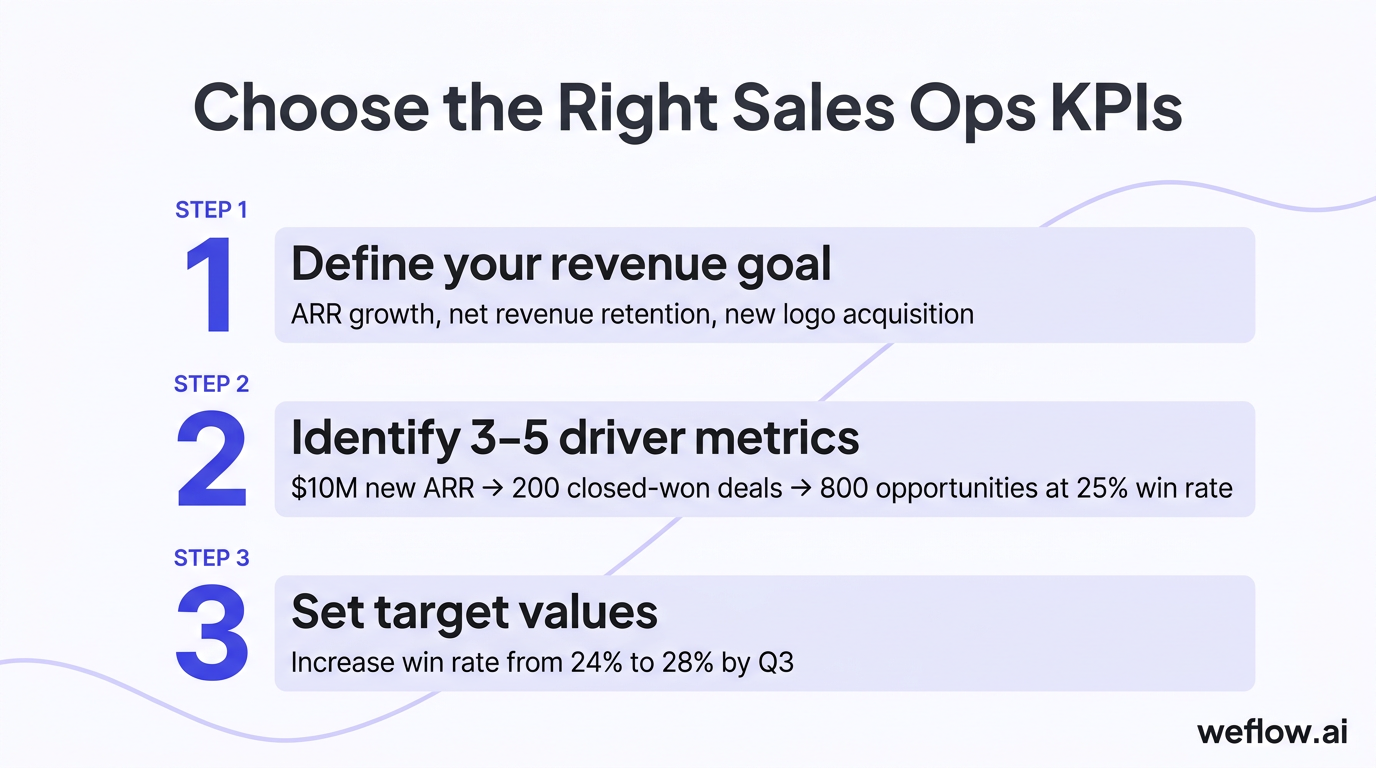
Your targets should be specific and time-bound. "Improve win rate" isn't a target. "Increase win rate from 24% to 28% by Q3" gives your team something to measure against.
The North Star framework provides a useful structure for organizing KPIs by growth type:
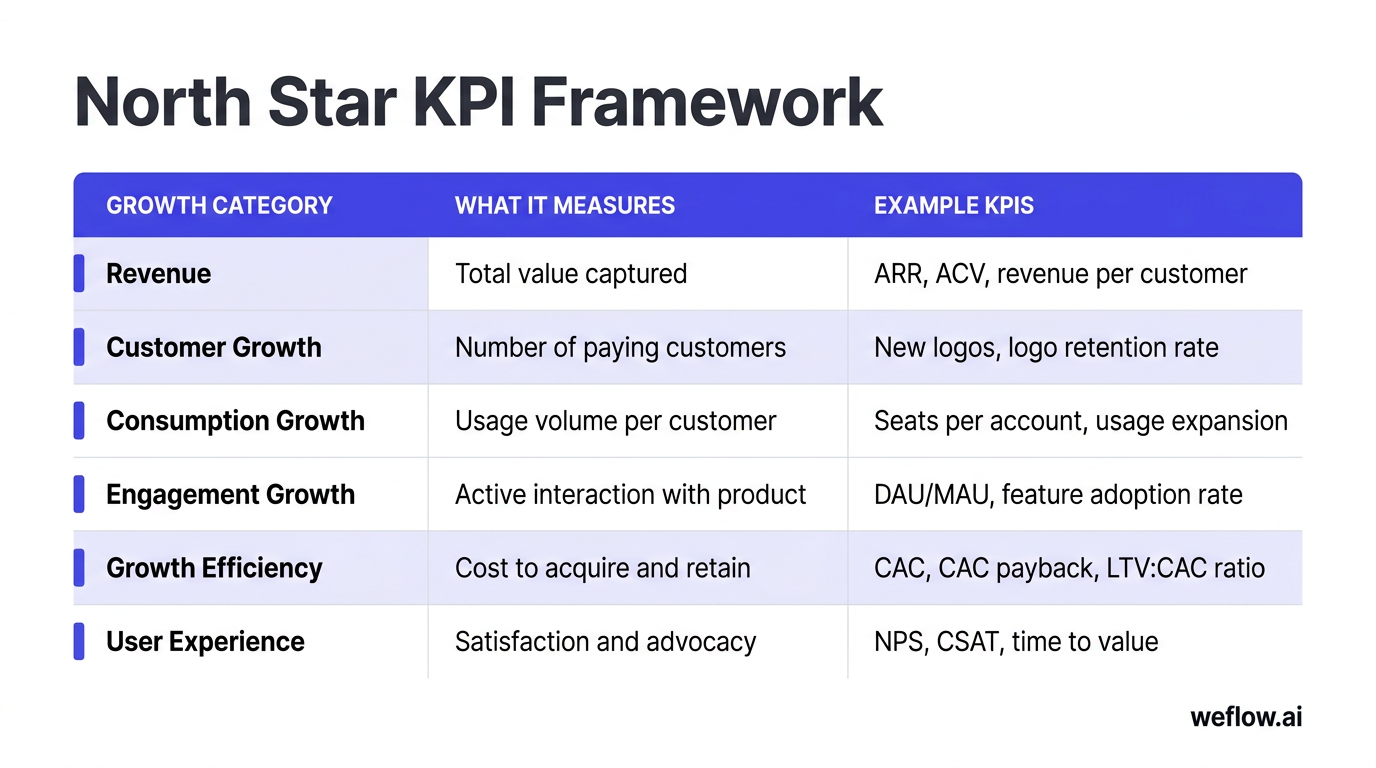
| Growth Category | What It Measures | Example KPIs |
|---|---|---|
| Revenue | Total value captured | ARR, ACV, revenue per customer |
| Customer Growth | Number of paying customers | New logos, logo retention rate |
| Consumption Growth | Usage volume per customer | Seats per account, usage expansion |
| Engagement Growth | Active interaction with product | DAU/MAU, feature adoption rate |
| Growth Efficiency | Cost to acquire and retain | CAC, CAC payback, LTV:CAC ratio |
| User Experience | Satisfaction and advocacy | NPS, CSAT, time to value |
For sales operations specifically, you'll pull most heavily from Revenue, Customer Growth, and Growth Efficiency categories.
10 sales operations KPIs every revenue team should track
These 10 KPIs cover the full revenue cycle, from lead response to customer lifetime value. Each section includes the formula, a worked example, and why the metric matters for your forecast and board reporting.
1. How to measure average sales cycle length
Definition: Average sales cycle length is the mean number of days between opportunity creation and close (won or lost). It tells you how long deals take to move through your pipeline and directly impacts revenue predictability.
| Formula |
|---|
| Average Sales Cycle Length = Total Days to Close All Deals / Number of Deals Closed |
Worked example: Your team closed 40 deals last quarter. The total time from opportunity creation to close across all 40 deals was 1,800 days. Average sales cycle length = 1,800 / 40 = 45 days.
Why it matters: Sales cycle length determines when pipeline converts to revenue. If your cycle lengthens from 45 to 60 days mid-quarter, deals you counted in your forecast will slip. Tracking this weekly helps you spot stalls before they hit the commit number.
2. Why lead response time is a competitive advantage
Definition: Lead response time measures the minutes or hours between a lead's first inbound action (form fill, demo request, hand-raise) and your team's first meaningful response. Research consistently shows response time correlates with conversion rates.
| Formula |
|---|
| Lead Response Time = Timestamp of First Response - Timestamp of Lead Creation |
Worked example: A demo request comes in at 9:15 AM. Your SDR sends a personalized email at 9:42 AM. Lead response time = 27 minutes.
Why it matters: Leads contacted within five minutes are 21x more likely to convert than leads contacted after 30 minutes (InsideSales research). Every hour of delay compounds into lower conversion rates. If your average response time is above one hour, you're leaving pipeline on the table.
3. How to calculate lead-to-opportunity conversion rate
Definition: Lead-to-opportunity conversion rate measures what percentage of leads become qualified opportunities in your pipeline. It's the first filter in your revenue funnel and indicates whether marketing and SDR efforts are producing quality, not just volume.
| Formula |
|---|
| Lead-to-Opportunity Conversion Rate = (Number of Opportunities Created / Number of Leads) x 100 |
Worked example: Marketing generated 500 MQLs last month. Your SDR team converted 75 of those into qualified opportunities. Lead-to-opportunity conversion rate = (75 / 500) x 100 = 15%.
Why it matters: A 15% conversion rate versus a 10% rate means 50% more pipeline from the same lead volume. Tracking this by lead source shows you where to double down on marketing spend and where to cut.
[banner type="download" url="https://www.weflow.ai/resources/cheat-sheets/revops-metrics-cheat-sheet" text="RevOps Metrics And Benchmarks Cheat Sheet" subtitle="Know if your win rate, CAC, and velocity are actually on track" button="Get the cheat sheet"]
4. What is a good win rate in B2B sales?
Definition: Win rate is the percentage of opportunities that close as won versus total opportunities closed (won + lost). It measures sales effectiveness and deal qualification.
| Formula |
|---|
| Win Rate = (Closed-Won Opportunities / Total Closed Opportunities) x 100 |
Worked example: Your team closed 120 opportunities last quarter. 30 were closed-won, 90 were closed-lost. Win rate = (30 / 120) x 100 = 25%.
Why it matters: B2B win rates typically range from 15% to 30%, depending on deal size and sales motion. Enterprise deals with $100K+ ACV often see 15-20% win rates; mid-market deals at $25-50K ACV commonly hit 25-30%. Tracking win rate by stage, rep, and deal size reveals where qualification breaks down.
5. Average deal value: formula and how to increase it
Definition: Average deal value (ADV), also called average contract value (ACV) for subscription businesses, is the mean revenue per closed-won deal. It determines how many deals you need to hit your number.
| Formula |
|---|
| Average Deal Value = Total Closed-Won Revenue / Number of Closed-Won Deals |
Worked example: Last quarter you closed $1.5M in new business across 30 deals. Average deal value = $1,500,000 / 30 = $50,000.
Why it matters: Increasing ADV from $50K to $60K means you need 17% fewer deals to hit the same revenue target. Track ADV trends to measure the impact of pricing changes, packaging updates, and multi-product selling motions.
6. How to calculate customer lifetime value (CLV) for sales teams
Definition: Customer lifetime value estimates the total revenue a customer will generate over their relationship with your company. It guides how much you can afford to spend on acquisition and which customer segments deserve the most sales attention.
| Formula |
|---|
| CLV = Average Revenue Per Customer x Gross Margin % x Average Customer Lifespan (in years) |
Worked example: Your average customer pays $48,000/year, your gross margin is 80%, and customers stay an average of 4 years. CLV = $48,000 x 0.80 x 4 = $153,600.
Why it matters: CLV determines sustainable CAC. If your CLV is $150K and your CAC is $50K, your LTV:CAC ratio is 3:1, a healthy benchmark for B2B SaaS. Tracking CLV by segment helps you prioritize which deals are worth the extra sales cycle time.
7. Sales pipeline velocity: formula and worked example
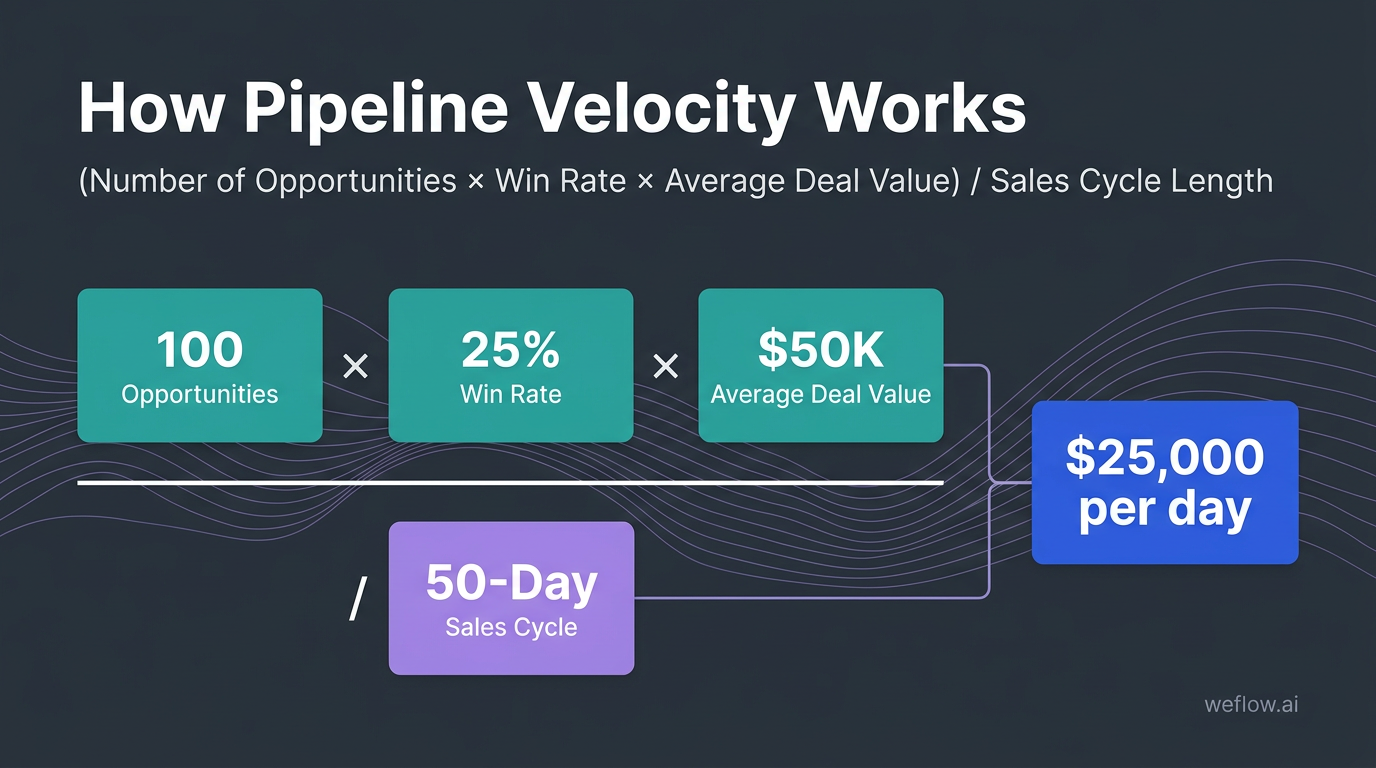
Definition: Pipeline velocity measures how fast revenue moves through your pipeline. It combines four factors: opportunity count, win rate, average deal value, and sales cycle length into a single metric that predicts revenue throughput.
| Formula |
|---|
| Pipeline Velocity = (Number of Opportunities x Win Rate x Average Deal Value) / Sales Cycle Length (in days) |
Worked example: You have 100 opportunities in pipeline, a 25% win rate, $50K average deal value, and a 50-day sales cycle. Pipeline velocity = (100 x 0.25 x $50,000) / 50 = $25,000 per day.
Why it matters: Pipeline velocity is the clearest signal of revenue health. A $25K/day velocity over a 90-day quarter predicts $2.25M in revenue. When velocity drops, you can diagnose which input changed: fewer opportunities, lower win rates, smaller deals, or longer cycles.
8. How to measure sales forecast accuracy (MAPE formula)
Definition: Forecast accuracy measures how close your predicted revenue was to actual closed revenue. The standard measurement is Mean Absolute Percentage Error (MAPE), which calculates the average percentage difference between forecast and actual.
| Formula |
|---|
| MAPE = (|Forecast - Actual| / Actual) x 100 |
Worked example: You forecasted $2.4M for Q2. Actual closed revenue was $2.2M. MAPE = (|$2,400,000 - $2,200,000| / $2,200,000) x 100 = 9.1%.
Interpreting MAPE:
- Under 10%: Excellent. Your forecast is board-ready.
- 10-20%: Acceptable. You have visibility but room for improvement.
- Above 20%: Your forecasting process is broken. Investigate data quality, deal stage definitions, or rep sandbagging.
Why it matters: Forecast accuracy determines board confidence and resource planning. A CRO who delivers within 5% of forecast builds trust. A CRO who misses by 25% triggers questions about data, process, and leadership.
9. Customer acquisition cost (CAC): how to calculate and reduce it
Definition: Customer acquisition cost is the total cost of sales and marketing required to acquire one new customer. It includes salaries, commissions, marketing spend, tools, and overhead allocated to new customer acquisition.
| Formula |
|---|
| CAC = Total Sales and Marketing Costs / Number of New Customers Acquired |
Worked example: Last quarter you spent $600K on sales and marketing (salaries, tools, advertising, events). You acquired 20 new customers. CAC = $600,000 / 20 = $30,000.
[banner type="download" url="https://www.weflow.ai/resources/cheat-sheets/revops-reports-cheat-sheet" text="RevOps Reports And Dashboard Cheat Sheet" subtitle="Build dashboards your CRO checks instead of ignores" button="Download cheat sheet"]
How to reduce CAC:
- Improve lead quality: Higher conversion rates mean fewer leads needed per customer.
- Shorten sales cycles: Faster closes reduce the cost-per-deal of your sales team's time.
- Automate administrative work: Tools that reduce CRM data entry give reps more selling time without adding headcount.
- Focus on high-converting channels: Track CAC by lead source and shift budget to channels with lower acquisition costs.
Why it matters: CAC determines unit economics. If your CAC exceeds your first-year revenue from a customer, you're paying to lose money. Tracking CAC by segment, channel, and sales motion shows you where efficiency breaks down.
10. Quota attainment rate: are your reps hitting target?
Definition: Quota attainment measures the percentage of sales reps who hit their assigned quota in a given period. It's both an individual performance metric and an organizational health indicator.
| Formula |
|---|
| Quota Attainment Rate = (Actual Sales / Sales Quota) x 100 |
Worked example: A rep has a $500K quarterly quota and closed $425K. Individual quota attainment = ($425,000 / $500,000) x 100 = 85%.
Team-level analysis: Calculate the percentage of reps at or above 100% attainment. If only 30% of your team hits quota, either quotas are set incorrectly or you have an enablement problem. Healthy organizations see 60-70% of reps at or above quota.
Why it matters: Quota attainment distribution reveals whether revenue risk is concentrated in a few underperformers or spread across the team. It's also an early warning system for attrition, since reps who miss quota two quarters in a row often leave.
How to track sales operations KPIs (tools and dashboards)
The right KPIs mean nothing if they live in spreadsheets that get updated quarterly. Revenue teams need real-time visibility, which requires the right tools and cadence.
CRM dashboards (Salesforce)
Salesforce remains the system of record for pipeline and revenue data at most B2B organizations. Native Salesforce reports and dashboards can track pipeline coverage, stage conversion rates, and win rates if your data is clean. The challenge: CRM data quality. If reps don't update opportunity stages, close dates, and amounts consistently, your dashboards show garbage.
BI tools
Tableau, Looker, and Power BI pull Salesforce data into more flexible visualizations. They're useful for historical trend analysis and board-level reporting. The tradeoff is complexity: you need data engineering resources to build and maintain the pipelines, and dashboards can lag behind real-time CRM changes.
Revenue intelligence platforms
Platforms like Weflow combine pipeline analytics, activity capture, and forecast accuracy tracking in a single view. Weflow captures emails, meetings, and calls automatically, so the activity data your KPIs depend on is complete without rep manual entry. For forecast accuracy specifically, Weflow tracks commit versus actual at the deal level, so you can identify which reps and deal types drive forecast error.
Recommended review cadence
| KPI Category | Review Frequency | Example KPIs |
|---|---|---|
| Pipeline and activity | Weekly | Pipeline coverage, lead response time, stage movement |
| Conversion and velocity | Monthly | Win rate, sales cycle length, pipeline velocity |
| Strategic and financial | Quarterly | CLV, CAC, forecast accuracy, quota attainment distribution |
Frequently asked questions
What are the most important KPIs for sales operations?
The five KPIs that appear on every RevOps leader's dashboard are pipeline velocity, win rate, forecast accuracy, sales cycle length, and quota attainment. These cover pipeline health, conversion efficiency, and revenue predictability. Start with these five before adding segment-specific metrics.
How do you calculate sales pipeline velocity?
Pipeline velocity = (Number of opportunities x Win rate x Average deal value) / Sales cycle length in days. The result is revenue throughput per day. For example, 100 opportunities at 25% win rate with $50K ADV and 50-day cycles yields $25,000/day velocity.
What is a good win rate in B2B sales?
B2B win rates typically range from 15% to 30%. Enterprise deals ($100K+ ACV) often see 15-20% win rates due to longer cycles and more stakeholders. Mid-market deals ($25-50K ACV) commonly achieve 25-30%. The right benchmark depends on your deal size, sales motion, and competitive landscape.
How often should you review sales operations KPIs?
Review pipeline and activity metrics (coverage, lead response time) weekly. Review conversion metrics (win rate, velocity) monthly. Review financial metrics (CAC, CLV, forecast accuracy) quarterly. Weekly reviews catch problems before they compound; quarterly reviews reveal strategic trends.
What is the difference between sales KPIs and sales metrics?
All KPIs are metrics, but not all metrics are KPIs. A KPI is a metric that directly measures progress toward a business objective and has a target value. "Total calls made" is a metric. "Calls made per opportunity created" becomes a KPI when you set a target and tie it to pipeline goals.
How do you reduce customer acquisition cost (CAC)?
Four proven methods: improve lead-to-opportunity conversion (higher quality means fewer leads needed), shorten sales cycles (reduces cost per deal), automate administrative work (frees rep time for selling), and shift budget to high-converting channels. Track CAC by lead source to identify which channels deliver the best unit economics.
What tools do sales operations teams use to track KPIs?
Most RevOps teams combine Salesforce (system of record), a BI tool like Tableau or Looker (historical analysis), and a revenue intelligence platform like Weflow (real-time pipeline analytics and activity capture). The specific stack depends on team size, Salesforce complexity, and reporting requirements.
Why is forecast accuracy important for sales operations?
Forecast accuracy determines whether leadership can trust the numbers they report to the board. A CRO who delivers within 5% of commit builds credibility for resource requests. A CRO who misses by 25% triggers board concerns about data quality and sales leadership. Forecast accuracy also drives operational planning: headcount, capacity, and cash flow all depend on predictable revenue.
.webp)
