
Slippage Pattern Agent
Find the close date push patterns that repeat by rep, stage, and deal size, and show sales leadership how the picture has changed since last quarter.
- Trigger: a close date is pushed
- AI steps: find the patterns that repeat, then write the trend
- Output: a slippage report stored and emailed to sales leadership
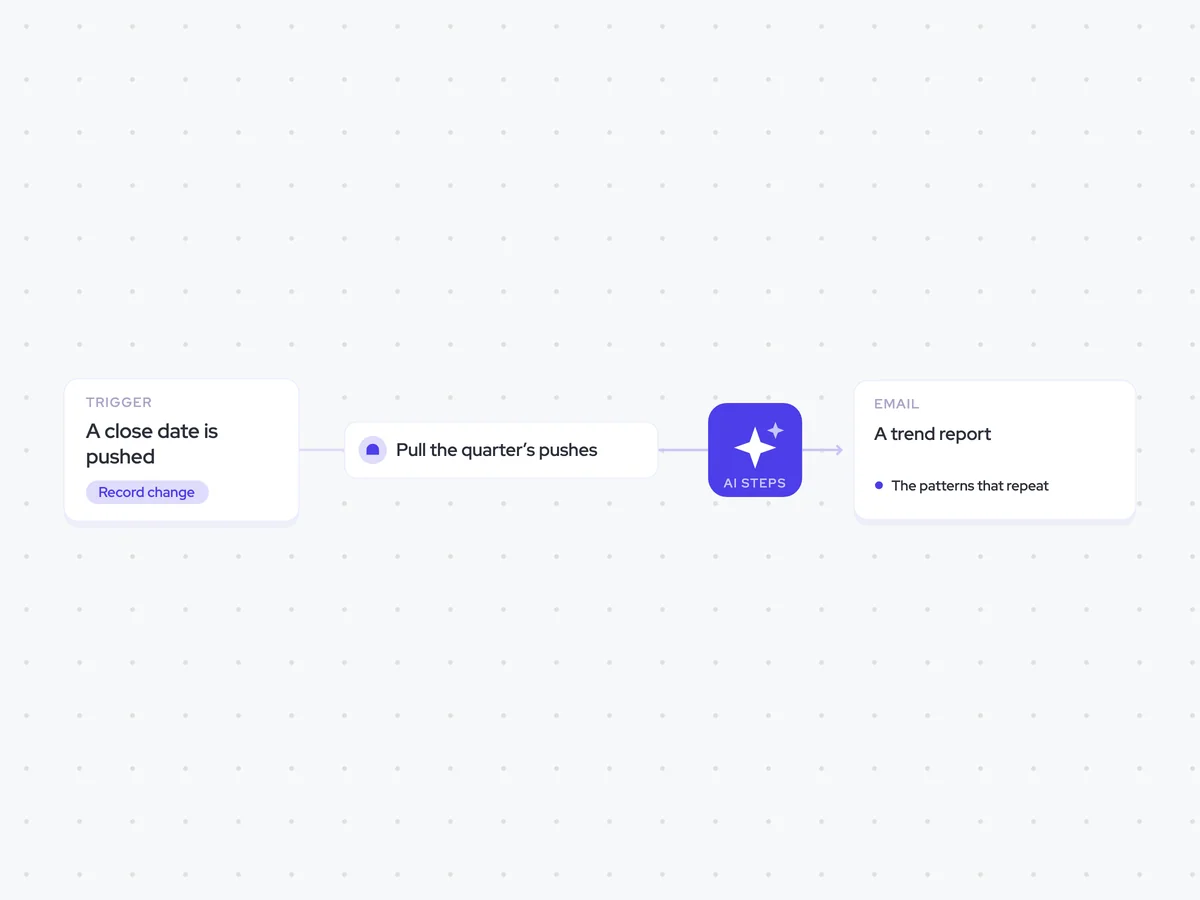
Agent breakdown
A blueprint to adapt, not a fixed recipe. Set the trigger, thresholds, and methodology that fit your team, and each step builds on the last, using the conversation and CRM context you already capture.
Run whenever a close date is pushed
The agent runs whenever an opportunity’s close date is pushed. Each push recalculates the pattern, so sales leadership sees changes as they happen rather than waiting for a quarterly review.
- Trigger: An opportunity’s close date is pushed
- Recalculate: After every push
Pull every push from this quarter and last
Next, the agent pulls every close date push from this quarter and last quarter. Using both quarters gives it enough history to find repeated groupings and lets the trend report compare the current picture with the previous quarter.
- Include: Every close date push from this quarter
- Include: Every close date push from last quarter
Find the push patterns that repeat
The agent groups the close date pushes by rep, stage, and deal size, then identifies any grouping that sits well above the others. This shows whether pushes are concentrated around particular reps, stages, or sizes of deal.
You are finding repeated patterns across close date pushes.
Input: every close date push from this quarter and last quarter.
- Group the pushes by rep.
- Group the pushes by stage.
- Group the pushes by deal size.
- Name any grouping that is well above the others.
Use only the close date pushes in the input. Do not name a grouping as a repeated pattern unless it is well above the others.
Return the patterns that repeat, grouped by rep, stage, and deal size.
Explain the trend and how it has changed
Using the repeated groupings, the agent writes what the patterns mean and compares this quarter with last quarter. If nothing repeats, it says so instead of forcing a trend that is not there.
Write a trend report using the close date push groupings from the previous step.
- Explain what each repeated grouping means.
- Compare this quarter with last quarter and describe how the picture has changed.
- Say clearly when no pattern repeats.
Use only the groupings and quarter comparison in the input. Do not present a grouping as a pattern when it does not repeat.
Return a trend report covering the repeated groupings, what they mean, and how they have changed since last quarter. If nothing repeats, return a clear statement saying so.
Store a report after every run
Next, the agent creates a new slippage report for the current run. Keeping one report per run leaves a history of when a pattern appeared, changed, or disappeared.
- Create: One slippage report per run
- Keep: Reports from earlier runs
Send the slippage report to sales leadership
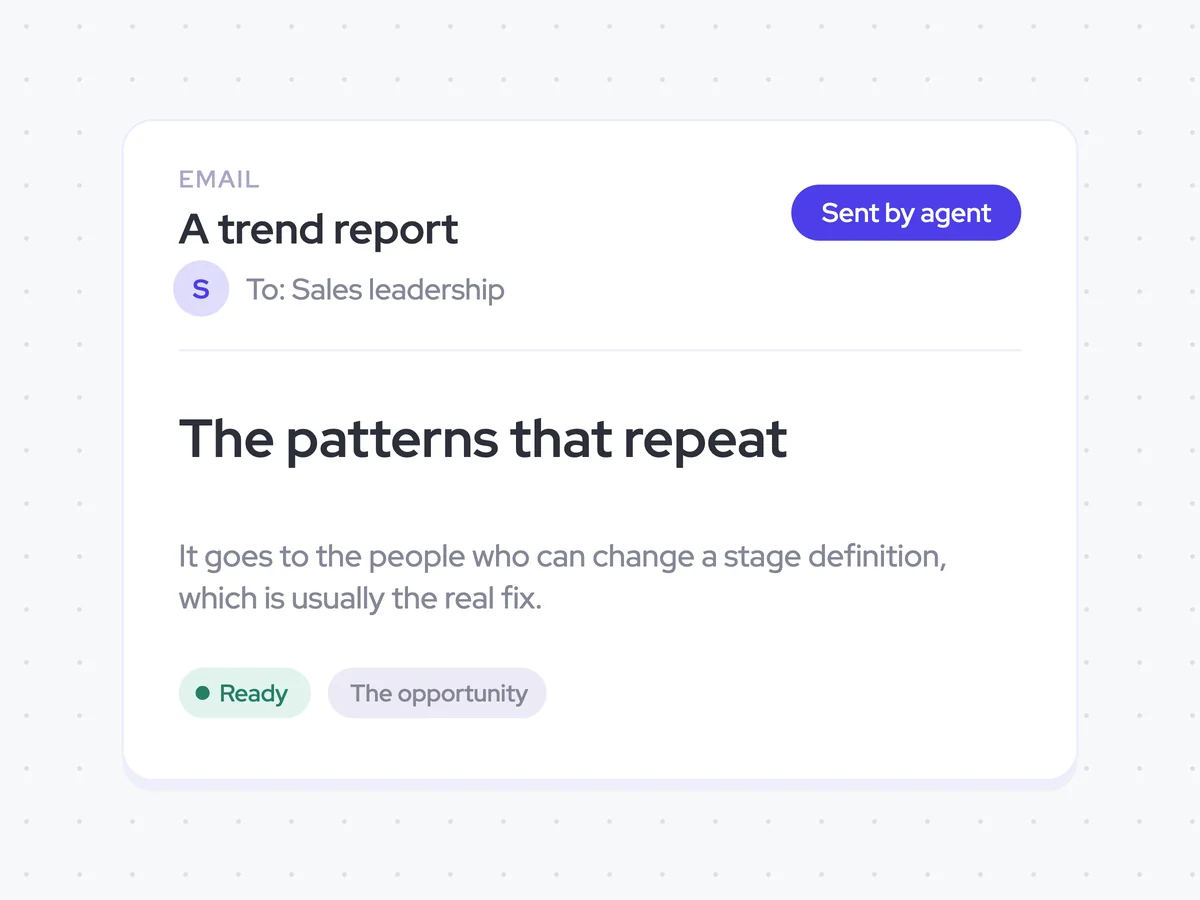
Finally, the agent emails the slippage report to sales leadership. It puts the pattern in front of the people who can change a stage definition when that is what keeps causing close dates to move.
- Recipients: Sales leadership
- Send: The slippage report from the current run
A slippage trend report stored and emailed to sales leadership after every push
See which close date push patterns repeat by rep, stage, and deal size, and how they have changed since last quarter. Each push creates a new stored report and emails the latest trend to sales leadership, while earlier reports preserve when patterns appeared or disappeared.
- For sales leaders: Use the repeated groupings to see where a stage definition may need to change.
AI Agents that pair well
Same data, different jobs. Run them together for a fuller picture.


Learn more about GTM & Revenue Operations
RevOps Lab Podcast


50+ Free GTM & RevOps Cheat Sheets

Free RevOps Community (1k+ members)
.webp)