.webp)


Free Strategic RevOps Cheat Sheet
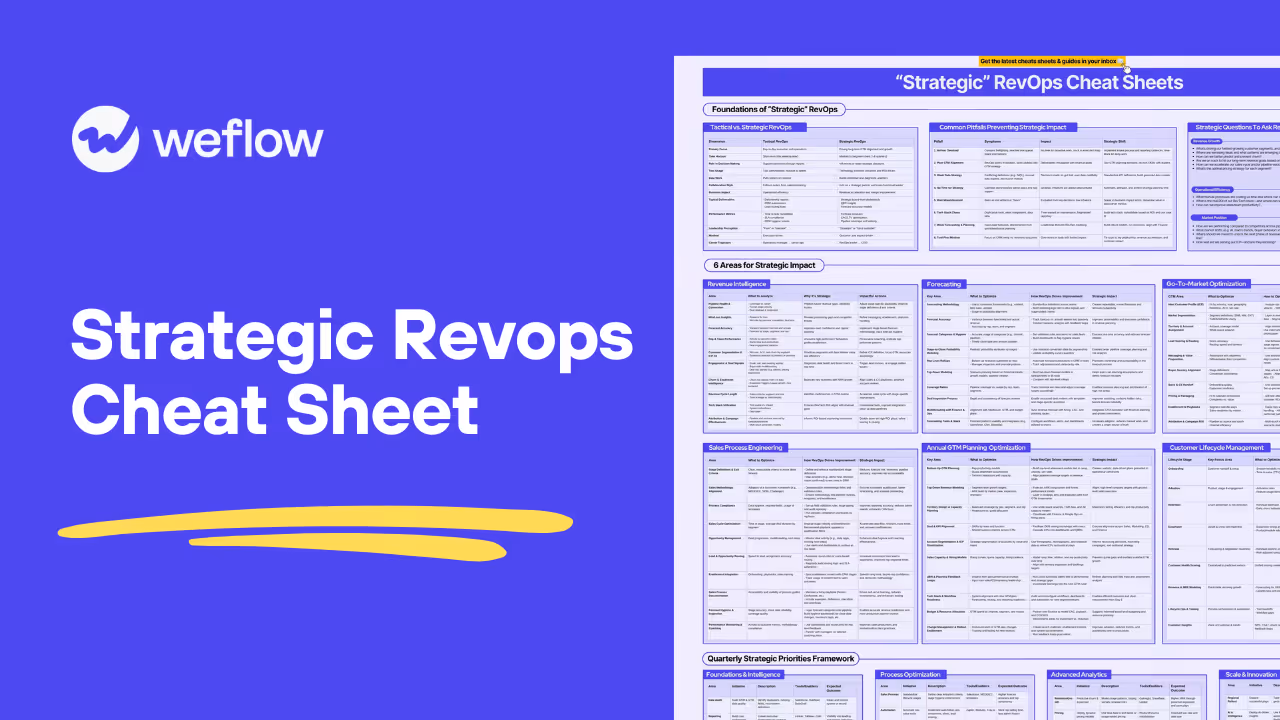
Want to become a VP of RevOps or COO? Here is our “Strategic RevOps” cheat sheet covering:
- 6 Areas for Strategic Impact
- Foundations of Strategic RevOps
- Quarterly Strategic Priorities Framework
- Key Performance Indicators for Strategic Success
"With Weflow, we’re now capturing all relevant activities and have full transparency into the performance of each sales rep. It’s a game changer."

%201.svg)
"Weflow gives us better visibility and predictability of our business."

"Weflow eliminated the need for our VP to ask, ‘Did you follow up with that deal?’. It tracks customer interactions automatically, creating a framework that drives accountability across the team."


"None of the other tools gave us a solution like Weflow. From the beginning, we had a really smooth process."
.webp)


"I had a first introductory call with Weflow. I think I was sold after 15 minutes. There’s no question that the people at Weflow understood the problems that we were trying to solve."
"I’ve worked with Gong before, but Weflow’s simplicity and real-time sync are game-changing."
.webp)


"We use Weflow to auto-capture activity data, run deal reviews, and analyze our pipeline to inform our forecast. Being able to spot deal risks early has improved win rates and pipeline health."


What's Inside
Tactical vs strategic RevOps
- A side-by-side breakdown comparing tactical and strategic RevOps across time horizon, decision role, analytics depth, and career path
- The eight blockers keeping RevOps stuck in execution mode, from ad-hoc overload and tech stack chaos to tool-first thinking
- The strategic questions to run regularly across revenue growth, operational efficiency, and market position including win/loss patterns and RevTech ROI
Six domains of revenue system impact
- Operator-level coverage of revenue intelligence, forecasting, GTM optimization, customer lifecycle, sales process engineering, and annual GTM planning
- Specific levers per domain including stage-to-probability modeling, coverage ratios, lead routing logic, churn-risk scoring, and CRM exit criteria
- Each workflow tied to concrete targets: forecast accuracy within 5%, NRR above 110%, CAC payback under 12 months, churn reduction of 15-25%
Quarterly RevOps roadmap
- A Q1 to Q4 sequence moving from data audits, KPI baselines, and exec dashboards into process standardization and automation by Q2
- Q3 and Q4 initiatives covering predictive churn, dynamic pricing tests, multi-touch attribution, AI next best action, and scenario-based forecasting
- Named tools per quarter including LeanData and Chili Piper for routing, Gainsight and Planhat for health scoring, Clari and Excel for forecasting

Janis Zech
Janis Zech is the co-founder and CEO of Weflow, the modular Revenue AI Orchestration platform. He co-hosts the RevOps Lab podcast, where he sits down with RevOps leaders and sales operators to unpack how they run revenue teams, forecast pipeline, and use AI to get more out of Salesforce. At Weflow, Janis focuses on helping revenue leaders turn messy CRM data into reliable forecasts and better sales execution. His angle on the podcast and blog is always practical: what's actually working inside high-performing revenue orgs, and what's just noise.


Go Deeper
Revenue Planning Framework: Capacity Models, Coverage, and Forecasts
#83 Becoming strategic in RevOps with our cheat sheet - with Janis and Philipp
Free Revenue Planning Fast-Track Cheat Sheet
Frequently asked questions
What's the actual difference between tactical and strategic RevOps, and how do I know which one I'm doing?
Tactical RevOps is reactive — you're pulling reports on request, fixing routing logic, and keeping the CRM clean. Strategic RevOps means you're influencing decisions before they're made, owning forecast accuracy models, and showing up in QBRs with pipeline coverage analysis tied to revenue outcomes. The cheat sheet breaks this down across 11 dimensions, including time horizon, performance metrics, and how leadership perceives your role. If your deliverables are mostly daily reports and CRM automations, you're operating tactically.
Do I need a tool like Clari or Gong to apply the forecasting framework in this cheat sheet?
No — the forecasting methodology section is tool-agnostic and works with Salesforce, HubSpot, or even a well-structured spreadsheet. Tools like Clari, BoostUp, or Weflow can reduce manual work and improve adoption, but the underlying logic — stage-to-probability modeling, rep-level rollups, variance tracking against actuals — can be built without them. The cheat sheet specifically calls out Excel and BI tools as valid enablers alongside dedicated forecast platforms. Start with the process and methodology first; layer in tooling once the model is trusted.
Which of the 8 common pitfalls should I prioritize fixing first if I'm trying to move from tactical to strategic RevOps?
Ad-hoc overload is usually the right place to start, because it's the root cause that keeps everything else stuck — if your calendar is dominated by Slack interruptions and reactive task queues, you'll never carve out time for the strategic work. The cheat sheet recommends implementing an intake process, setting reporting cadences, and time-blocking for deep work as the immediate fix. Once you have protected capacity, weak data strategy and poor GTM alignment are the next highest-leverage problems to address. Fixing those two creates the credibility and visibility you need to influence decisions upstream.
What data do I need in place before the quarterly strategic priorities framework is actually useful?
The Q1 phase of the framework is specifically designed to build that foundation — it starts with a CRM and GTM data audit to surface duplicates, missing fields, and inconsistent definitions. Before you can run meaningful pipeline velocity or NRR analysis, you need agreed-upon KPI definitions (what counts as an MQL, how stages are defined, what closes as "won") and a baseline for metrics like win rate, CAC, and funnel conversion. Without that, your dashboards will reflect data people don't trust, which is one of the eight pitfalls the cheat sheet explicitly flags. Get the definitions locked and the baseline established in Q1 before moving into process optimization in Q2.
How do I know if my forecast accuracy is actually at a strategic level, or just passable?
The cheat sheet sets a clear benchmark: forecast accuracy should land within 5% of actual results. If you're regularly seeing variance beyond that, the framework points to three likely culprits — inconsistent use of forecast categories like commit vs. best case, stale close dates and amounts in the pipeline, and stage-to-probability mappings that aren't grounded in historical conversion data. A practical check is to run a variance analysis by rep, team, and segment each quarter and look for patterns in where the misses cluster. That tells you whether it's a data hygiene problem, a methodology problem, or a rep behavior problem.
How often should I revisit the ICP definition and customer segmentation analysis described in the GTM optimization section?
At minimum, once per year as part of annual GTM planning — but the cheat sheet also flags ICP fit as a standing strategic question to ask regularly, not just at planning time. If you're seeing win rate or ACV shift meaningfully by segment, or churn clustering in a specific industry or company size band, that's a signal to pull the analysis mid-year rather than waiting. The framework recommends using firmographic, technographic, and historical LTV data to refine the ICP, and feeding those findings directly into territory design and account prioritization. Treat it as a living model, not an annual slide.