
Revenue Gap Agent
Compare what was forecast and committed each week with what actually closed, then show sales leadership the three largest gaps and the deals behind them.
- Trigger: five days after quarter close
- AI steps: compare forecast and commit with actual, then name the three largest gaps
- Output: a quarterly retro stored and sent to sales leadership

Agent breakdown
A blueprint to adapt, not a fixed recipe. Set the trigger, thresholds, and methodology that fit your team, and each step builds on the last, using the conversation and CRM context you already capture.
Wait five days after quarter close
The agent waits until five days after the quarter closes before starting the retro. This gives late paperwork time to land, so the comparison uses the final numbers for the quarter.
- Schedule: Five days after quarter close
- Cadence: Once for each completed quarter
Pull every deal from the quarter
Next, the agent pulls every deal from the quarter, along with how it was forecast or committed and what actually closed. It includes deals that were never called, since those deals explain part of the gap between the forecast and the final result.
- Scope: Every deal in the quarter
- Include: Deals that were never called
- History: What was forecast and committed through the quarter, and what actually closed
Compare forecast and commit with actual
The agent compares what was forecast and committed at each week of the quarter with what actually closed. Keeping the weekly calls in one quarter-long view shows how the position changed over time rather than reducing the result to one final total.
You are comparing the weekly revenue calls for a completed quarter with what actually closed.
Input: every deal in the quarter, what was forecast and committed at each week, and the final closed result.
For each week of the quarter:
- State the revenue that was forecast.
- State the revenue that was committed.
- Compare both figures with the revenue that actually closed by quarter end.
- Show the delta between each weekly call and the final closed result.
Rules: treat forecast and committed as separate figures. Keep every weekly position as it was recorded at the time. Include deals that closed without being called during the quarter.
Return a single quarter view, organized by week, showing forecast, commit, actual closed revenue, and the delta for each call.
Name the three largest gaps
From that comparison, the agent names the three largest gaps between what was called and what closed. It lists the deals behind each gap, so sales leadership can see what changed rather than receiving a single accuracy percentage.
You are identifying the revenue deltas that mattered most in the quarter.
Input: the quarter-long forecast against actual comparison, plus every deal included in it.
- Identify the three largest gaps between revenue called during the quarter and revenue that actually closed.
- Name each gap in plain language.
- List the deals behind each gap and show how they contributed to it.
- Include revenue that closed without being called, as well as called revenue that did not close.
Rules: rank the gaps by the size of the revenue delta. Focus on the deltas and the deals behind them, not the quarter’s total or a single accuracy percentage.
Return a ranked list of the three largest gaps, with the revenue delta and the deals behind each one.
Store the quarterly retro
Next, the agent creates one retro record for the quarter and saves the forecast comparison, the three largest gaps, and the deals behind them. Storing one record each quarter makes it possible to read this quarter’s pattern against the previous four.
- Creates: One retro record for the quarter
- Stores: Forecast against actual, the three largest gaps, and the deals behind each one
Send the deltas to sales leadership
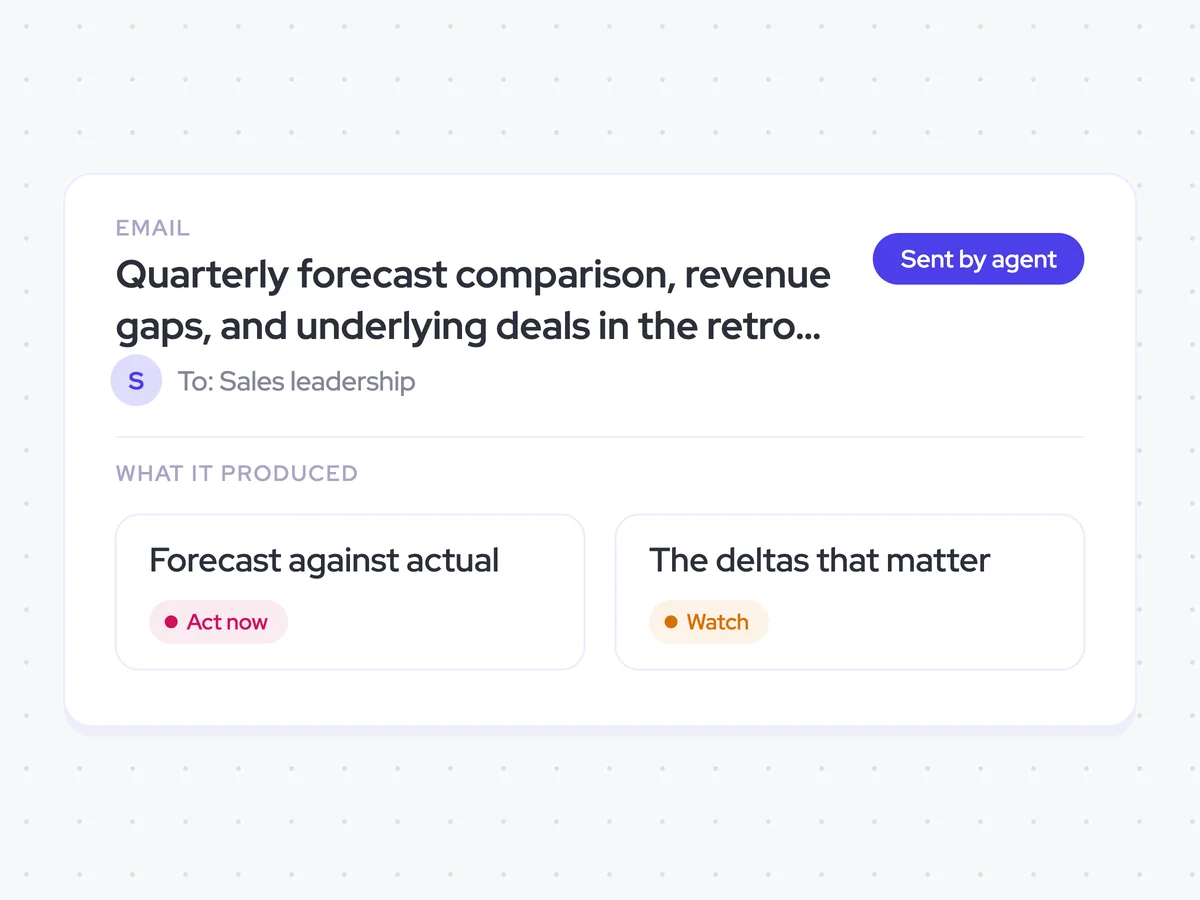
Finally, the agent emails the quarterly retro to sales leadership. It leads with the deltas and the deals behind them, rather than reducing the quarter to a single accuracy percentage.
- Recipients: Sales leadership
- Includes: The three largest deltas and the deals behind each one
- Format: Deltas and deals, not a single accuracy percentage
Quarterly forecast comparison, revenue gaps, and underlying deals in the retro record and sales leadership’s inbox
See how each week’s forecast and commit compared with what actually closed, plus the three largest gaps and the deals behind them. The retro is stored as one quarterly record and sent to sales leadership, so you can compare this quarter’s pattern with the previous four.
- For sales leaders: Review what changed between the weekly calls and the final result, and which deals accounted for the largest deltas.
AI Agents that pair well
Same data, different jobs. Run them together for a fuller picture.


Learn more about GTM & Revenue Operations
RevOps Lab Podcast


50+ Free GTM & RevOps Cheat Sheets

Free RevOps Community (1k+ members)
.webp)