
KPI Anomaly Agent
Catch metrics moving away from their trend, see which deals are behind the change, and give leadership the likeliest explanation while the numbers are still current.
Trigger: the weekly metric refresh
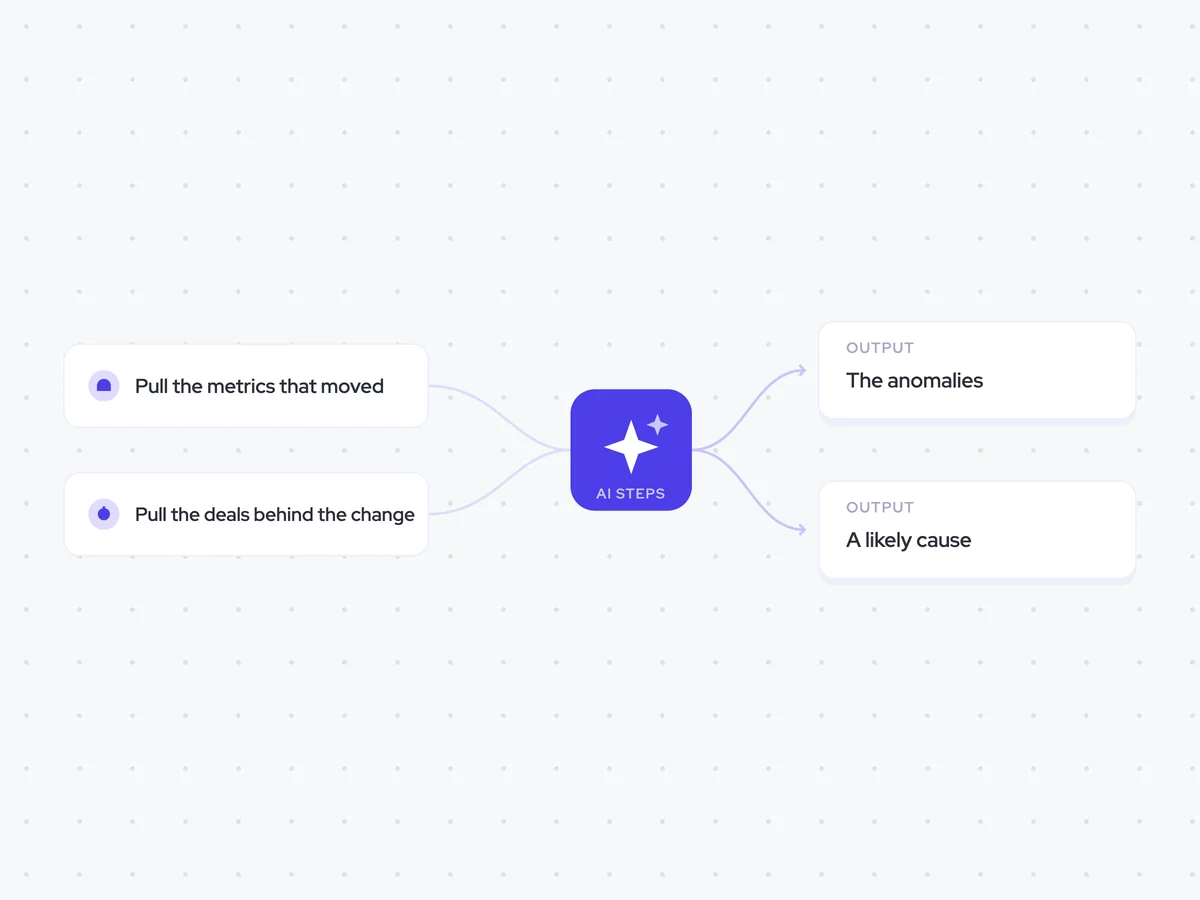
AI steps: find the anomalies, then offer a likely cause
Output: anomalies and likely causes posted to the leadership Slack channel
Agent breakdown
A blueprint to adapt, not a fixed recipe. Set the trigger, thresholds, and methodology that fit your team, and each step builds on the last, using the conversation and CRM context you already capture.
Run on the weekly metric refresh
Each week, the agent runs when the metrics refresh. That gives leadership an explanation while the change is still current, rather than waiting until the end of the quarter to ask what happened.
Schedule: Weekly
Trigger: The metric refresh
Pull the metrics that moved
Next, the agent pulls the metrics that have moved outside their normal range. It leaves ordinary variance alone, so the rest of the workflow focuses only on changes that need an explanation.
Scope: Metrics outside their normal range
Exclude: Metrics still within normal variance
Pull the deals behind the change
For each metric that moved, the agent pulls the calls on the deals driving the change. Looking at the deals underneath the number helps it find the likely cause, which is usually concentrated in two or three deals.
Scope: Deals driving the metric change
Include: Calls on those deals
Find the anomalies
The agent compares each metric with its trend and lists the ones outside their normal range. For every anomaly, it states the size of the deviation and leaves out anything that falls within normal variance.
Review the metrics pulled from the latest refresh and compare each one with its trend.
List every metric outside its trend.
For each metric, state the size of the deviation.
Ignore anything inside normal variance.
Return a list with the metric and the size of its deviation.
Offer the likeliest cause
Using the calls on the deals behind each anomaly, the agent offers the likeliest cause for the change. It names the deals behind the explanation and clearly marks the cause as a hypothesis rather than a finding.
Review each metric anomaly and the calls on the deals driving it.
Give the likeliest cause of the anomaly.
Name the deals behind that explanation.
Use the calls on those deals as the basis for the explanation.
Mark the cause as a hypothesis rather than a finding.
Return each anomaly with its likely cause, the deals behind it, and a clear hypothesis label.
Post the explanation to leadership
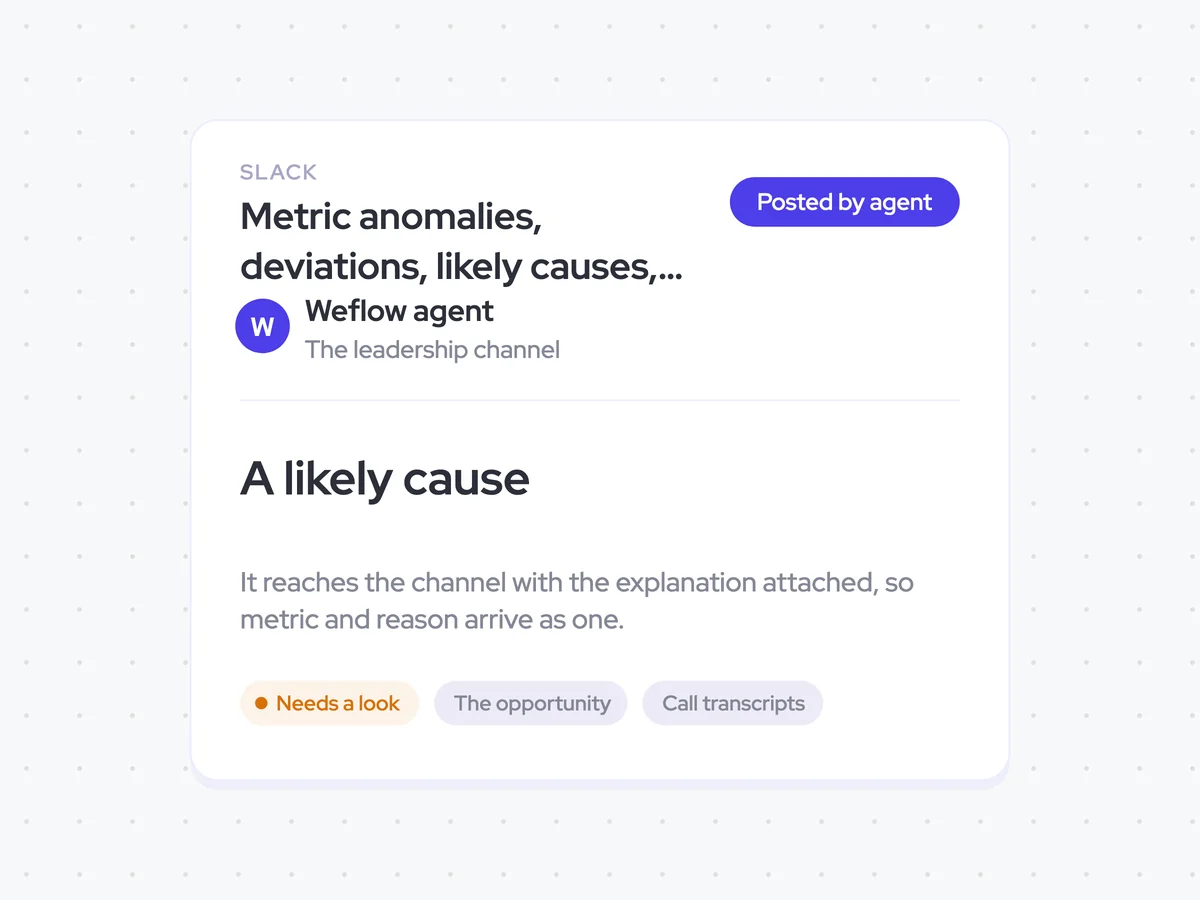
Finally, the agent posts the anomaly and its likely cause to the leadership Slack channel. The metric, deviation, explanation, and deals behind it arrive together, so executives can see what moved and what likely caused it.
Channel: The leadership Slack channel
Include: The anomaly, deviation, likely cause, and deals behind it
Metric anomalies, deviations, likely causes, and supporting deals in the leadership Slack channel
See which metrics moved outside their trend, how large each deviation was, and which deals most likely caused the change. Each explanation is marked as a hypothesis and posted with the deals behind it, so leadership gets the metric and the likely reason together.
For executives: Review what moved and the likely cause while the latest metric refresh is still current.
AI Agents that pair well
Same data, different jobs. Run them together for a fuller picture.


Learn more about GTM & Revenue Operations
RevOps Lab Podcast


50+ Free GTM & RevOps Cheat Sheets

Free RevOps Community (1k+ members)
.webp)