
Forecast Accuracy Agent
Compare what reps are calling this quarter with how similar deals have closed before, and see who is over-calling or sandbagging by more than ten per cent.
- Trigger: weekly, on the forecast cadence
- AI steps: calculate the historical close rate, then adjust each rep's called number
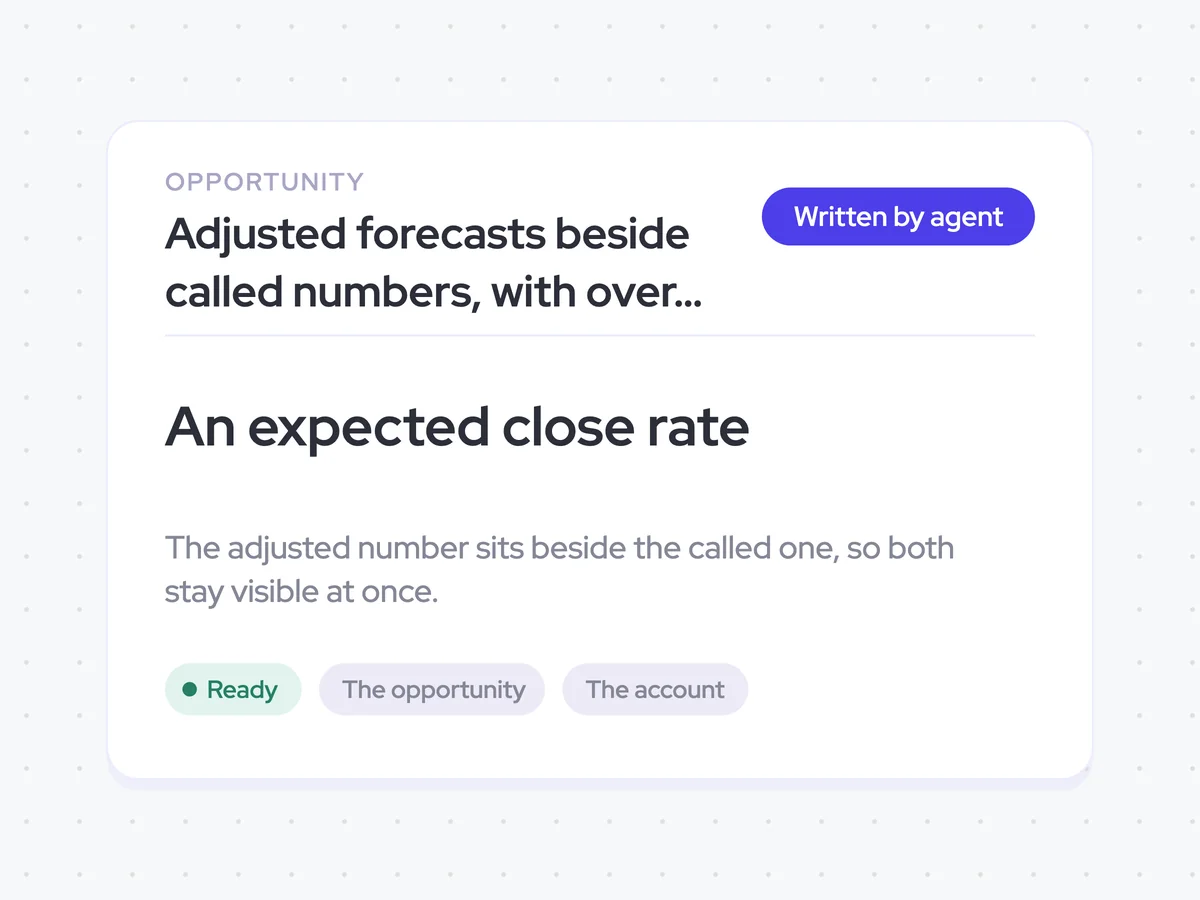
- Output: adjusted forecasts beside the called numbers, with over and under-callers named for RevOps

Agent breakdown
A blueprint to adapt, not a fixed recipe. Set the trigger, thresholds, and methodology that fit your team, and each step builds on the last, using the conversation and CRM context you already capture.
Run every week on the forecast cadence
Each week, the agent runs on your forecast cadence. This catches changes in how reps are calling the quarter while there is still time to see the pattern, rather than waiting until the quarter has ended.
- Schedule: Weekly
- Cadence: The existing forecast cadence
Pull this quarter's commits
Next, the agent pulls this quarter's commits as they stand that week. These are the numbers it will test against the way similar deals have closed in the past.
- Scope: This quarter's commits
- Use: The current called numbers for each rep
Pull the segment, size, and deal history
The agent then pulls the segment, deal size, and history from the account. This gives it the comparable deals it needs to judge each rep's commit against what has actually closed before.
- Fields: Account segment and deal size
- History: How deals in each segment and size have closed before
Calculate the historical close rate
Using that history, the agent calculates the close rate for deals in each segment and size group. It ignores deals under a quarter old, so the expected rate is based on the older deals in the history.
Calculate the historical close rate for deals like this quarter's commits.
Input: the account segment, deal size, and history of how similar deals have closed.
- Group the historical deals by segment and size.
- Calculate the close rate for each segment and size group.
- Ignore deals under a quarter old.
Return the historical close rate for each segment and size group.
Adjust each rep's called number
The agent applies the historical close rate to what each rep called and calculates an adjusted number. It then names anyone over-calling or under-calling by more than ten per cent, so RevOps can see where the called forecast and the history differ most.
Adjust what each rep called using the historical close rates from the previous step.
Input: this quarter's current commits by rep, and the historical close rate for each matching segment and size group.
- Apply the matching historical close rate to what each rep called.
- Calculate the adjusted number for each rep.
- Compare each adjusted number with the rep's called number.
- Name every rep who is over-calling or under-calling by more than ten per cent.
Return the adjusted number for each rep, then name everyone over-calling or under-calling by more than ten per cent.
Write the adjusted forecast to the opportunity
Finally, the agent writes the adjusted forecast to the opportunity beside the rep's called number. Both stay visible, so RevOps can compare what the rep called with the number based on how similar deals have closed.
- Update: The adjusted forecast on the opportunity
- Keep: The rep's original called number
Adjusted forecasts beside called numbers, with over and under-callers named for RevOps
See each adjusted forecast beside the number the rep called, based on how deals of the same segment and size have closed before. RevOps can compare the two numbers and see which reps are over-calling or under-calling by more than ten per cent.
- For RevOps: Review the adjusted forecasts each week and check where a rep's called number differs from the historical close rate.
AI Agents that pair well
Same data, different jobs. Run them together for a fuller picture.


Learn more about GTM & Revenue Operations
RevOps Lab Podcast


50+ Free GTM & RevOps Cheat Sheets

Free RevOps Community (1k+ members)
.webp)